


fig2
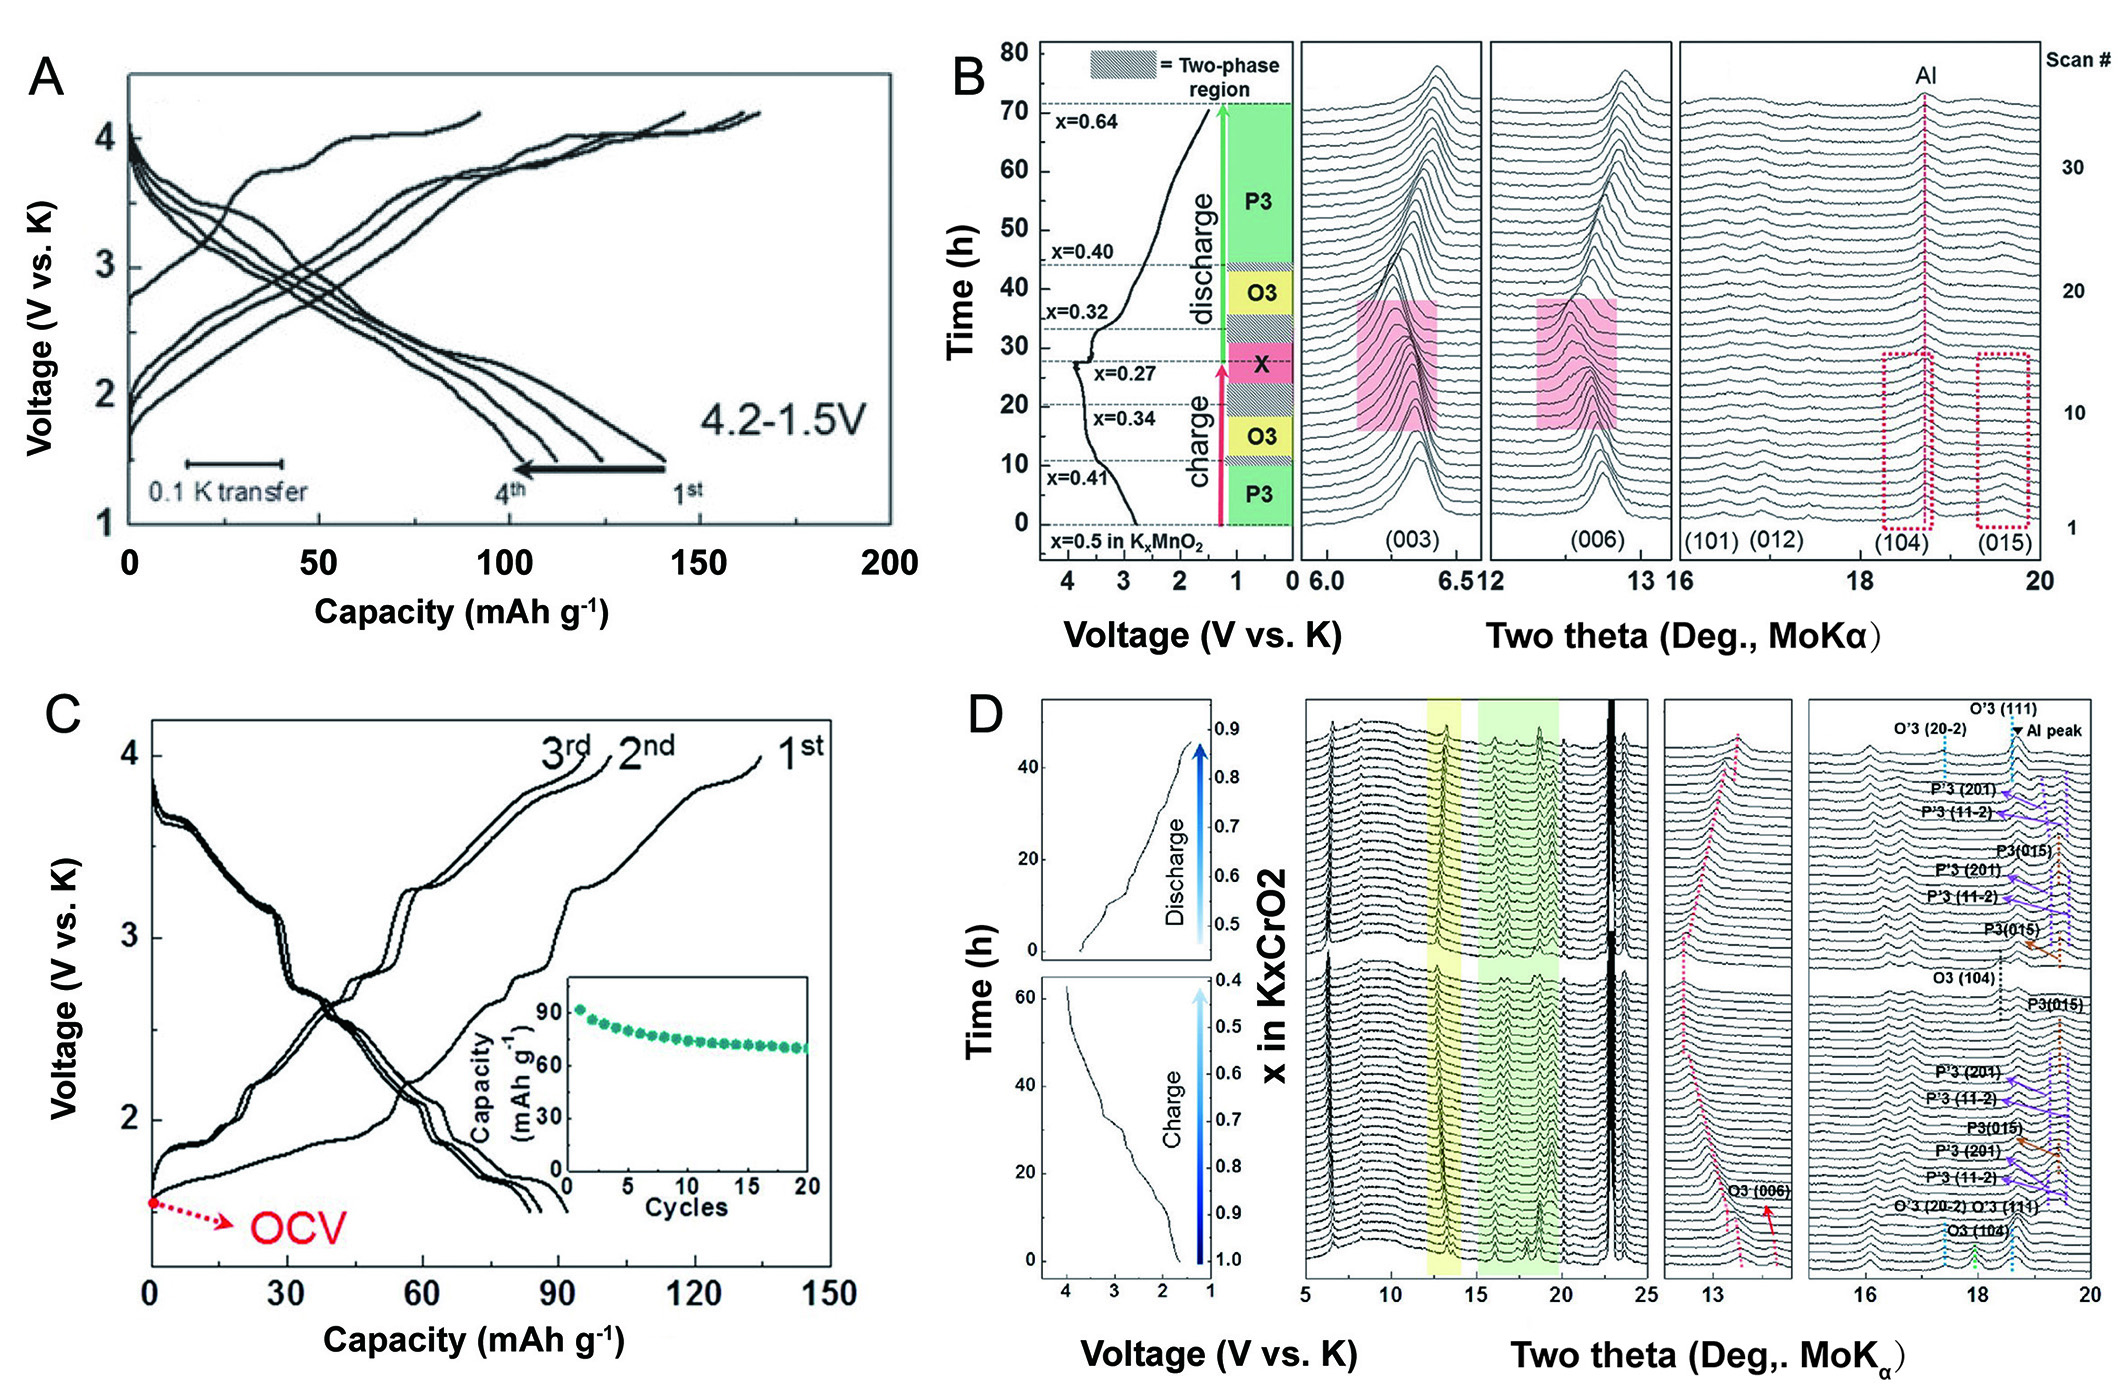
Figure 2. (A) GCD curves and (B) In-situ XRD pattern of P3-K0.5MnO2 between 1.5-4.2 V[52]. (A and B) Reprinted with permission from Ref.[52]. Copyright 2017 Wiley-VCH[52]. (C) GCD curves and (D) In-situ XRD pattern of O3-KCrO2[40]. (C and D) Figures reprinted with permission from Ref.[40]. Copyright 2018 American Chemical Society[40].


