


fig1
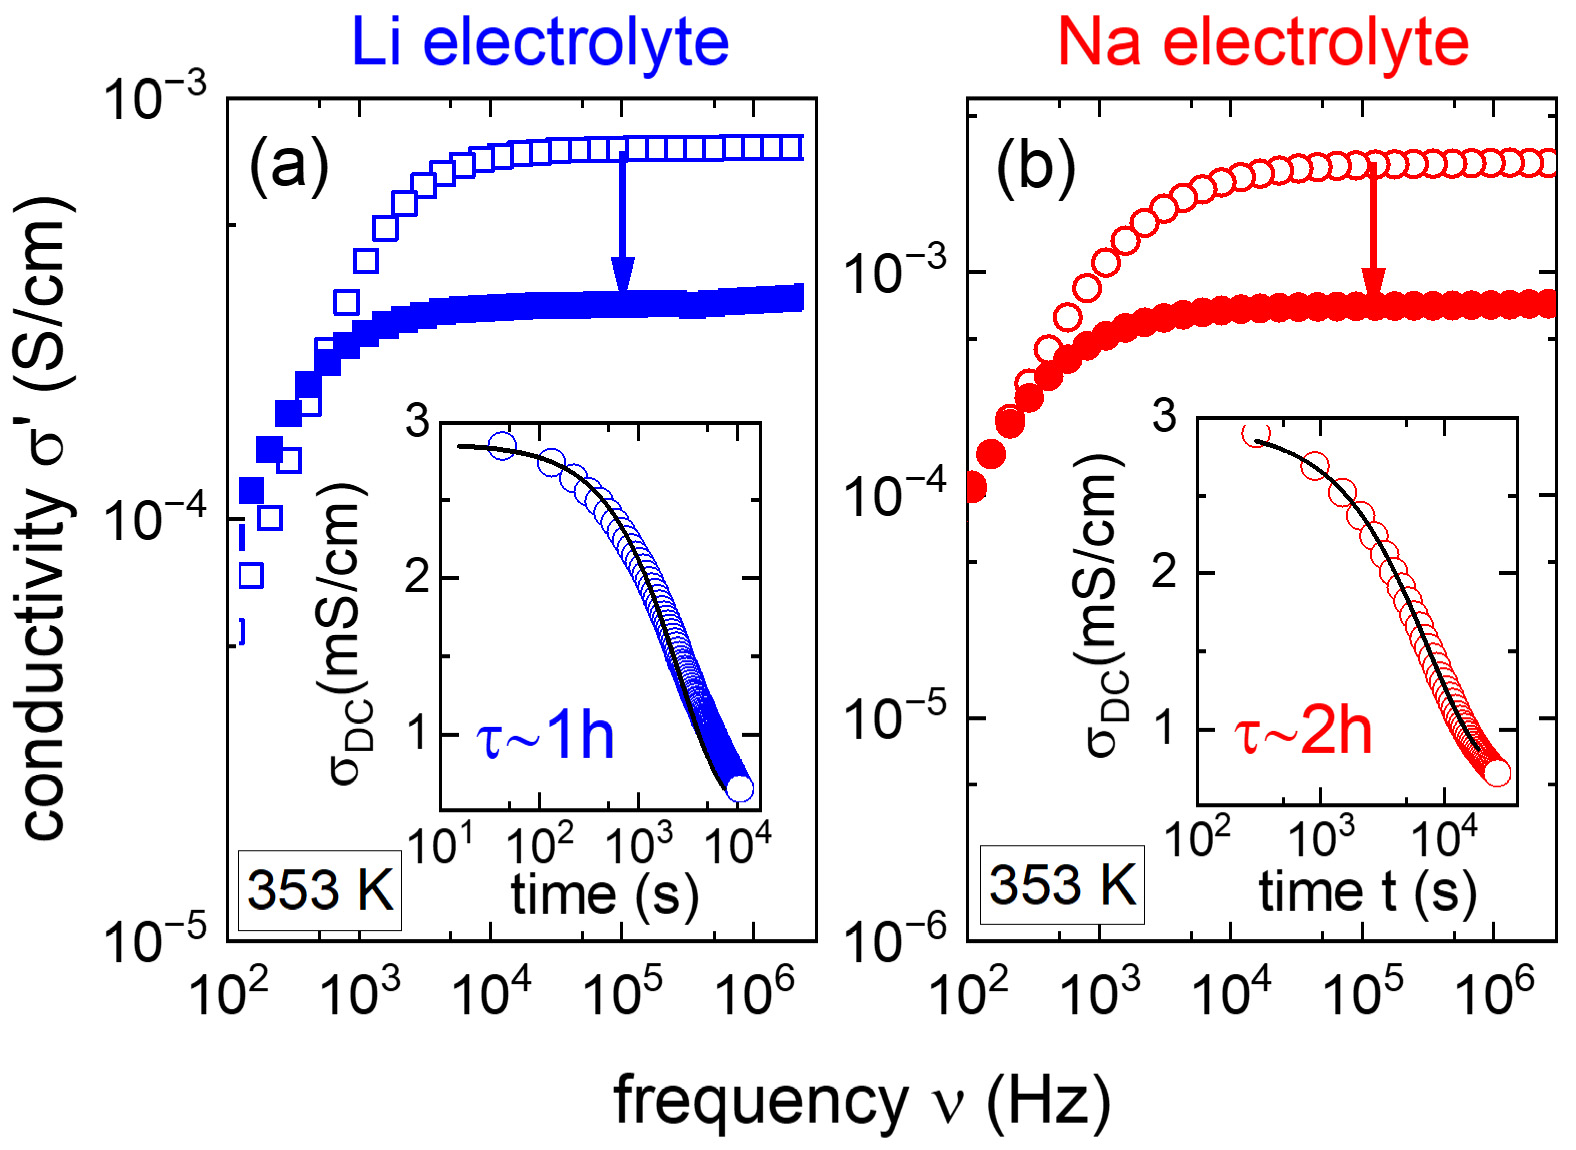
Figure 1. Selected spectra illustrating the evolution of the conductivity response during the polymerization/ crosslinking process induced at 80 °C for (A) Li electrolyte and (B) Na electrolyte. The two insets present the corresponding time evolution of σ0 for the two materials. The solid lines represent fits using exponential decay functions.


