

fig9
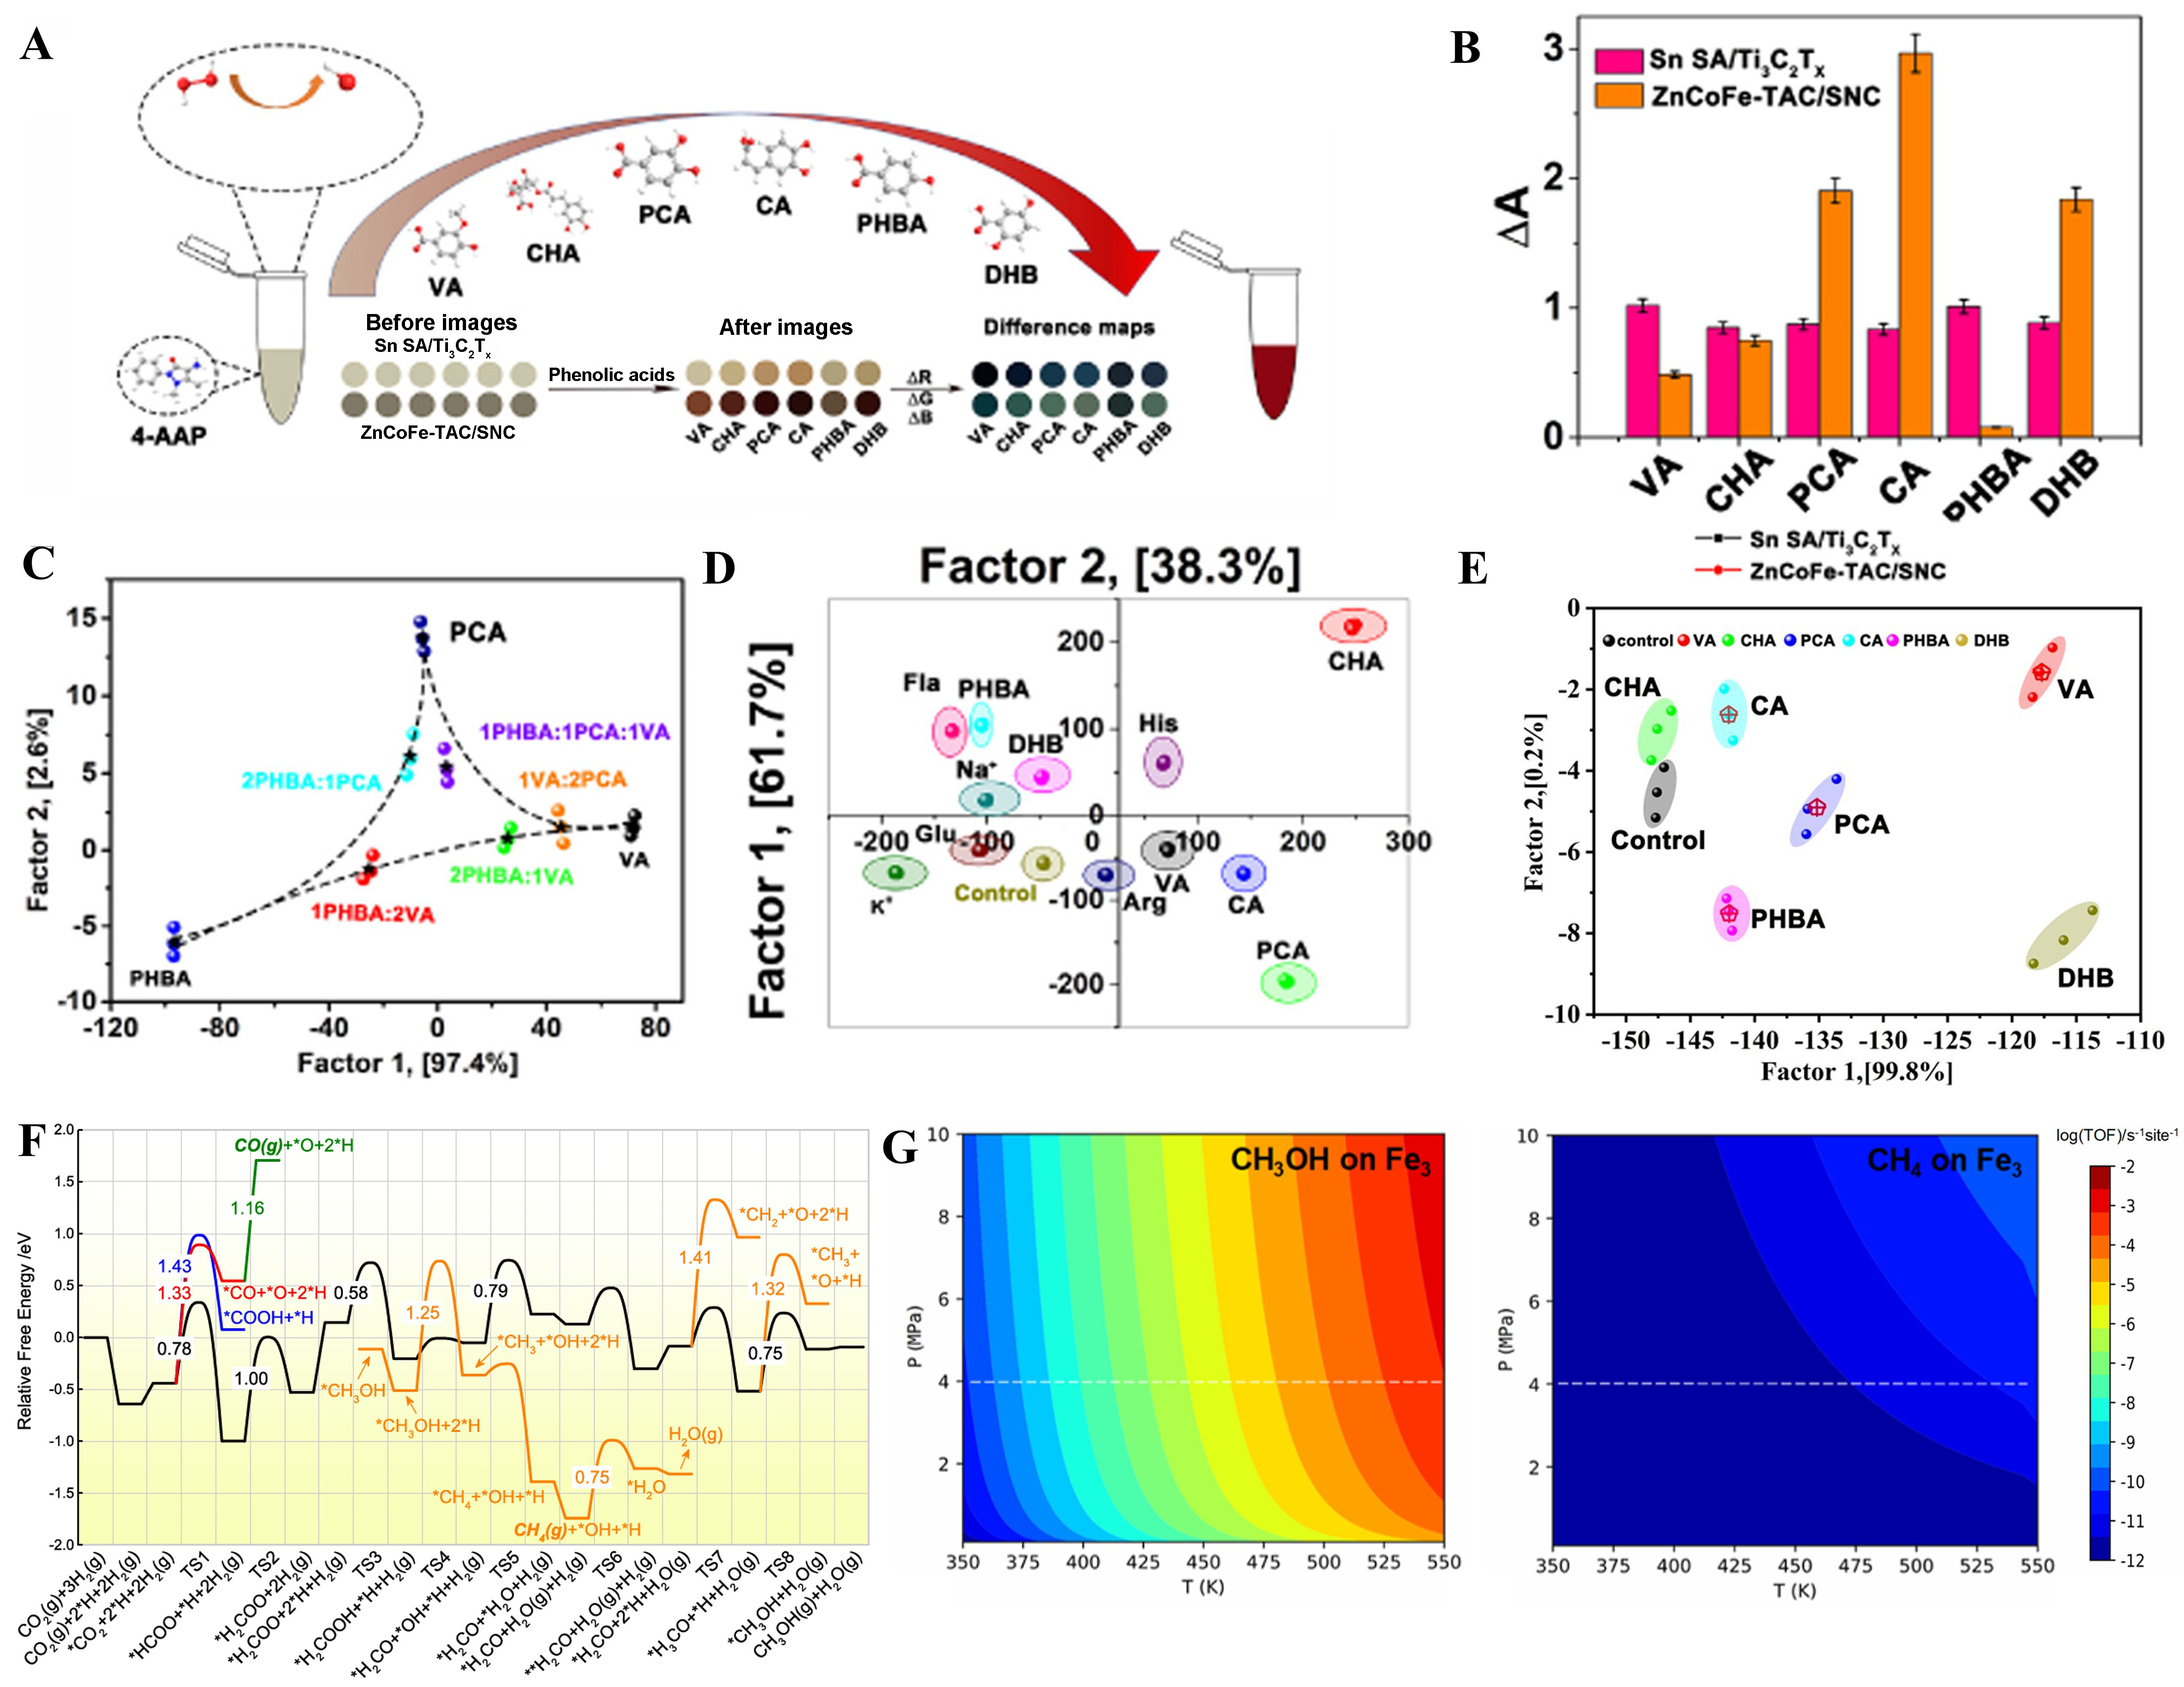
Figure 9. (A) The mode of the sensor array for discrimination of phenolic acids based on the two nanozymes; (B) Response pattern; (C) LDA scores plot for identifing phenolic acid mixtures; (D) LDA scores plot for iidentifing phenolic acids against interfering substances and the sample without adding any analyte; (E) LDA scores plot for discriminating six phenolic acids at 0.1, 1, and 10 mM in the presence of serum[157], Copyright 2023, American Chemical Society; (F) Reaction mechanism and relative activation energy of CO2 hydrogenation reaction on Fe3/MoS2-v; (G) TOF maps of products at Fe3/MoS2-v[91], Copyright 2023, American Chemical Society. LDA: Linear discriminant analysis; TOF: turnover frequency.


