

fig8
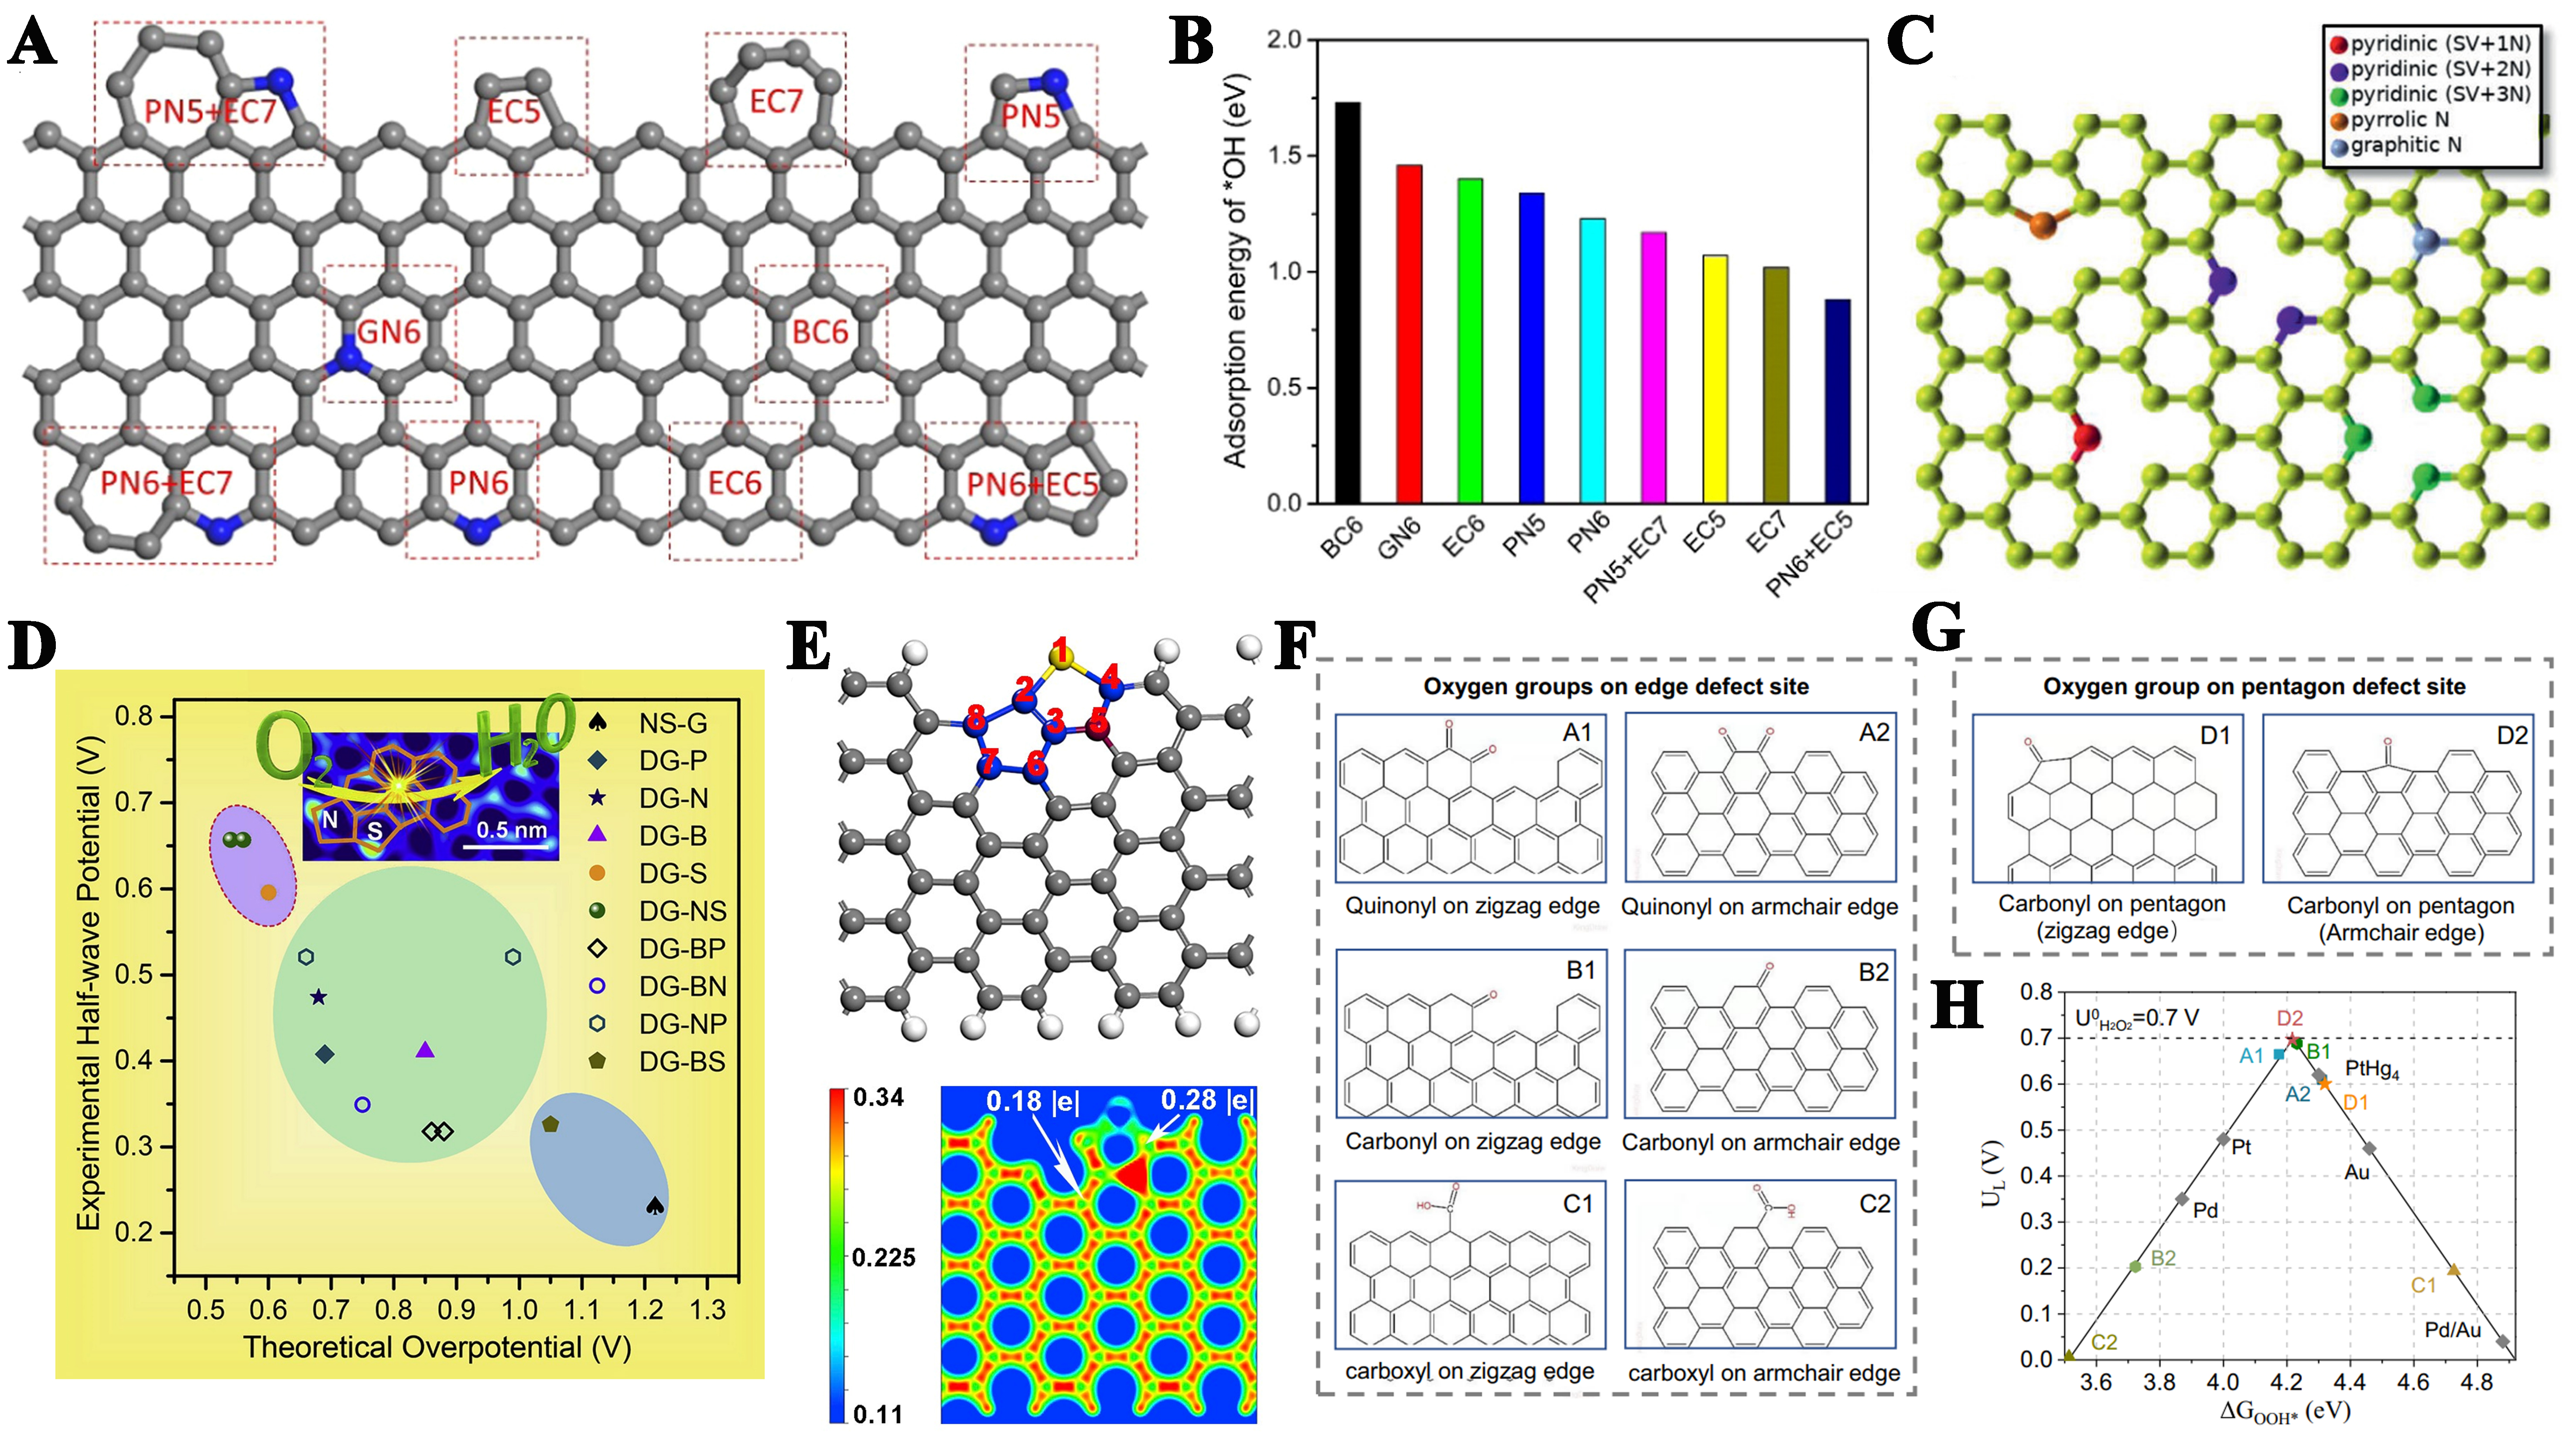
Figure 8. (A) Schematic representation of graphene at various potential active sites; (B) corresponding *OH adsorption energies for different reaction centers. This figure is quoted with permission from Zhang et al.[175]; (C) Schematic N-doped sites in graphene. This figure is quoted with permission from Fernandez-Escamilla et al.[176]; (D) Correlative analysis between experimentally determined half-wave potentials and computationally derived overpotentials for various samples under acidic conditions. This figure is quoted with permission from Yan et al.[177]; (E) The optimized structures of the N-S-D-G model; the electron density corresponding to N-S-D-G; the blue and red regions indicate electron-donating and electron-withdrawing areas, respectively. This figure is quoted with permission from Li et al.[178]; (F and G) The atomic structures of the examined O-groups on edge and pentagon defect sites; (H) The calculated activity volcano map This figure is quoted with permission from Wu et al.[179].


