

fig4
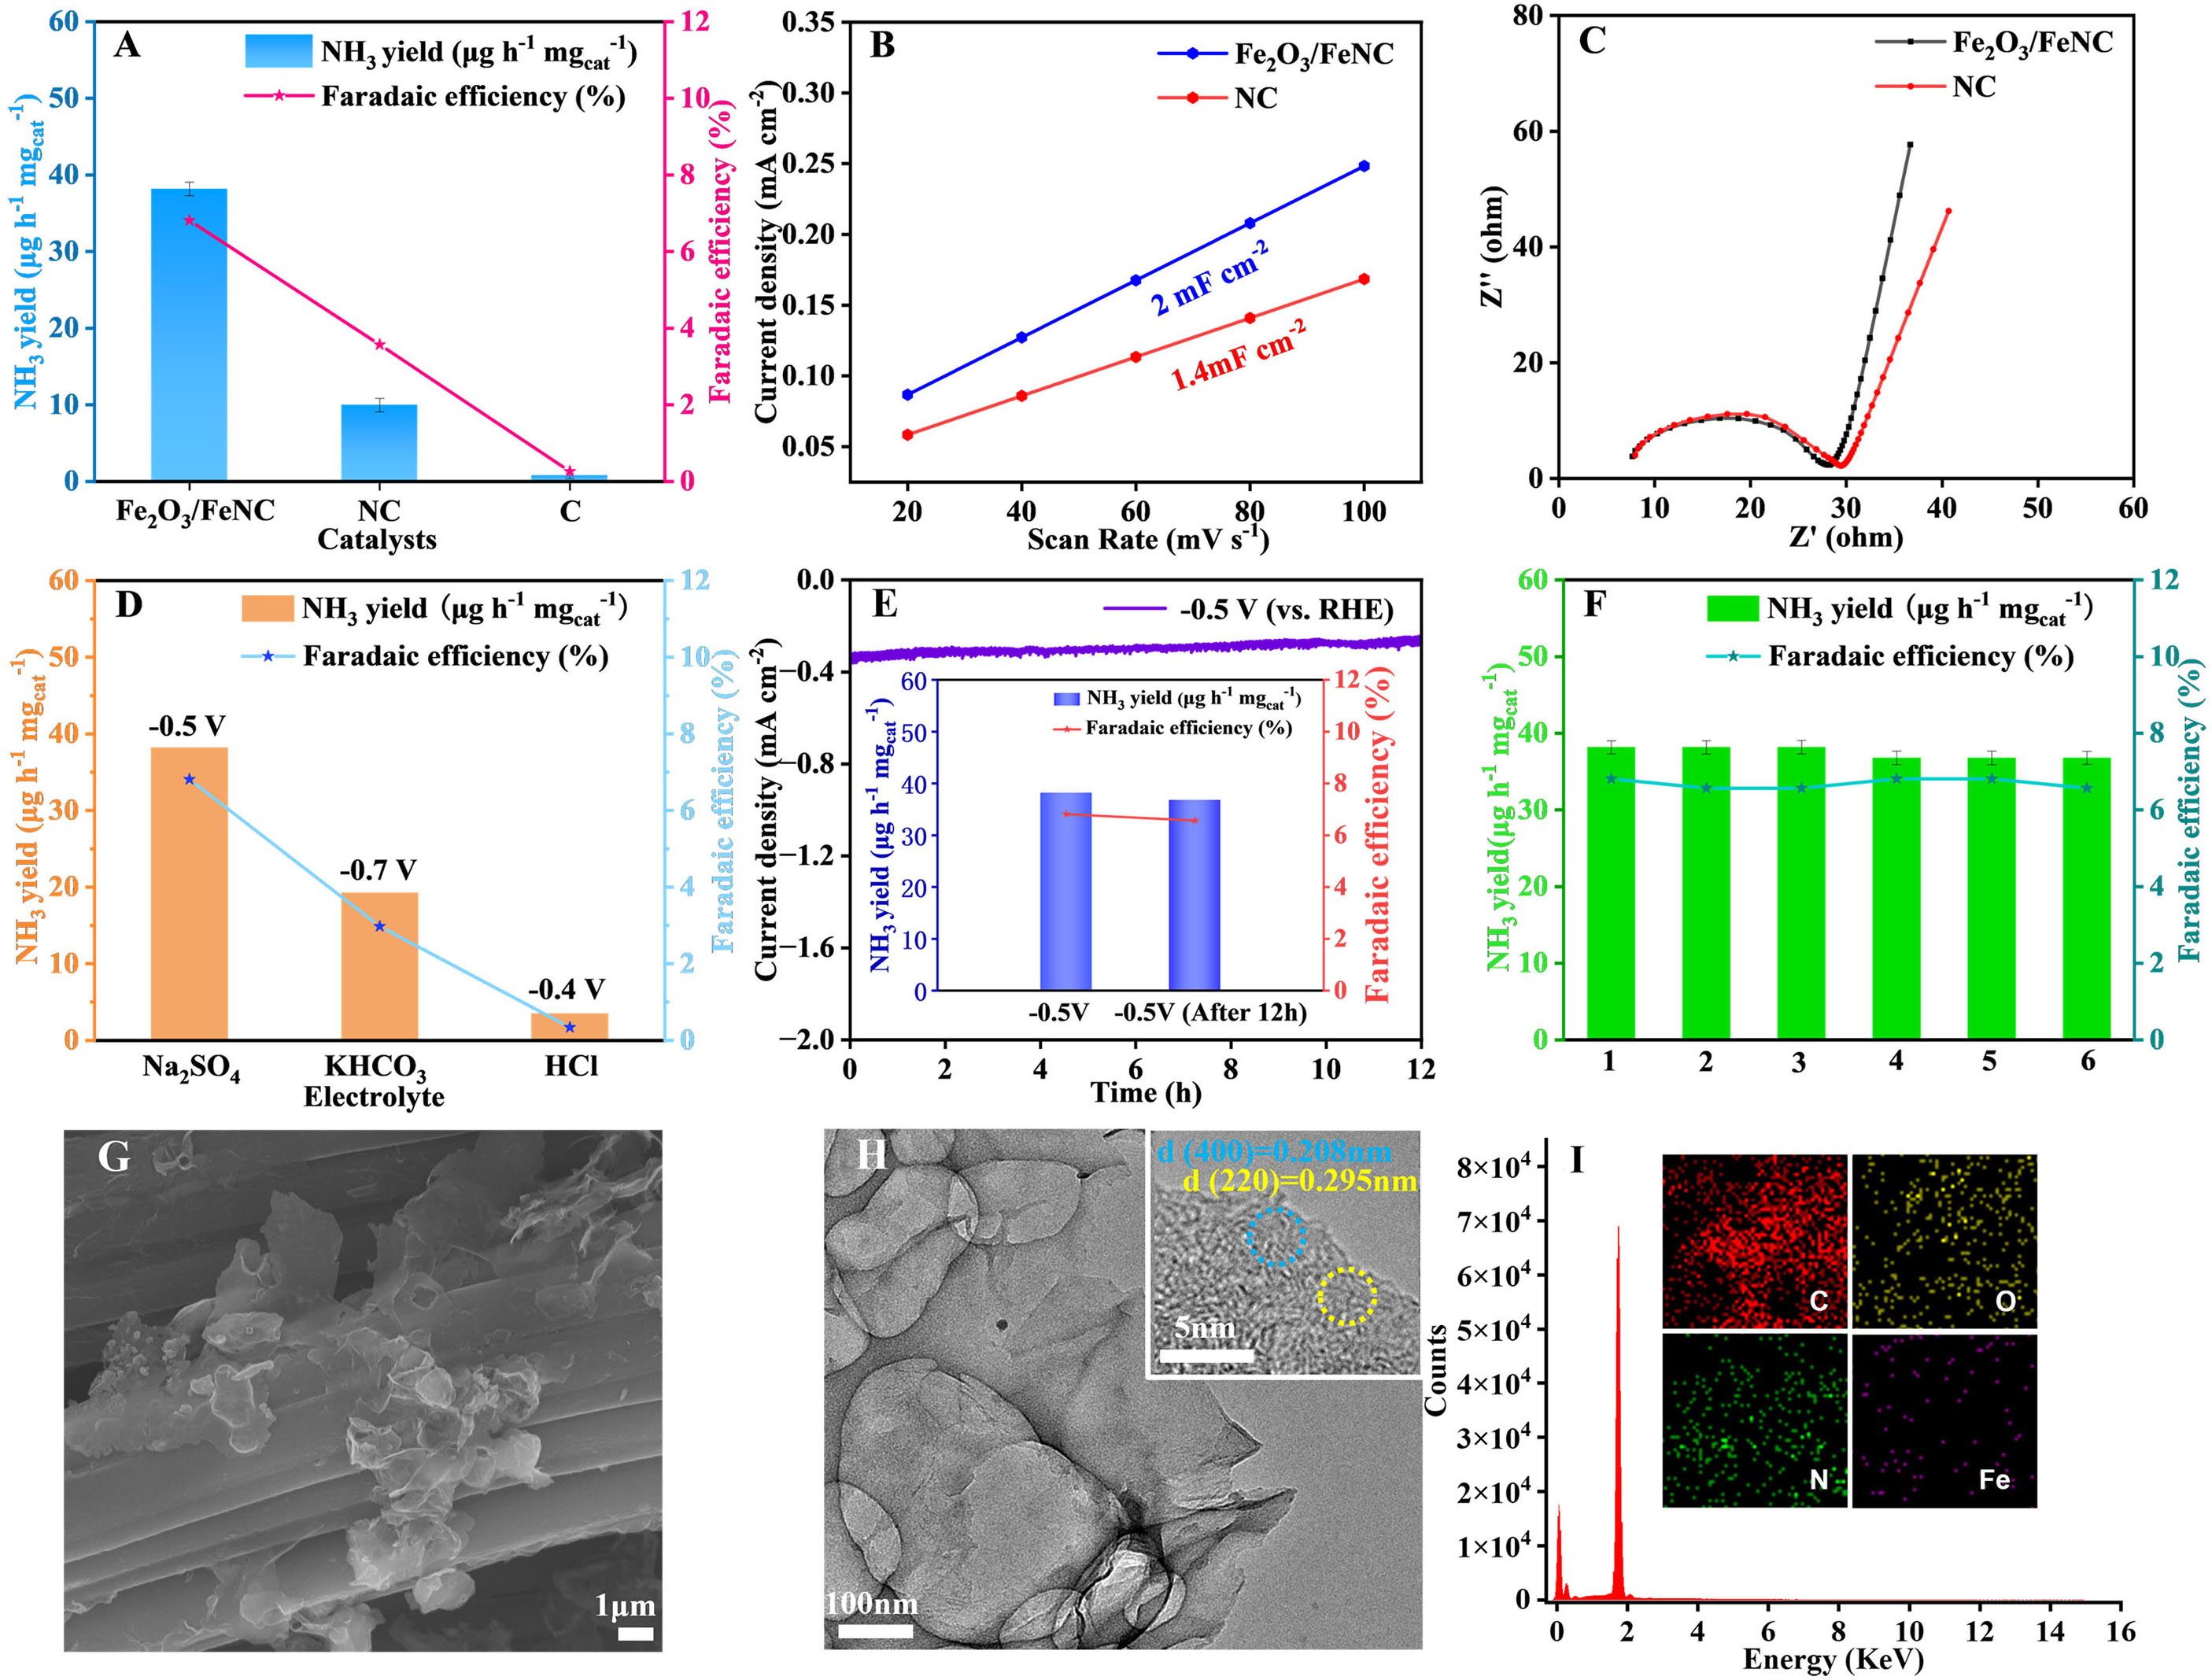
Figure 4. (A) NH3 yields and FEs of different catalysts obtained in 0.1 M Na2SO4; (B) Cdl and (C) Nyquist plots of Fe2O3/FeNC and NC; (D) Optimal NH3 yields and FEs of Fe2O3/FeNC obtained in different electrolytes; (E) Time-dependent current density curve of


