



fig2
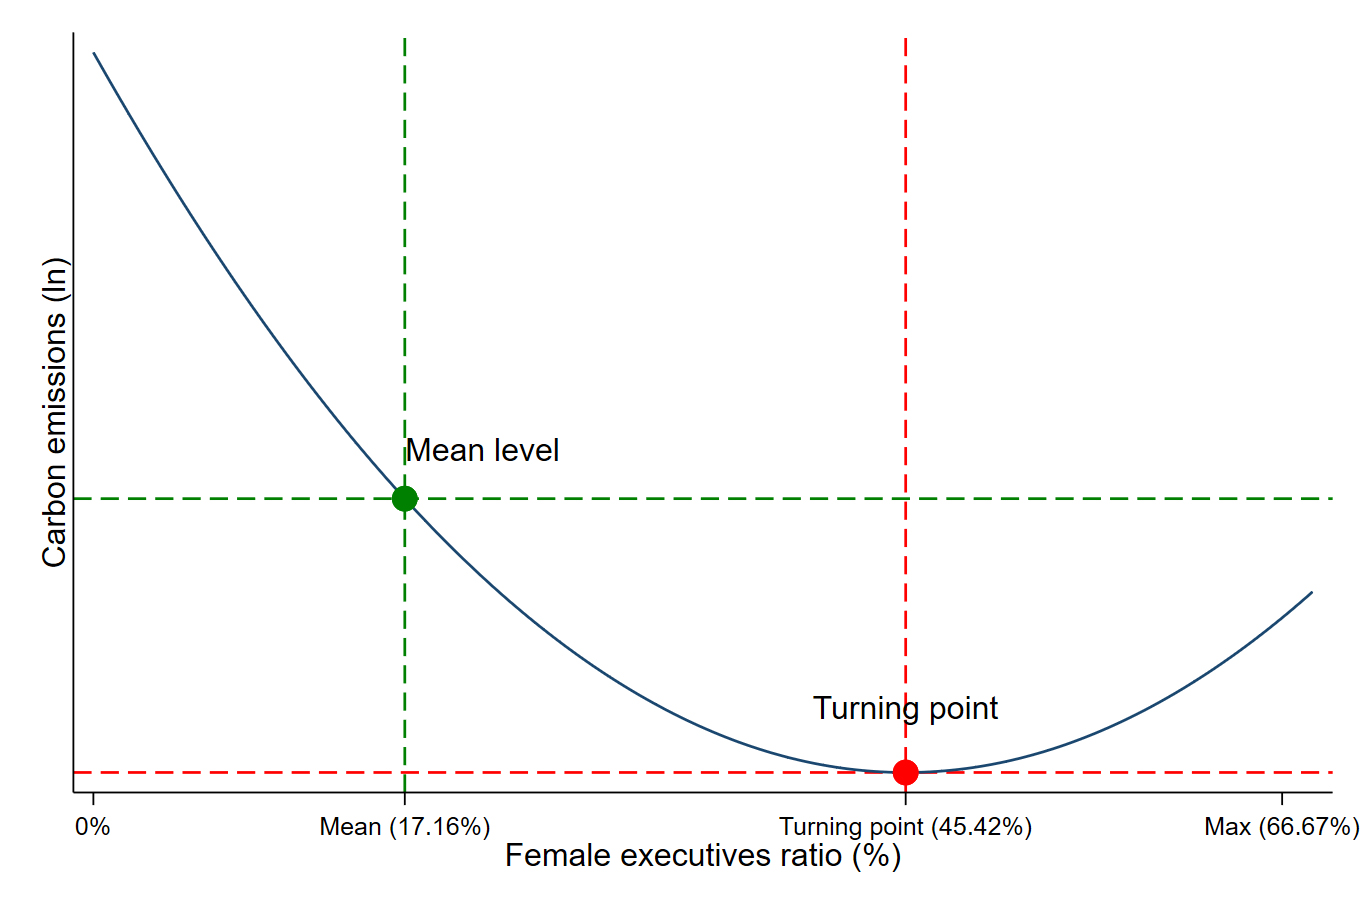
Figure 2. Nonlinear analysis. The fitted curve is based on a quadratic specification. The observed range of female executive ratio is 0%-66.67%, with a turning point of 45.42%.
Figure 2. Nonlinear analysis. The fitted curve is based on a quadratic specification. The observed range of female executive ratio is 0%-66.67%, with a turning point of 45.42%.


All published articles are preserved here permanently
https://www.portico.org/publishers/oae/


