



Environmental impact of China's semi-solid-state batteries: a cradle-to-gate life cycle assessment
 0
0 Abstract
Rising demand for lithium-ion batteries (LIBs) is driven by booming new energy vehicles and grid storage, yet conventional liquid LIBs face thermal runaway risks and high embodied carbon. As a transitional technology between liquid LIBs and all-solid-state batteries, semi-solid-state batteries (SSSBs) deliver outstanding electrochemical performance and match existing production lines, gaining wide industrial and academic attention. Following ISO 14040 and ISO 14044, this study applies life cycle assessment with the China Local Life Cycle Database to evaluate nine environmental indicators of SSSBs within a cradle-to-gate (CTG) scope, including global warming potential, primary energy demand, and abiotic depletion potential. Sensitivity and uncertainty analyses are conducted to validate result reliability. Quantitative outcomes demonstrate that the aggregate CTG carbon footprint of SSSBs totals 133.64 kg CO2 eq, among which NCM811 cathode materials dominate emissions at a contribution ratio of 81.1%. Raw material logistics generate 0.136 kg CO2 eq of carbon loads, with cathode transport accounting for 59.2% of logistics emissions. Over 98% of manufacturing greenhouse gas emissions stem from electricity consumption, and cell formation and dry rooms are the most energy-intensive units. Hazardous waste transportation dominates emissions in the waste treatment stage. This work fills the gap of localized industrial life cycle inventories for Chinese SSSBs, identifies key carbon hotspots, and provides low-carbon strategies and theoretical support for production optimization, industrial policy formulation, and national clean energy transition.
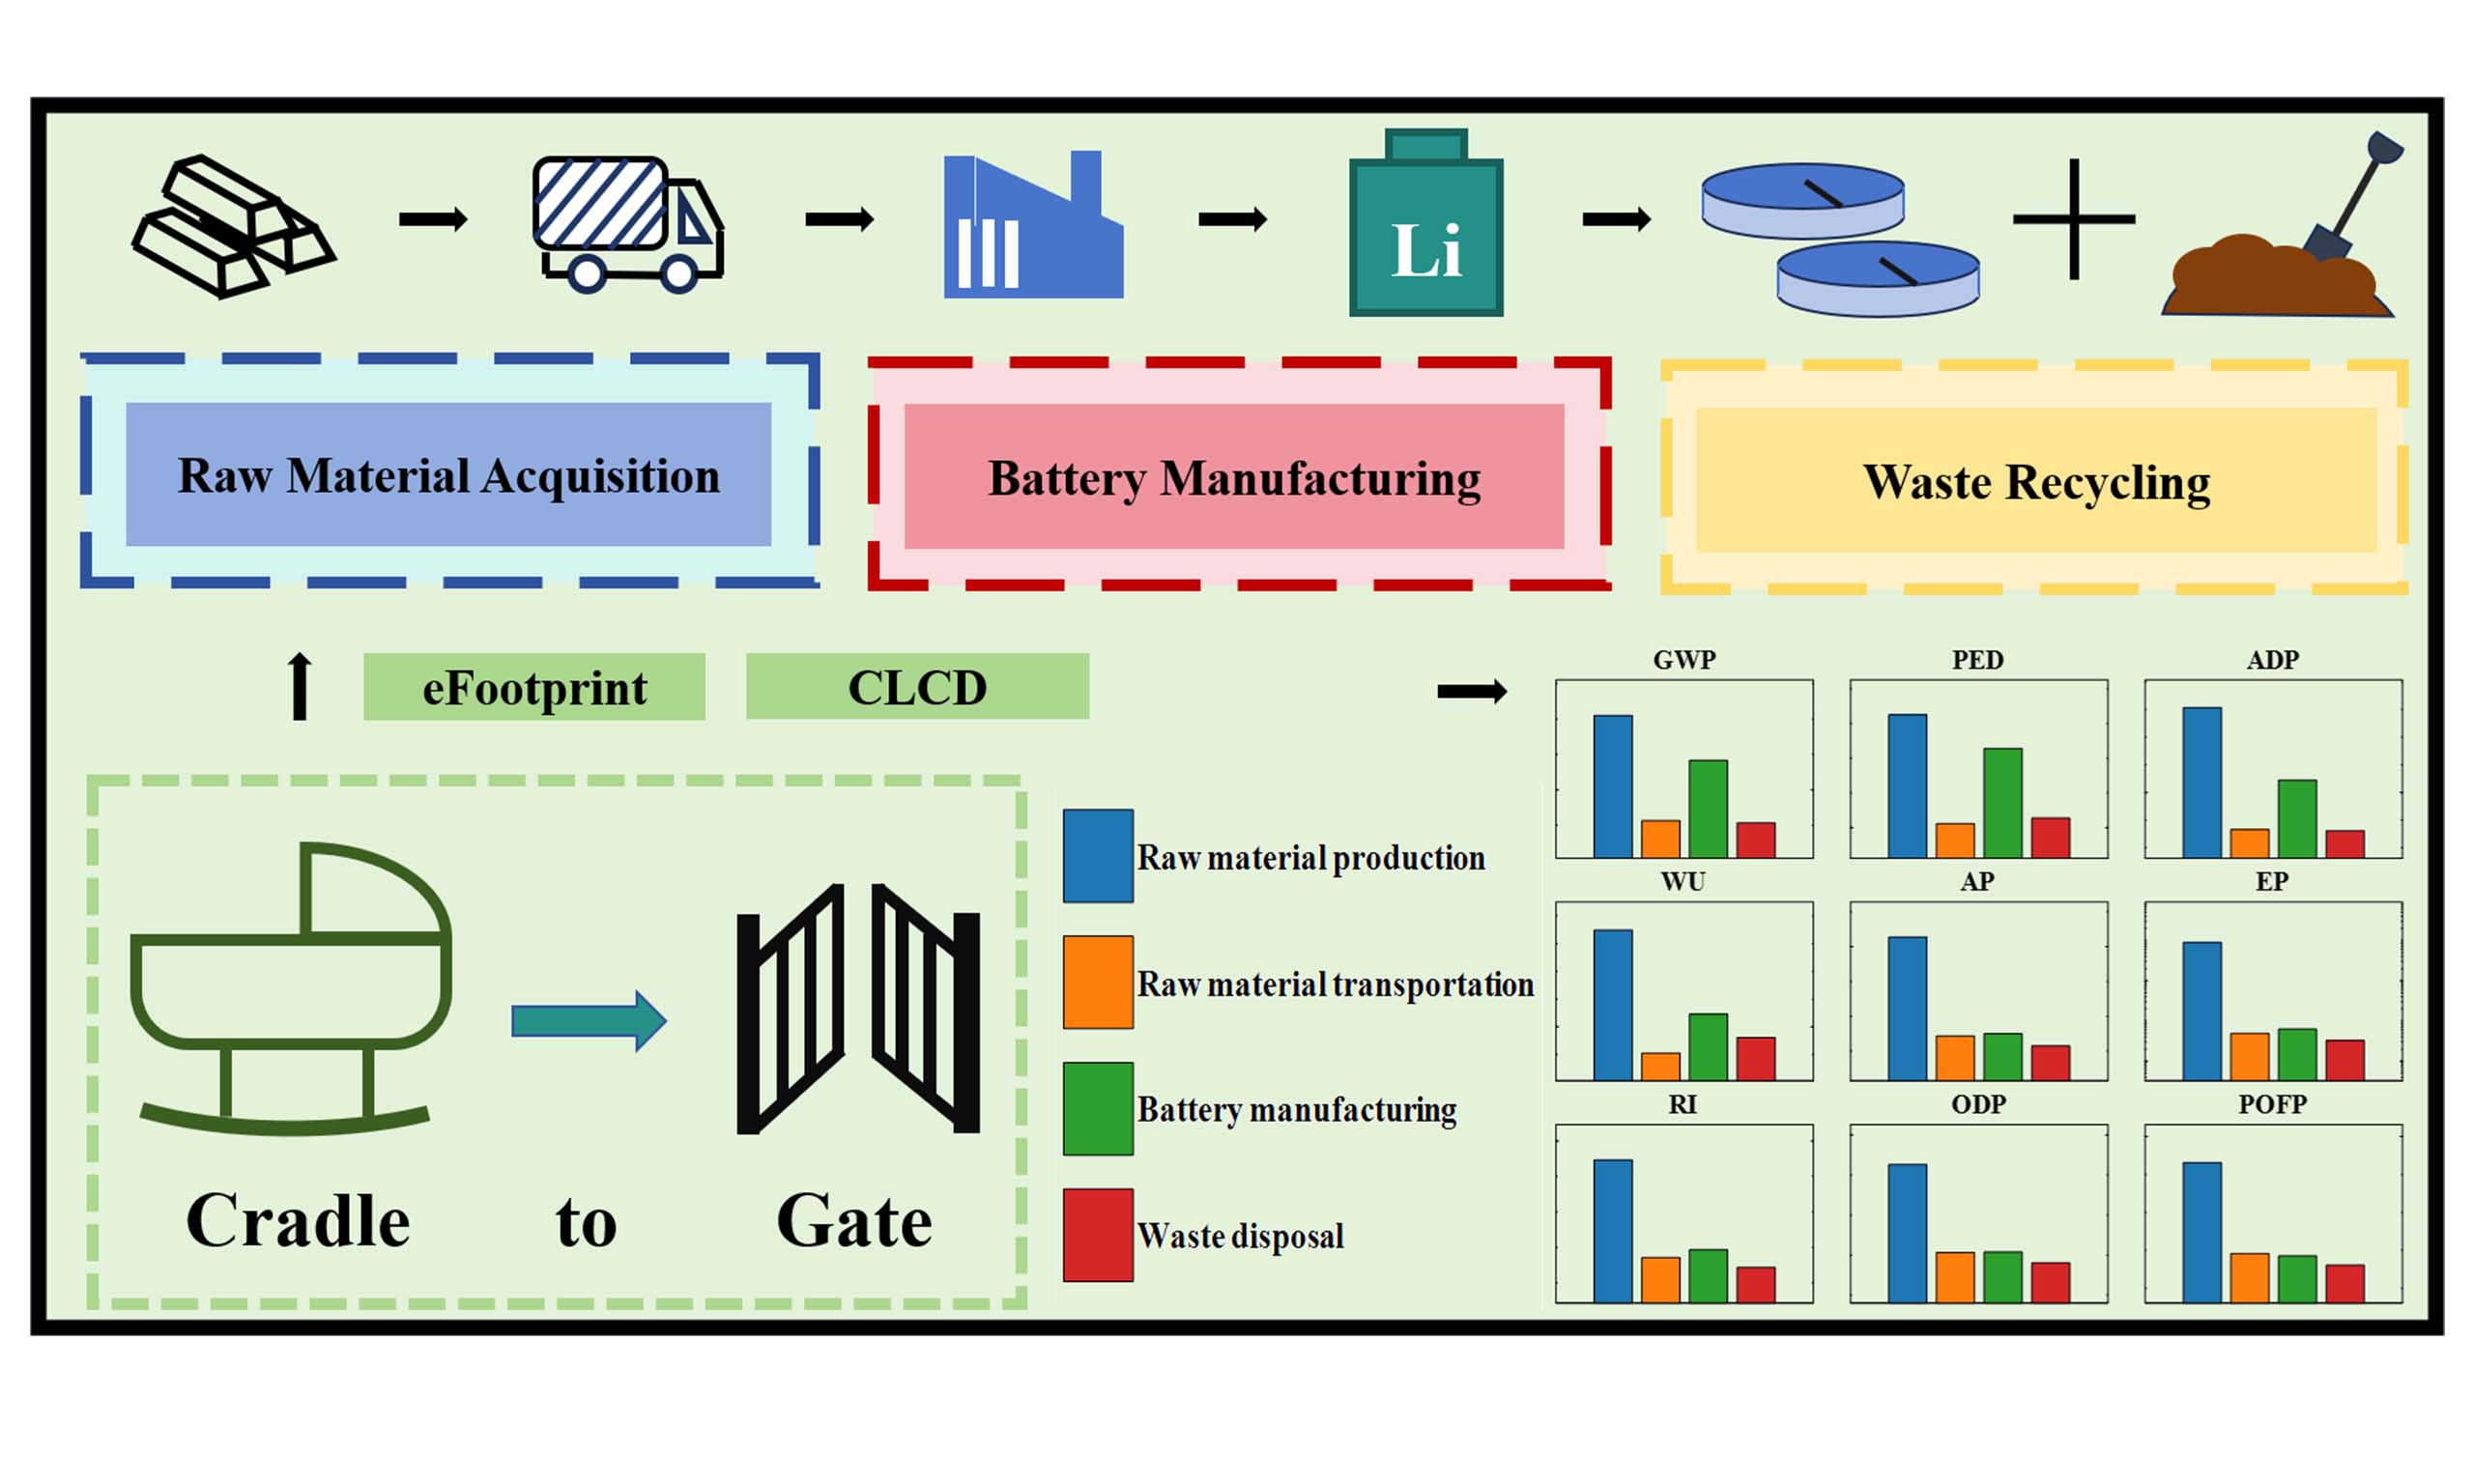
Keywords
INTRODUCTION
Massive capacity expansion of global new energy passenger vehicles and stationary energy storage facilities has spurred exponential growth in market demand for lithium-ion batteries (LIBs)[1]. The World Economic Forum projects that worldwide battery demand will reach 2,600 GWh by 2030[2,3]. Nevertheless, extensive greenhouse gas emissions released during LIB fabrication impede the low-carbon transition of renewable energy sectors and constrain sustainable energy deployment. Conventional liquid LIBs are limited by volatile liquid electrolytes and inferior thermal stability, which readily trigger catastrophic thermal runaway accidents and fail to satisfy market demands for extended driving mileage and enhanced safety performance[4,5]. As a transformative intermediate technology linking liquid LIBs and all-solid-state batteries (ASSBs), semi-solid-state batteries (SSSBs) lower the loading of liquid electrolytes while incorporating solid electrolyte components, delivering concurrent improvements in intrinsic safety, low-temperature performance, and volumetric energy density[6-8]. Additionally, SSSBs retain compatibility with prevailing LIB production lines and incur moderate factory reconstruction expenses. Global shipments of solid-state batteries (SSBs) reached 5.3 GWh in 2024, all of which correspond to SSSB products. Market forecasts predict that global SSB shipments will surge to 614.1 GWh by 2030, with SSSBs capturing approximately 70% of total market volume[9]. Such large-scale commercialization of SSSBs will inevitably generate extensive ecological burdens across upstream and downstream industrial chains[10].
Extensive life cycle assessment (LCA) efforts have previously evaluated environmental externalities associated with commercial LIBs, revealing distinct carbon footprint distribution patterns for nickel-cobalt-manganese (NCM) ternary and lithium iron phosphate (LFP) cell chemistries[11]. Prior scholarship has pinpointed cathode material synthesis, copper/aluminum current collector production, and electrolyte preparation as primary environmental hotspots within LIB life cycles[12]. In contrast, LCA investigations targeting ASSBs remain nascent in academic research[13-17]. Existing literature has quantified environmental burdens stemming from wet-phase synthesis of sulfide solid electrolytes and validated that solvent substitution (ethyl acetate replacing tetrahydrofuran) yields a 30% reduction in global warming potential (GWP), verifying solvent selection as a decisive moderator of solid electrolyte environmental performance[18]. Relative to wet coating workflows, dry manufacturing technologies cut production energy consumption by 47.6% and deliver superior outcomes in GWP mitigation and fossil resource preservation, highlighting fabrication methodology as a dominant determinant of ASSB environmental footprints[19]. Holistic sustainability evaluations for ASSBs and lithium-sulfur ASSBs corroborate that solid-state architectures outperform conventional liquid LIBs across environmental and social sustainability metrics; solid electrolyte manufacturing and energy-intensive dry room operations constitute their dominant environmental liabilities[20,21]. For oxide-type ASSBs at the end-of-life stage, scholars have constructed LCA frameworks covering pyrometallurgical, hydrometallurgical and direct recycling routes, demonstrating that direct recycling delivers economic merits yet faces unresolved technical bottlenecks[22]. LCA analyses of lab-scale oxide ASSBs identify manufacturing electricity consumption as the dominant emission driver, alongside lanthanum, lithium and zirconium as critical scarce mineral resources; scaled industrial production is capable of drastically lowering associated environmental pressures[23]. Comparative climate impact evaluations across diverse ASSB electrolyte systems illustrate that oxide-based ternary ASSBs exert higher climate burdens than conventional liquid LIBs, whereas polymer LFP ASSBs deliver GWP levels comparable to traditional counterparts. Minimizing the consumption of non-cathode auxiliary materials represents the core strategy for attenuating ASSB environmental footprints[24]. A cradle-to-gate (CTG) LCA focusing on oxide solid electrolyte ASSBs reports elevated overall environmental impacts relative to liquid LIBs, with thinner electrolyte layers and enhanced manufacturing energy efficiency proven effective at mitigating cumulative ecological loads[25]. Contemporary research concerning SSSBs predominantly centers on solid electrolyte optimization, interfacial engineering and electrochemical performance enhancement[26]. Relevant experimental outcomes confirm that composite electrolyte design and interfacial modulation can markedly elevate ionic conductivity and cyclic stability[27,28]. Supplementary investigations have developed electro-thermal coupling models, characterized real-vehicle operational profiles and multi-physical field responses of SSSBs, and systematically clarified internal resistance, heat generation mechanisms and capacity degradation behavior with full model validation[7,29]. Collectively, prevailing academic literature suffers from heterogeneous background databases, inconsistent system boundary definitions and divergent impact evaluation protocols, creating an urgent demand for standardized analytical frameworks to enable fair cross-technology comparative assessments[4]. Prior researchers have established an integrated life cycle evaluation framework for SSB environmental sustainability, which improves the credibility of life cycle inventory (LCI) data and identifies high-temperature sintering and electrolyte synthesis as primary manufacturing-stage carbon hotspots for solid-state cells[30].
Notwithstanding existing advances, SSSBs exhibit fundamental disparities from ASSBs in raw material formulations and full-process manufacturing workflows. To date, comprehensive quantitative assessments of full-production environmental burdens for SSSBs remain scarce, and CTG LCA tailored to China’s industrial manufacturing landscape is largely absent. As a globally standardized analytical tool for quantifying product, process and activity-level environmental externalities, LCA enables full-spectrum accounting of ecological loads spanning raw material extraction to finished cell fabrication, serving as a foundational methodology to objectively quantify SSSB environmental advantages and prioritize carbon abatement targets. The majority of global LIB LCA studies adopt foreign background databases (e.g., Ecoinvent, GaBi), which fail to reflect China’s unique power generation mix, domestic manufacturing standards and localized supply chain layouts. Furthermore, current SSB LCA research overwhelmingly focuses on laboratory-produced ASSBs, while industrially calibrated CTG environmental inventories specific to China’s SSSB sector remain unavailable. Under this research gap, CTG LCA of domestically manufactured SSSBs built upon the Chinese Local Life Cycle Database (CLCD) carries significant theoretical significance and practical value: it addresses the shortage of localized industrial life cycle datasets, provides technical support for low-carbon production process upgrades, and delivers quantitative evidence for targeted industrial policy formulation.
This work employs the LCA methodology paired with the indigenous CLCD to systematically characterize CTG environmental impact profiles of commercially manufactured SSSBs in China, with dedicated emphasis on ecological burdens originating from raw material extraction and cell fabrication. Three core research contributions are outlined as follows:
(1) This study quantifies and assesses the CTG carbon footprint of SSSBs via standardized LCA protocols, precisely pinpointing dominant impact factors to furnish targeted guidance for industrial carbon mitigation.
(2) A multi-category environmental indicator system is integrated into the evaluation framework to unpack the holistic ecological footprints of domestic SSSB production, offering scientific underpinnings for regional clean energy transition and differentiated industrial incentive policies.
(3) Coupled sensitivity and uncertainty assessments quantify the marginal contribution of key process parameters to overall environmental outcomes, generating robust inventory data to support subsequent manufacturing optimization.
The organizational structure of this manuscript is outlined below. Section "DATA AND METHODS" details the fundamental datasets and LCA methodologies deployed within this research. Section "RESULTS AND DISCUSSION" presents quantitative carbon footprint results alongside supplementary environmental indicator data, followed by a comprehensive sensitivity analysis. Section "CONCLUSION" synthesizes core research conclusions derived from the full-scale CTG assessment.
DATA AND METHODS
LCA methodology
LCA constitutes a systematic analytical framework designed to quantify environmental burdens incurred by products, activities, and processes across their full service lifespan[31]. Consistent with ISO 14040 and ISO 14044 international standards, a complete LCA workflow encompasses four sequential core modules: goal and scope definition, LCI analysis, life cycle impact assessment (LCIA), and result interpretation[32]. The logical interconnections among these four modules are illustrated in Figure 1. The present LCA framework quantifies greenhouse gas emissions alongside eight supplementary environmental impact categories for SSSBs within China’s domestic industrial context, based on 2024 manufacturing operational data.
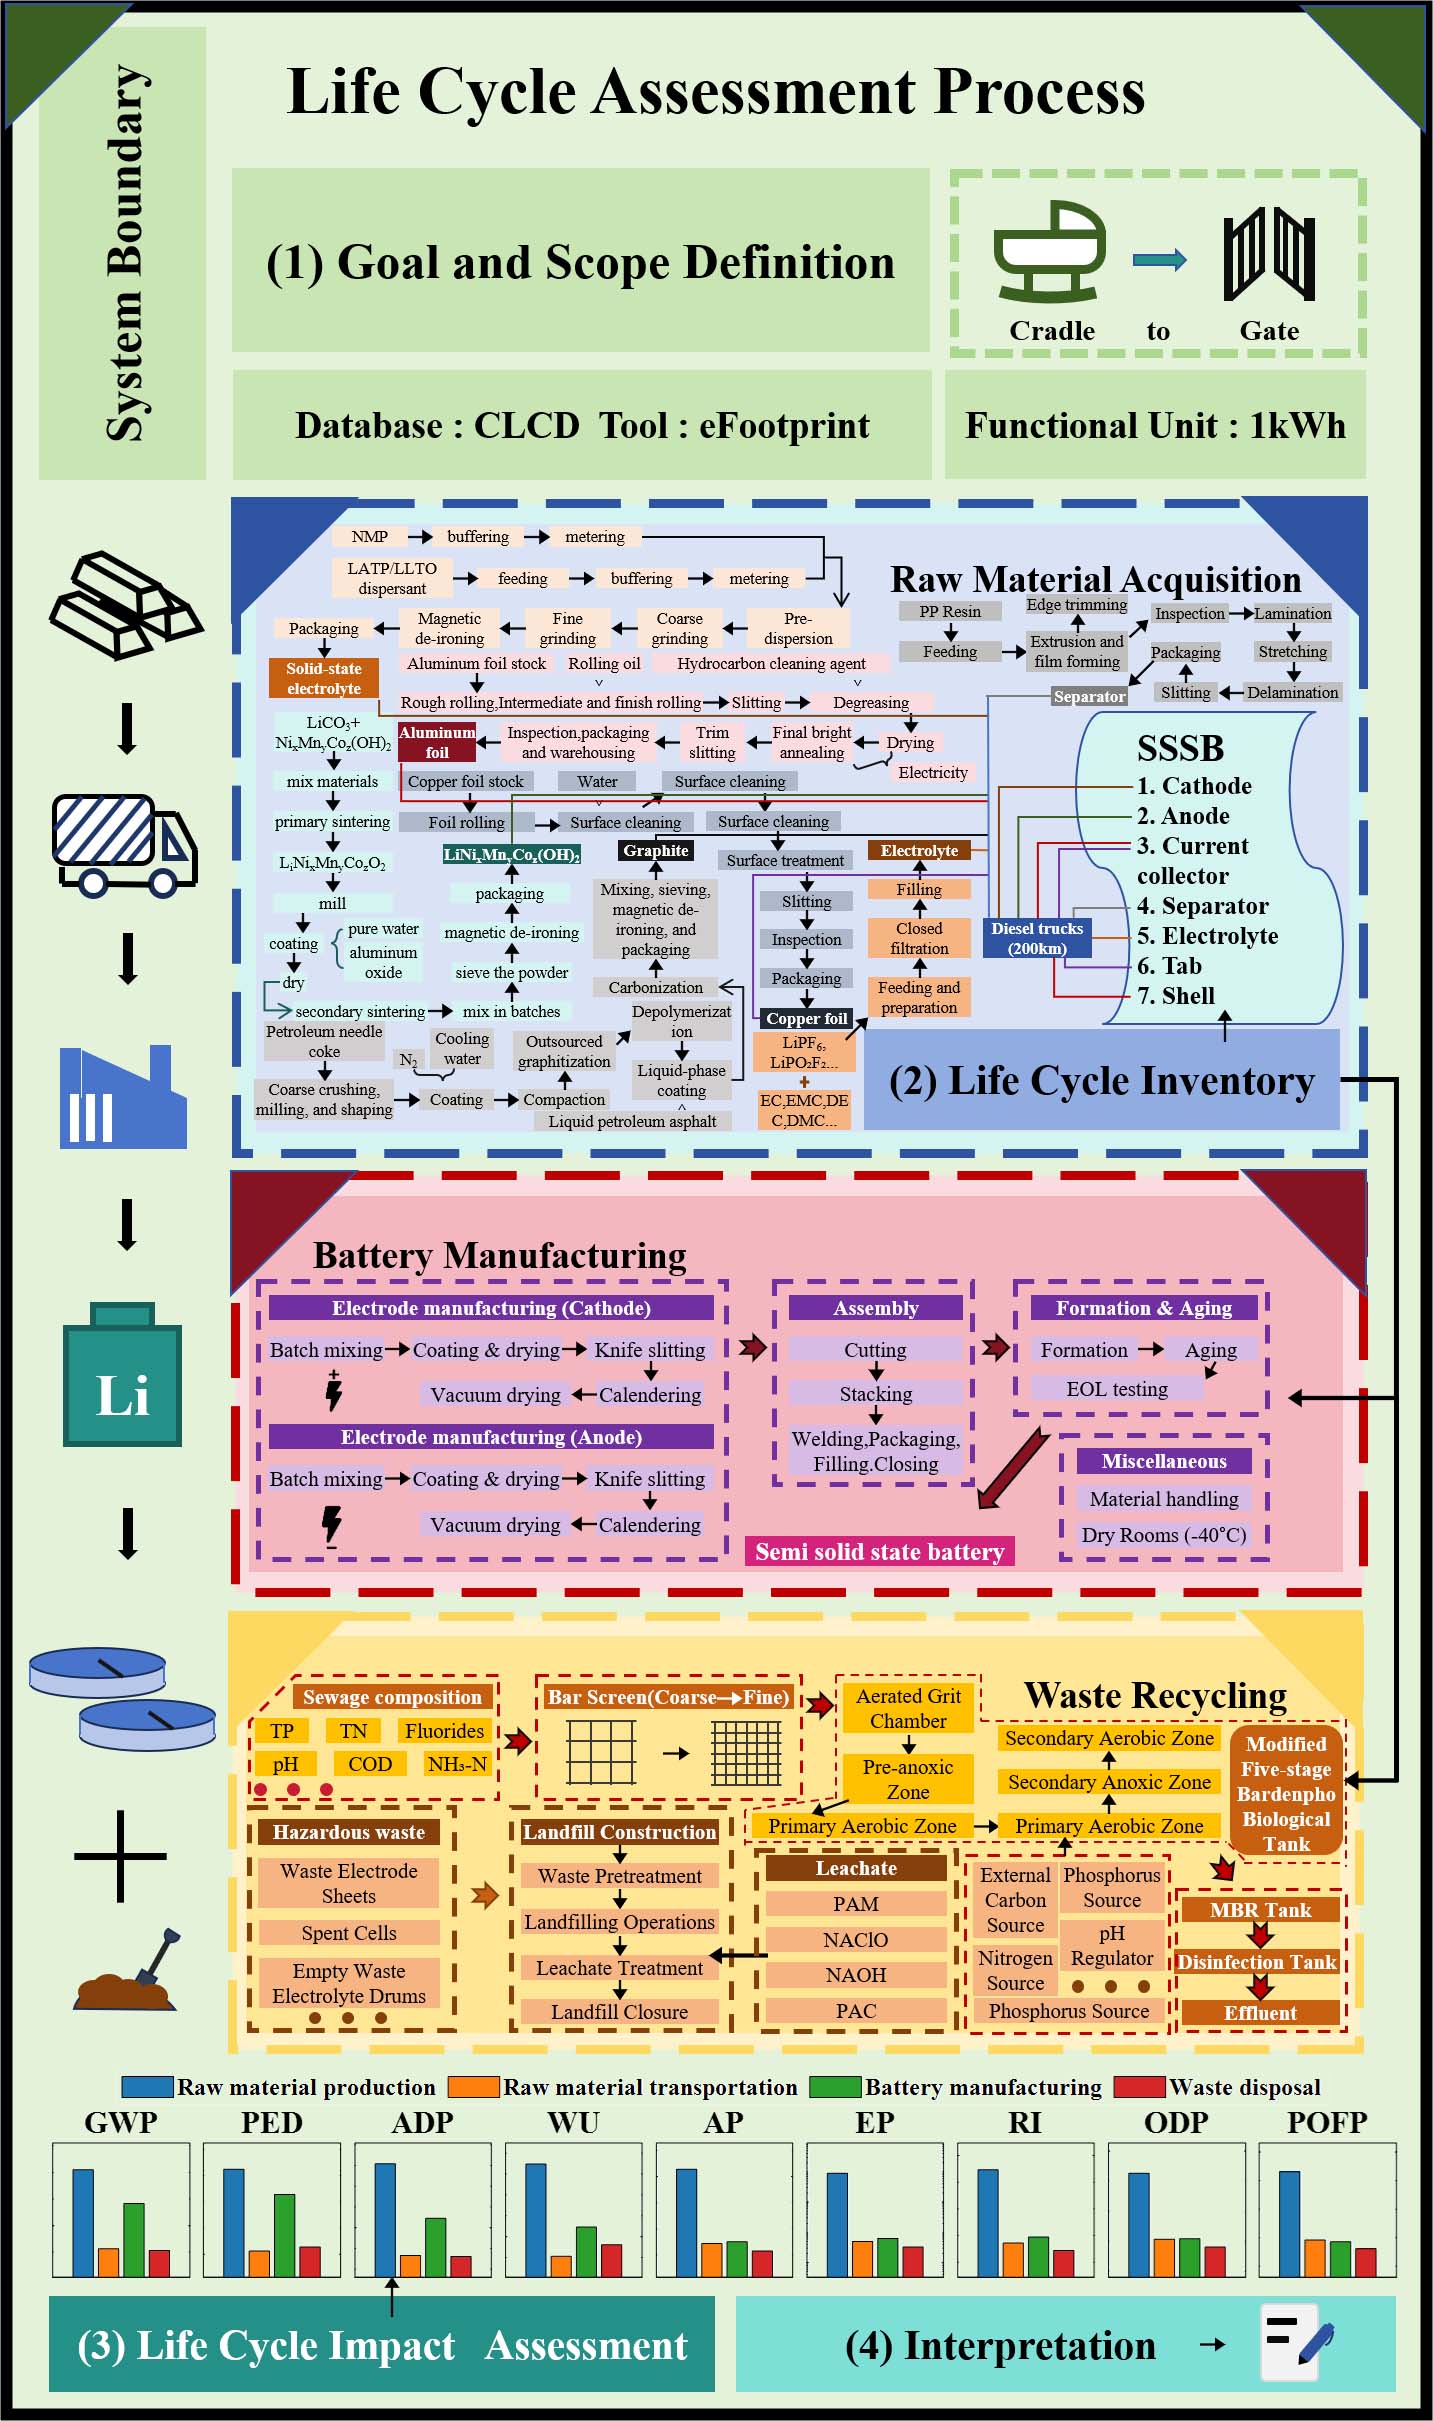
Figure 1. Scope framework of LCA.
System boundary and functional unit
The product system boundary delineates all processes included within the assessment scope, covering every elementary energy and material flow embedded in individual manufacturing workflows[33]. The CTG boundary defined in this research encapsulates three interconnected modules for domestic SSSB production: raw material acquisition, battery fabrication, and on-site waste disposal. The raw material acquisition stage is further split into upstream raw material synthesis and cross-regional raw material logistics. Each battery production workflow exhibits distinct power and thermal energy consumption profiles, which necessitates independent boundary segmentation for each fabrication sub-process. All waste streams generated post-manufacturing are treated in compliance with national emission standards or transferred to certified professional waste treatment facilities. System input flows comprise fossil and renewable energy feedstocks plus all battery raw materials, while output streams include particulate pollutants, non-methane hydrocarbons (NMHC), and various solid waste fractions with ecological hazards. The functional unit adopted for all CTG impact calculations is 1 kWh of finished SSSB product, corresponding to the nominal rated energy capacity of cells upon factory delivery[34].
Environmental indicators
All inventory and impact datasets deployed in this analysis are sourced from the CLCD and the eFootprint modeling platform. GWP is designated as the primary characterization metric to quantify carbon footprints. A suite of nine complementary environmental impact categories is integrated to deliver a holistic sustainability evaluation, including GWP, primary energy demand (PED), abiotic depletion potential (ADP), water use (WU), acidification potential (AP), eutrophication potential (EP), respirable particulate formation potential (RI), ozone depletion potential (ODP), and photochemical ozone formation potential (POFP). The abbreviation and full name comparison table of environmental indicators and other terms in this article can be found in Supplementary Table 1. Detailed LCIA characterization models, reference characterization factors, equivalent units, and standardized calculation protocols for all nine indicators are documented in Supplementary Table 2 to guarantee full methodological transparency.
LCI analysis
The LCI dataset is constructed using 2024 actual operational records obtained from a domestic Chinese SSSB manufacturer, combined with publicly released official industrial statistics in China. The SSSB cell adopts nickel-cobalt manganese oxide, nickel:cobalt:manganese ratio of 8:1:1 (NCM811) as the cathode precursor; lithium aluminum titanium phosphate (LATP) and lithium lanthanum titanium oxide (LLTO) serve as cathode and anode solid electrolytes, respectively. The full background dataset is summarized in Supplementary Table 3. For the liquid electrolyte, lithium hexafluorophosphate (LiPF6) serves as the main lithium salt, dissolved in a composite solvent system based on propylene carbonate (PC), ethylene carbonate (EC), dimethyl carbonate (DMC) and ethyl methyl carbonate (EMC). Multiple auxiliary carbonates, lithium salt additives, and sulfonate functional agents such as diethyl carbonate (DEC), vinyl carbonate (VC), fluoroethylene carbonate (FEC), and 1,3-propane sultone (PS) are further blended into the formulation, while ethyl acetate and lithium-salt-doped dimethyl carbonate are used as processing purifiers. Aluminum and nickel alloys are selected as conductive materials for electrode tabs. Key observations derived from LCI data collation are outlined below: NCM811 cathode precursor occupies the largest mass fraction among all raw and auxiliary inputs, functioning as the core material that determines the cell’s energy density performance.
Process solvents (purified water and N-methyl-2-pyrrolidone, NMP) represent the second-largest mass input category. Water-based anode slurries consume substantially more purified water than the NMP-dependent oil-based cathode slurry system, marking the primary compositional distinction between cathode and anode slurry preparation workflows.
Graphite serves as the dominant anode precursor, with silicon oxide incorporated as a low-dose additive to elevate specific capacity. This material combination balances cyclic durability and volumetric energy density trade-offs.
Cathode and anode binder formulations display evident compositional divergence. The combined mass loading of styrene butadiene rubber (SBR) and carboxymethyl cellulose (CMC) for anodes far exceeds the polyvinylidene fluoride (PVDF) dosage used for cathodes, reflecting stricter stability requirements for aqueous anode slurries.
Cathode-side solid electrolyte slurry consumption surpasses that of the anode; the mass input of LATP dispersion liquid is markedly higher than that of LLTO dispersion liquid, a structural design optimized to stabilize cathode-electrolyte interfacial contact.
Liquid electrolyte is maintained at a moderate loading level, retaining the ion transport advantages of hybrid solid-liquid architectures while distinguishing SSSBs from conventional LIBs with excessive liquid electrolyte filling volumes.
Sensitivity analysis
A carbon footprint sensitivity assessment was conducted to identify dominant contributing factors and establish a clear priority hierarchy for industrial carbon abatement. The sensitivity coefficient is defined as the percentage variation in overall stage carbon footprint induced by a ±20% fluctuation of a single parameter. Larger sensitivity coefficient magnitudes indicate that minor deviations in the corresponding sub-process or raw material trigger substantial shifts in total greenhouse gas emissions, marking high-priority optimization targets.
The sensitivity evaluation framework covered three core production phases: raw material procurement, cell manufacturing, and waste remediation. For the fabrication stage, three energy fluctuation scenarios were differentiated to decouple the respective impacts of electricity and natural gas: synchronous variation of total energy inputs, independent fluctuation of electricity consumption only, and independent fluctuation of natural gas consumption only. This tripartite classification quantifies the differentiated carbon-footprint responses driven by the power grid mix and thermal process energy loads. The sensitivity coefficient calculation formula is defined as Equation (1):
where SCi,j denotes the sensitivity coefficient (%) corresponding to the j-th sub-process or raw material within the i-th production stage; Ci,j refers to the carbon footprint (kg CO2 eq) generated by the j-th sub-stage or raw material; Δ represents the standardized parameter fluctuation amplitude, fixed at 0.2 (±20%) across all model calculations; Ci,total equals the aggregated total carbon footprint of the entire i-th production stage.
Notably, SCi,j maintains a strict linear proportional relationship with the fluctuation amplitude Δ. If alternative fluctuation ranges of ±10% or ±30% are adopted, all sensitivity coefficients will scale proportionally by factors of 0.5 and 1.5, respectively, without altering the relative ranking of high-impact parameters or carbon reduction priority sequences. Supplementary multi-scenario sensitivity simulations therefore deliver no incremental insight for hotspot identification, rendering a unified ±20% fluctuation bandwidth sufficient to reliably differentiate high-magnitude impact factors from negligible contributors. All sensitivity computations are executed on the eFootprint platform integrated with the CLCD database, covering every key raw material and manufacturing sub-process across the full CTG boundary.
Research scenarios
The CTG environmental impact model for SSSBs is established on the eFootprint software platform paired with the CLCD background database, split into three independent modular scenarios corresponding to raw material acquisition, cell fabrication, and waste remediation.
Raw material acquisition phase
The raw material acquisition module is subdivided into upstream raw material synthesis and inter-factory raw material transportation. A standalone CTG inventory model is constructed for every input material to quantify embedded environmental burdens. All material-specific inventory datasets are extracted from domestic LIB manufacturers’ environmental impact assessment reports, with detailed LCI records cataloged in Supplementary Tables 4-22. The transportation sub-module accounts for all emissions generated during delivery from upstream chemical plants to the SSSB manufacturing facility. Logistics energy consumption and associated carbon footprints are quantified based on the net mass of each transported raw material[31]. A medium-distance transport radius of 200 km is adopted, with 18-ton heavy-duty diesel trucks specified as the exclusive delivery vehicle.
Battery manufacturing phase
The fabrication module is developed by integrating standardized industrial SSSB production workflows with peer-reviewed, authoritative energy consumption benchmarks documented for full-scale solid-state battery production lines[35]. The complete manufacturing value chain covers cathode/anode electrode fabrication, cell assembly, formation cycling, and static aging. Electrode production encompasses batch material homogenization, precursor coating and drying, calendering, slitting, and multi-stage vacuum drying. Cell assembly workflows include electrode blank cutting, layer stacking, tab welding, aluminum plastic packaging, electrolyte injection, and hermetic sealing. Post-assembly formation and aging procedures consist of electrochemical formation cycles, long-duration static maturation, and final end-of-line performance testing. Electricity and natural gas represent the two primary energy carriers consumed throughout all fabrication sub-processes[36].
Waste disposal phase
This module exclusively models the treatment of hazardous byproducts and industrial wastewater generated on-site prior to finished cell delivery, excluding post-service battery recycling. Environmental burden calculations for waste streams leverage the embedded waste impact calculation function within eFootprint and the CLCD inventory framework. The waste remediation module was split into two core subsections: hazardous waste secure disposal and municipal wastewater treatment. All hazardous solid waste was transported to certified facilities for stabilized secure landfilling, while factory wastewater was routed to municipal sewage treatment plants equipped with modified Bardenpho biochemical tanks coupled with membrane bioreactor units. Environmental emissions from heavy-duty truck transportation of hazardous waste from the production plant to disposal sites were fully incorporated within the module’s accounting boundary.
RESULTS AND DISCUSSION
Accounting of environmental indicators for SSSBs at the CTG stage
Quantified environmental burden results across the full CTG boundary are segmented into three independent phases: raw material procurement, cell manufacturing, and on-site waste treatment, with detailed carbon footprint and multi-category impact outcomes presented below.
Environmental impacts of the raw material acquisition stage
Carbon footprint quantification for all upstream raw material inputs was conducted in line with the accounting framework illustrated in Section "DATA AND METHODS", with aggregated results visualized in Figure 2.
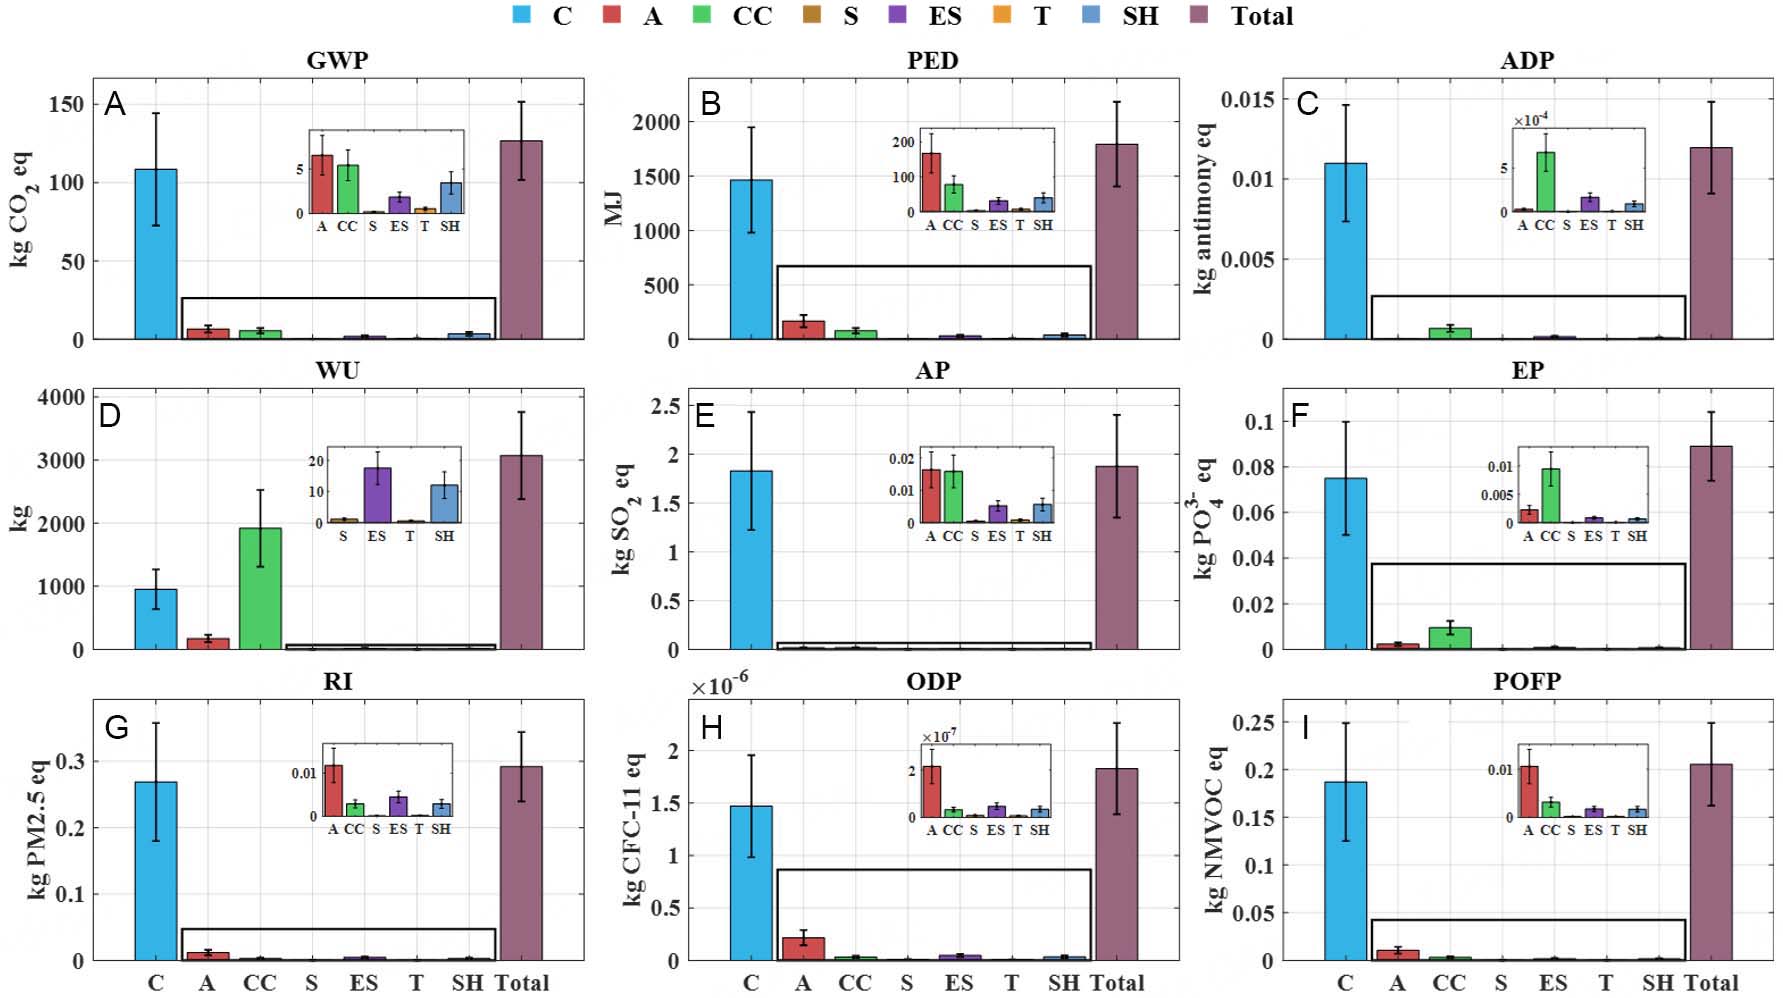
Figure 2. Results of environmental impacts in the raw material acquisition stage of SSSB. (A) Global warming potential (GWP), (B) primary energy demand (PED), (C) abiotic depletion potential (ADP), (D) water use (WU), (E) acidification potential (AP), (F) eutrophication potential (EP), (G) respirable particulate formation potential (RI), (H) ozone depletion potential (ODP), (I) photochemical ozone formation potential (POFP). Each subgraph quantifies the single environmental burden corresponding to cathode (C), anode (A), current collector (CC), separator (S), electrolyte solvent (ES), tab (T), and shell (SH), and visually compares the differentiated contribution of various battery raw material components to multiple environmental damage categories. Abbreviations: cathode (C); anode (A); current collector (CC); separator (S); electrolyte solvent (ES); tab (T); shell (SH). Error bars represent percentage uncertainty intervals of domestic industrial LCI data automatically output by eFootprint software, which originates from multi-weighted evaluation on Chinese battery manufacturers’ environmental impact assessment reports and only accounts for background inventory calculation uncertainty.
From a holistic perspective, the total embodied carbon footprint of all raw materials required to produce
Cathode materials constitute the dominant emission hotspot within the raw material phase, with greenhouse gas loads primarily originating from NCM811 precursor synthesis. NCM811 precursor generates
Auxiliary cathode materials deliver marginal carbon contributions: NMP solvents generate 1.37 kg CO2 eq, while carbon nanotube (CNT) conductive agents contribute 0.85 kg CO2 eq; collectively, these two inputs account for merely 2.1% of total cathode emissions. Minor carbon loads are recorded for cathode binders (0.0188 kg CO2 eq), acetylene black conductive additives (0.0307 kg CO2 eq), and LATP solid cathode electrolyte (0.2631 kg CO2 eq), with negligible corresponding values across all supplementary impact categories.
Anode-related carbon emissions are primarily driven by graphite and CMC binder production. Graphite generates a carbon footprint of 2.53 kg CO2 eq, while CMC contributes 2.16 kg CO2 eq; together these two materials account for more than 70% of the full anode carbon inventory. The graphitization stage of natural/synthetic graphite constitutes the major energy-intensive procedure underlying its elevated embodied carbon, accompanied by a PED of 70.35 MJ and RI of 0.0049 kg PM2.5 eq, consistent with documented graphite manufacturing characteristics. Silicon oxide and anode CNTs generate secondary carbon burdens of 0.48 and 0.85 kg CO2 eq, respectively. By contrast, SBR, anode acetylene black, and aqueous process purified water impose nearly undetectable carbon loads, with water recording negligible GWP. All auxiliary environmental indicators for anode materials mirror the uneven carbon distribution pattern dominated by graphite and CMC.
Copper and aluminum foil manufacturing constitute the core emission sources for current collectors. Electrolytic copper foil carries an embodied carbon footprint of 3.86 kg CO2 eq, approximately 2.5 times the 1.54 kg CO2 eq recorded for aluminum foil, rendering copper foil the primary environmental burden within this component group. This disparity stems from high power demand and pollutant discharge during copper smelting and electrolytic foil fabrication. Copper foil also exhibits extreme water intensity, with total WU reaching 1,917.10 kg, far exceeding all other raw material inputs, a direct consequence of repeated electroplating and high-purity rinsing steps required for domestic electrolytic copper production. Additional metrics including AP, EP, and RI all register higher values for copper foil relative to aluminum foil, maintaining consistent distribution trends with carbon footprint outcomes.
Separators represent one of the lowest-impact components, with a total carbon footprint of only 0.174 kg CO2 eq, paired with minimal PED (2.96 MJ) and RI (0.00013 kg PM2.5 eq) values, owing to low energy consumption during polymer film extrusion; their overall environmental contribution can be largely disregarded in full-system assessments.
Liquid electrolyte generates a carbon burden of 1.84 kg CO2 eq, driven by multi-step synthesis of LiPF6 and mixed carbonate solvents, accompanied by PED of 31.05 MJ, RI of 0.0045 kg PM2.5 eq, and EP of 0.0008 kg PO43--eq, indicating the concurrent risk of particulate and water pollution.
Tab conductive materials record a modest carbon footprint of 0.53 kg CO2 eq, with medium-to-low supplementary indicator values, including PED (6.80 MJ) and AP (0.0008 kg SO2 eq), serving as low-impact auxiliary structural components.
Aluminum plastic packaging film forms the sole constituent of cell shells, generating 3.44 kg CO2 eq from polymer compounding and thermoforming workflows, alongside PED of 39.71 MJ, AP of 0.0056 kg SO2 eq and RI of 0.0029 kg PM2.5 eq, representing a non-negligible secondary emission source.
Overall carbon distribution across raw material inputs demonstrates a severe imbalance. Distinct from lithium metal anode ASSBs, SSSBs adopt NCM811 ternary cathodes that account for 81.1% of total CTG carbon emissions, emerging as the irreplaceable core hotspot for decarbonization, aligning with established LIB LCA conclusions highlighting cathode production as primary climate burden[37]. All supplementary environmental indicators replicate this uneven distribution, with peak values concentrated in NCM811 synthesis while separators and tabs deliver trivial ecological loads. Disaggregated component carbon inventories confirm that high-energy mineral raw materials (NCM, graphite, copper foil) dominate greenhouse gas emissions, whereas thin-film solid electrolytes LATP and LLTO impose minimal environmental pressure due to low mass loading and mild processing energy demand. These findings provide targeted guidance for low-carbon material formulation and upstream supply chain optimization of SSSBs.
A cross-study comparative analysis is conducted to benchmark the carbon footprint magnitude against published domestic LCA literature, as presented in Supplementary Figure 1. Two representative datasets are selected for horizontal comparison: regional NCM liquid LIB CTG averages documented by Kallitsis et al.[38], capturing supply chain and grid-induced regional disparities; and commercial NCM811, NCM111 and LFP cell baseline datasets compiled by Lai et al.[39], representing mainstream industrial liquid battery technical routes.
The aggregate CTG carbon value derived in this study falls within the documented range of domestic NCM ternary LIBs, positioned at the upper bound of established intervals. Numerical discrepancies originate from three distinct drivers: first, this work utilizes the localized CLCD database calibrated to China’s industrial conditions instead of European foreign background inventories; second, semi-solid-state cell designs require elevated raw material mass input per unit kWh relative to mature liquid counterparts, which can be found in the Supplementary Table 23, a byproduct of ongoing industrialization and marginally lower volumetric energy density; third, coating, drying and dry-room energy parameters are calibrated against peer-reviewed solid-state manufacturing benchmarks that diverge from conventional liquid cell production lines. Despite quantitative deviations stemming from database and compositional differences, the universal conclusion that ternary cathode materials constitute the dominant carbon source remains fully consistent across all referenced scholarly work.
Logistics emissions are quantified based on the 200 km medium haul distance and 18-ton diesel heavy-duty truck parameters defined in Section "DATA AND METHODS", with multi-indicator outcomes plotted in Figure 3.
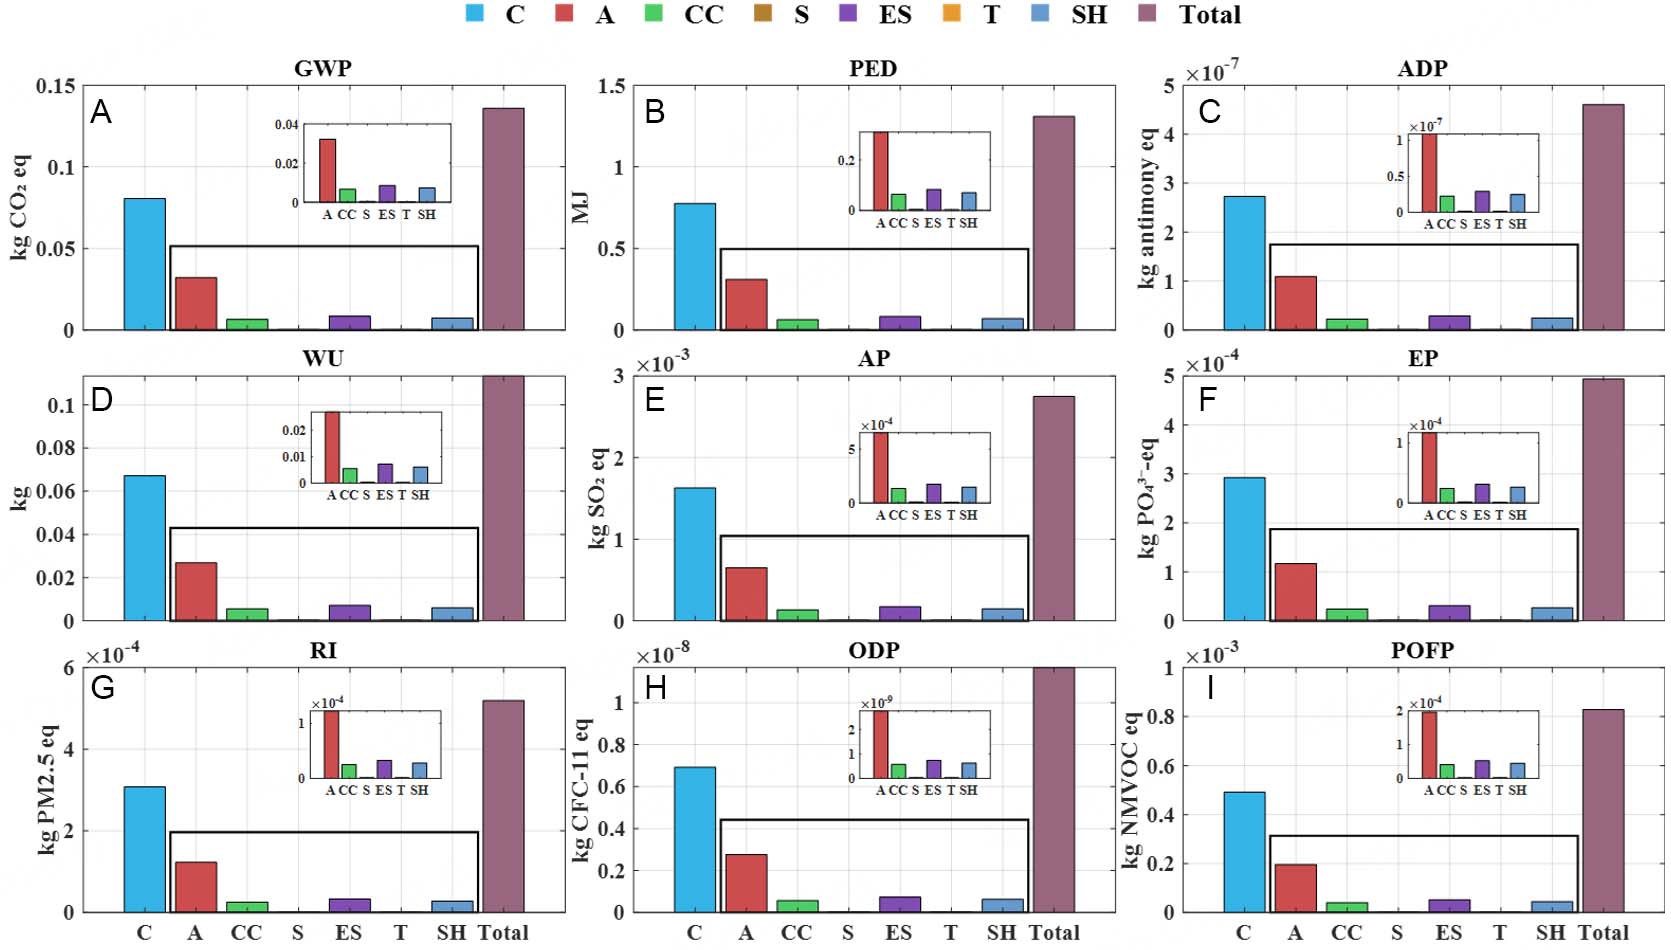
Figure 3. Results of environmental impacts in the raw material transportation stage of SSSB. (A) Global warming potential (GWP), (B) primary energy demand (PED), (C) abiotic depletion potential (ADP), (D) water use (WU), (E) acidification potential (AP), (F) eutrophication potential (EP), (G) respirable particulate formation potential (RI), (H) ozone depletion potential (ODP), (I) photochemical ozone formation potential (POFP).
The aggregate carbon footprint generated by all raw material transportation totals 0.1358 kg CO2 eq, with complete supplementary indicator datasets tabulated in the Supplementary Materials. Logistics burdens also display highly uneven component-wise distribution: cathode material delivery dominates at 59.2% of total transport emissions (of which NCM811 precursor accounts for 32.4% of total transportation emissions), followed by anode raw material logistics at 23.7% (of which graphite precursor accounts for 12.9% of total transportation emissions). Current collectors, electrolytes and cell shells represent secondary contributors with respective shares of 4.9%, 6.3% and 5.4%. Separator and tab transportation each contribute less than 0.3% of logistics carbon loads, rendering their environmental impacts negligible.
This skewed distribution correlates directly with raw material mass density and truck exhaust characteristics: increased cargo weight generates amplified diesel combustion emissions during highway transit. NCM811 cathode precursor shipments constitute the single largest logistics emission subcategory. All eight supplementary environmental indicators replicate this cathode-anode dominated distribution pattern. Nevertheless, the full transportation-stage carbon footprint is only a quarter of the emissions generated during tab raw material synthesis. Economies of scale within bulk logistics operations minimize the relative environmental pressure of transportation, consistent with prior LCA research outcomes.
Environmental impacts of the battery manufacturing stage
Full-process power and thermal energy consumption along with the corresponding multi-category environmental burdens are systematically quantified in accordance with standardized manufacturing workflows and energy benchmarks outlined in Section "DATA AND METHODS". Process energy profiles and associated impact distributions are visualized in Figure 4 and Figure 5 respectively. The complete fabrication workflow encompasses cathode/anode electrode fabrication, cell assembly, formation cycling and auxiliary supporting operations, with two primary energy carriers (grid electricity and natural gas) deployed across all sub-processes exhibiting drastically divergent consumption intensities.
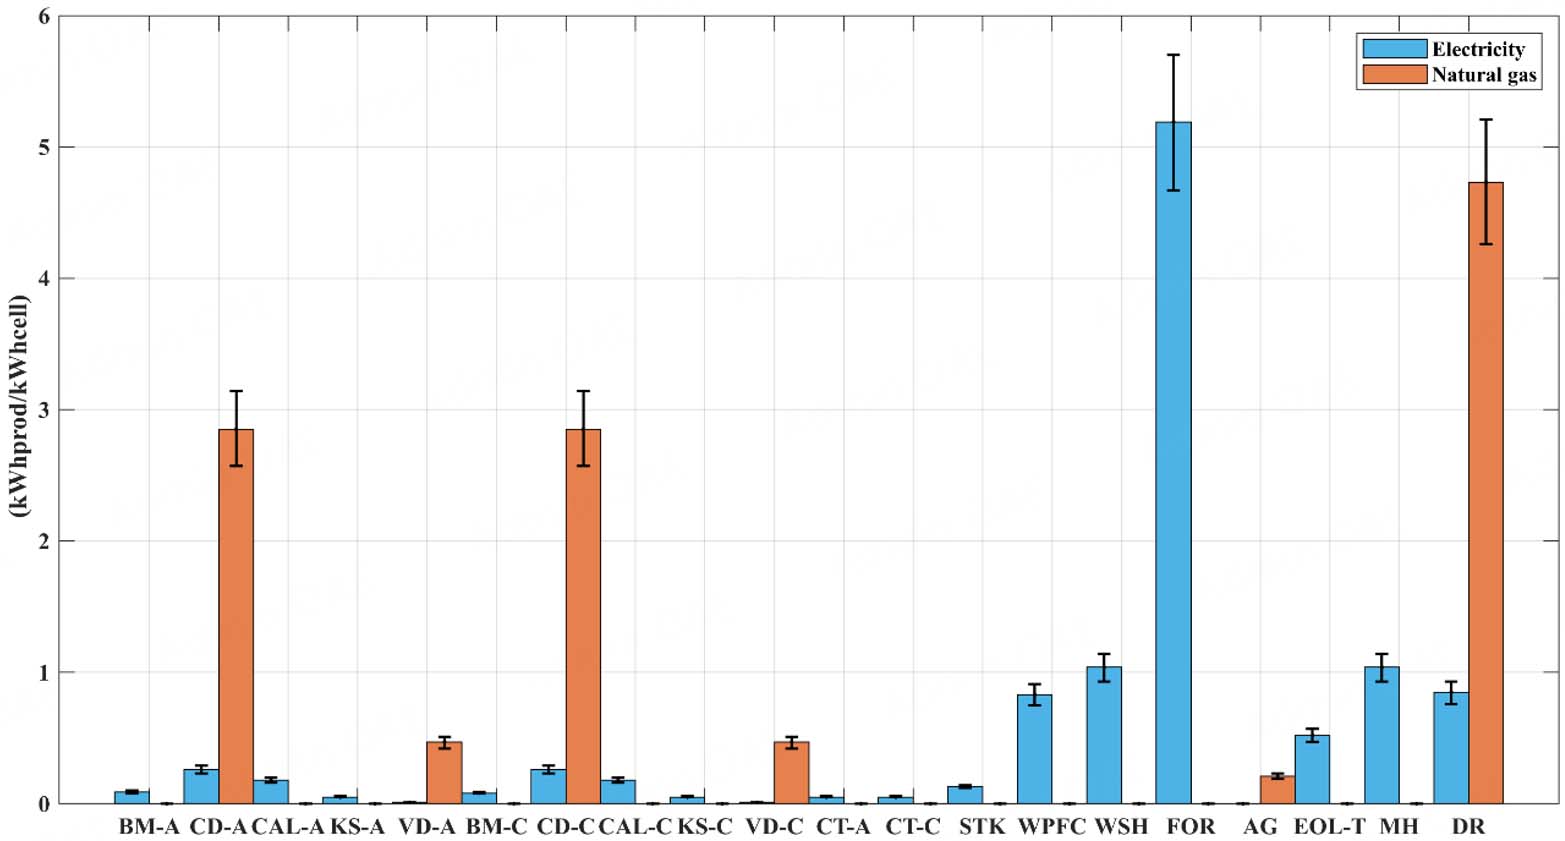
Figure 4. Energy consumption of each process in the manufacturing stage of SSSB. BM-A: Batch mixing, Anode; CD-A: coating & drying, anode; CAL-A: calendering, anode; KS-A: knife slitting, anode; VD-A: vacuum drying, anode; BM-C: batch mixing, cathode; CD-C: coating & drying, cathode; CAL-C: calendering, cathode; KS-C: knife slitting, cathode; VD-C: vacuum drying, cathode; CT-A: cutting, anode; CT-C: cutting, cathode; STK: stacking; WPFC: welding, packaging, filling & closing; WSH: washing; FOR: formation; AG: aging; EOL-T: end-of-line testing; MH: material handling; DR: dry rooms. Figure data and error bars were extracted from[35] and redrawn by the authors; error bars denote energy fluctuation ranges summarized from lithium battery manufacturing expert interviews.
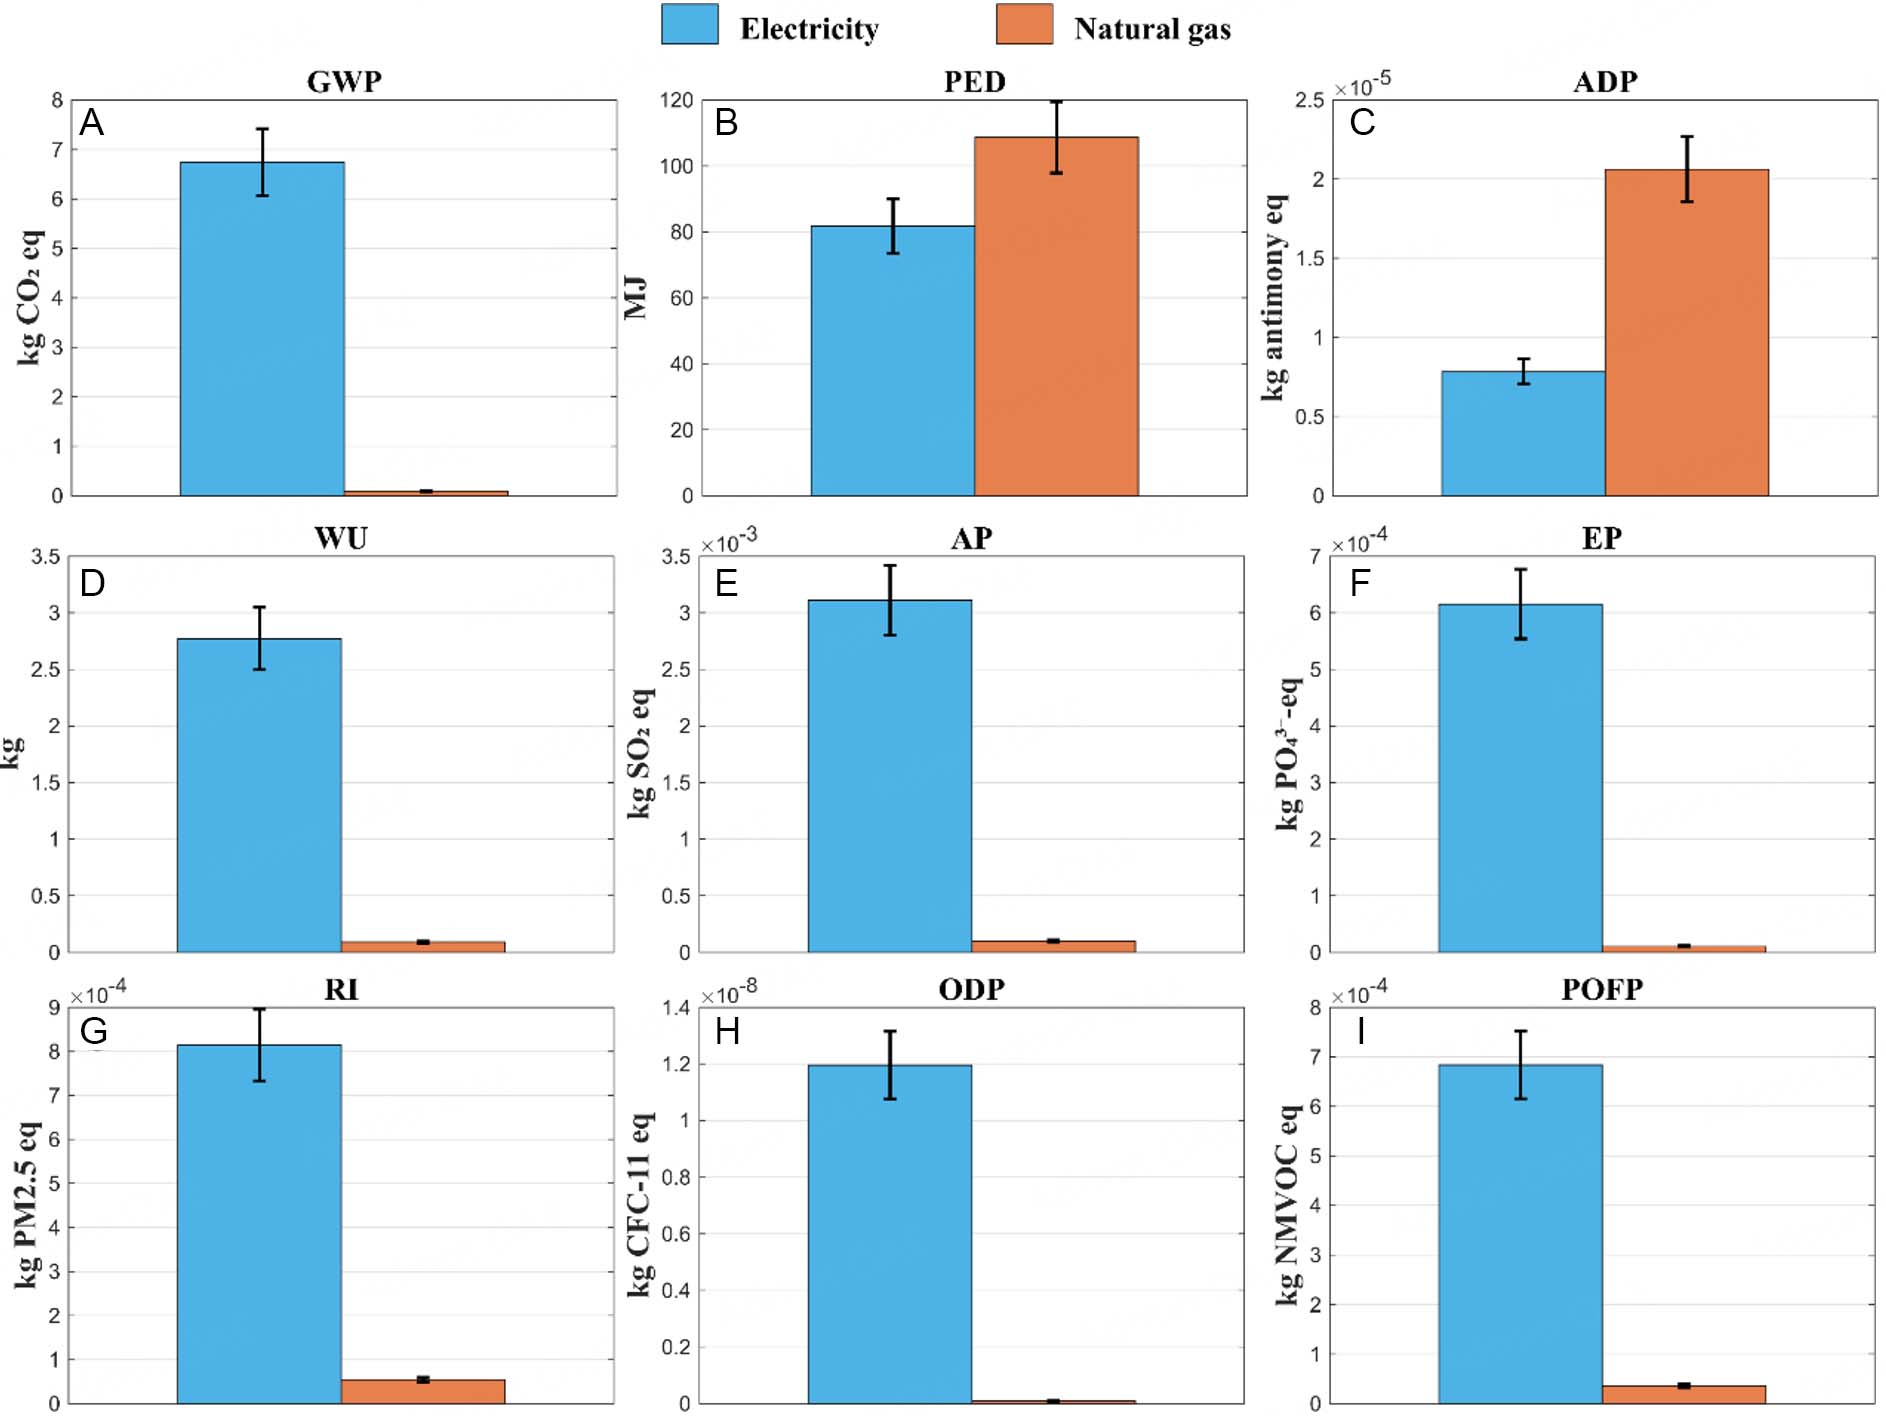
Figure 5. Results of environmental impacts in the manufacturing stage of SSSB. The figure results were calculated from[35]. (A) Global warming potential (GWP), (B) primary energy demand (PED), (C) abiotic depletion potential (ADP), (D) water use (WU), (E) acidification potential (AP), (F) eutrophication potential (EP), (G) respirable particulate formation potential (RI), (H) ozone depletion potential (ODP), (I) photochemical ozone formation potential (POFP). Error bars are fully coupled with energy uncertainty limits in Figure 4, calculated by substituting the upper and lower energy bounds of Figure 4 into the LCIA framework.
From an electricity consumption perspective, electrochemical formation registers the highest unit power demand at 5.19 kWh per kWh finished cell, substantially exceeding all alternative fabrication steps. Washing workflows, material handling, tab welding, packaging, and electrolyte filling also consume substantial volumes of grid electricity. Conversely, batch mixing, knife slitting and calendering procedures record minimal power draw, delivering marginal contributions to total electrical demand.
Natural gas is exclusively deployed for temperature-controlled manufacturing units. Dry rooms constitute the largest natural gas consumer at 4.73 kWh per kWh cell, followed by cathode and anode coating-drying processes each consuming 2.85 kWh thermal energy. Vacuum drying and static aging also require moderate natural gas input, while nearly all remaining sub-processes operate without thermal gas demand. Overall energy allocation aligns precisely with process functional requirements, establishing a consumption pattern where electricity serves as the universal primary energy source and natural gas is restricted to heating and humidity-control workflows.
Manufacturing-stage environmental burdens are co-driven by electricity and natural gas combustion, with divergent contribution ratios across impact categories. Focusing on GWP as the core climate metric, electricity consumption generates 6.7394 kg CO2 eq while natural gas contributes merely 0.09264 kg CO2 eq; grid power therefore accounts for over 98% of total fabrication greenhouse gas emissions and functions as the definitive dominant emission driver. Uncertainty bounds for electricity-derived carbon footprints span 6.0698-7.4152 kg CO2 eq, with natural gas ranges limited to 0.08344-0.10192 kg CO2 eq; full-process uncertainty remains constrained within reasonable limits without altering electricity’s dominant emission role.
For resource-oriented indicators PED and ADP, contrasting trends emerge: natural gas combustion delivers a PED of 108.6204 MJ, exceeding the 81.74 MJ associated with grid electricity, while natural gas ADP (0.00002 kg antimony eq) also surpasses electricity’s 0.000008 kg antimony eq, attributed to fossil resource extraction burdens embedded within natural gas supply chains.
For all residual impact metrics including WU, AP, EP, RI, ODP and POFP, electricity consumption dominates total loads. Grid-powered workflows generate water use of 2.77185 kg, vastly outstripping natural gas’s 0.090324 kg water demand. Additional electricity-derived values include AP (0.003 kg SO2 eq), EP (0.0006 kg PO43--eq), RI (0.0008 kg PM2.5 eq) and POFP (0.0007 kg NMVOC eq), all substantially elevated relative to natural gas equivalents. ODP emissions are almost exclusively linked to grid electricity generation, with natural gas contributions negligible.
Electricity’s overwhelming dominance across most environmental indicators delineates clear low-carbon optimization pathways for cell fabrication. Efficiency upgrades for high-power units including formation and washing, paired with grid decarbonization via renewable electricity procurement, can drastically mitigate manufacturing-stage ecological footprints. Meanwhile, natural gas’s disproportionate PED and ADP contributions indicate that thermal process electrification via heat pump substitution merits integration into future low-carbon manufacturing design frameworks.
Environmental impacts of the waste disposal stage
Environmental burdens originating from on-site waste treatment post-fabrication are quantified following the accounting protocols defined in Section "DATA AND METHODS", with segmented loads split across three sub-units: municipal wastewater treatment, secure hazardous waste landfilling, and hazardous waste highway transportation; differentiated category contributions are displayed in Figure 6.
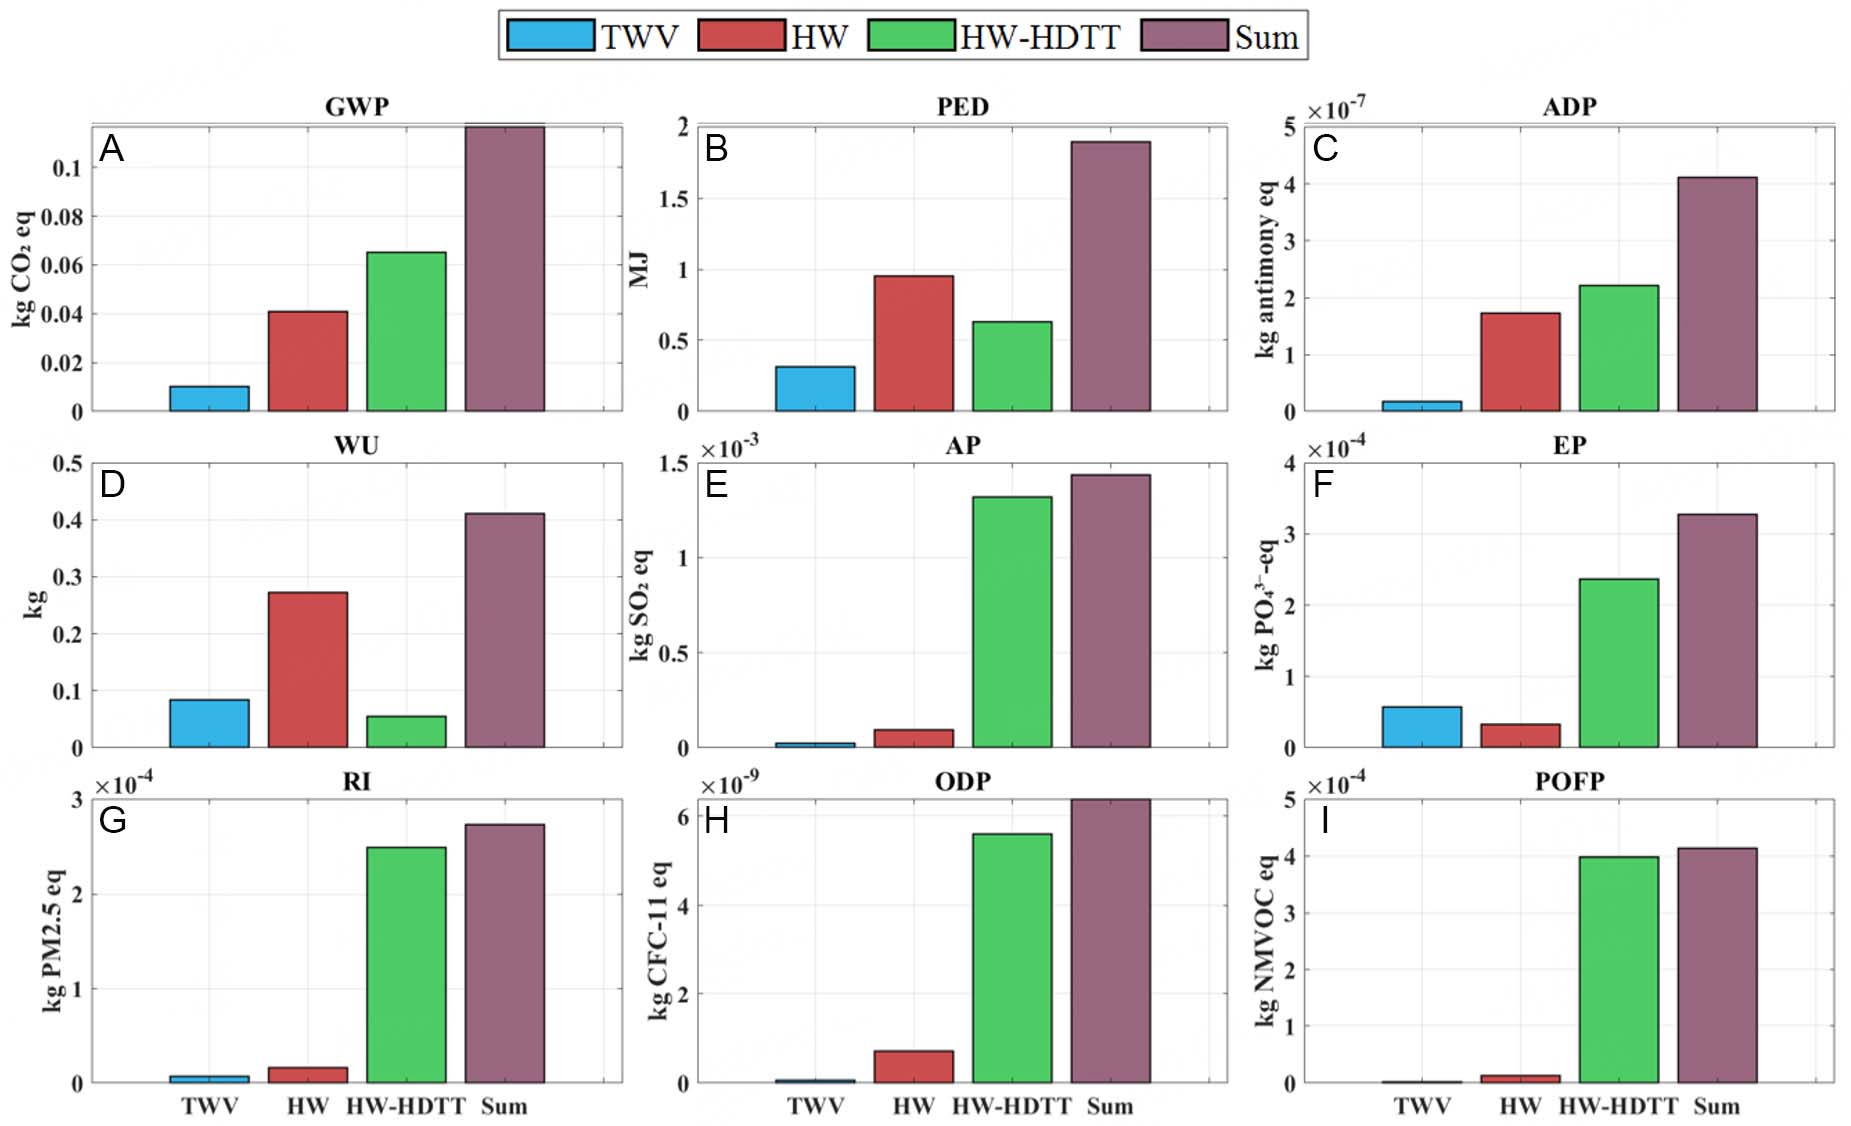
Figure 6. Results of environmental impacts in the waste disposal stage of SSSB. (A) Global warming potential (GWP), (B) primary energy demand (PED), (C) abiotic depletion potential (ADP), (D) water use (WU), (E) acidification potential (AP), (F) eutrophication potential (EP), (G) respirable particulate formation potential (RI), (H) ozone depletion potential (ODP), (I) photochemical ozone formation potential (POFP). TWV: Total wastewater volume; HW: hazardous Waste; HW-HDTT: Hazardous waste - heavy-duty diesel truck transportation.
The carbon footprint distribution across waste remediation workflows exhibits an extreme imbalance. Wastewater treatment generates 0.01015 kg CO2 eq, hazardous waste disposal produces
Divergent dominant contributors emerge across supplementary environmental indicators. Hazardous waste landfilling dominates PED (0.9512 MJ) and WU (0.2720 kg), driven by energy and clean water consumption during stabilization pretreatment. Hazardous diesel truck transportation dominates all remaining atmospheric impact categories, including ADP (0.0000002 kg antimony eq), AP (0.00132 kg SO2 eq), EP (0.000237 kg PO43--eq), RI (0.000249 kg PM2.5 eq), ODP (0.000000006 kg CFC-11 eq) and POFP (0.000398 kg NMVOC eq), directly stemming from sulfur oxide, nitrogen oxide, particulate and volatile organic compound exhaust streams. Wastewater treatment maintains minimal values across all impact categories, exerting trivial overall environmental pressure.
Collectively, waste-stage environmental burdens demonstrate multi-source differentiation characteristics. Diesel-powered hazardous waste transit acts as the primary source of carbon emissions and most air pollutants, while hazardous waste landfilling dominates energy and water consumption metrics. Wastewater treatment delivers negligible ecological loads. These segmented distribution patterns establish targeted mitigation routes for factory waste management: optimizing hazardous waste logistics modes and improving transit efficiency delivers the most substantial reductions to aggregate waste-phase environmental footprints.
Sensitivity analysis
Carbon footprint sensitivity evaluation is implemented to quantitatively identify dominant driving factors and establish a ranked hierarchy of decarbonization priorities across the full CTG lifecycle. The sensitivity coefficient is defined as the percentage shift in total stage carbon footprint triggered by ±20% parametric fluctuation of individual sub-process or raw material inputs; elevated coefficient magnitudes signify more pronounced carbon footprint responsiveness to parameter variation. Assessment covers raw material procurement, cell manufacturing, and waste remediation phases separately, with fabrication-stage sensitivity further split into three distinct energy fluctuation scenarios: synchronous electricity-natural gas variation, independent electricity fluctuation, and independent natural gas fluctuation, enabling decoupled quantification of grid and thermal energy’s differentiated carbon impacts. Full sensitivity coefficient outcomes are visualized in Figure 7.
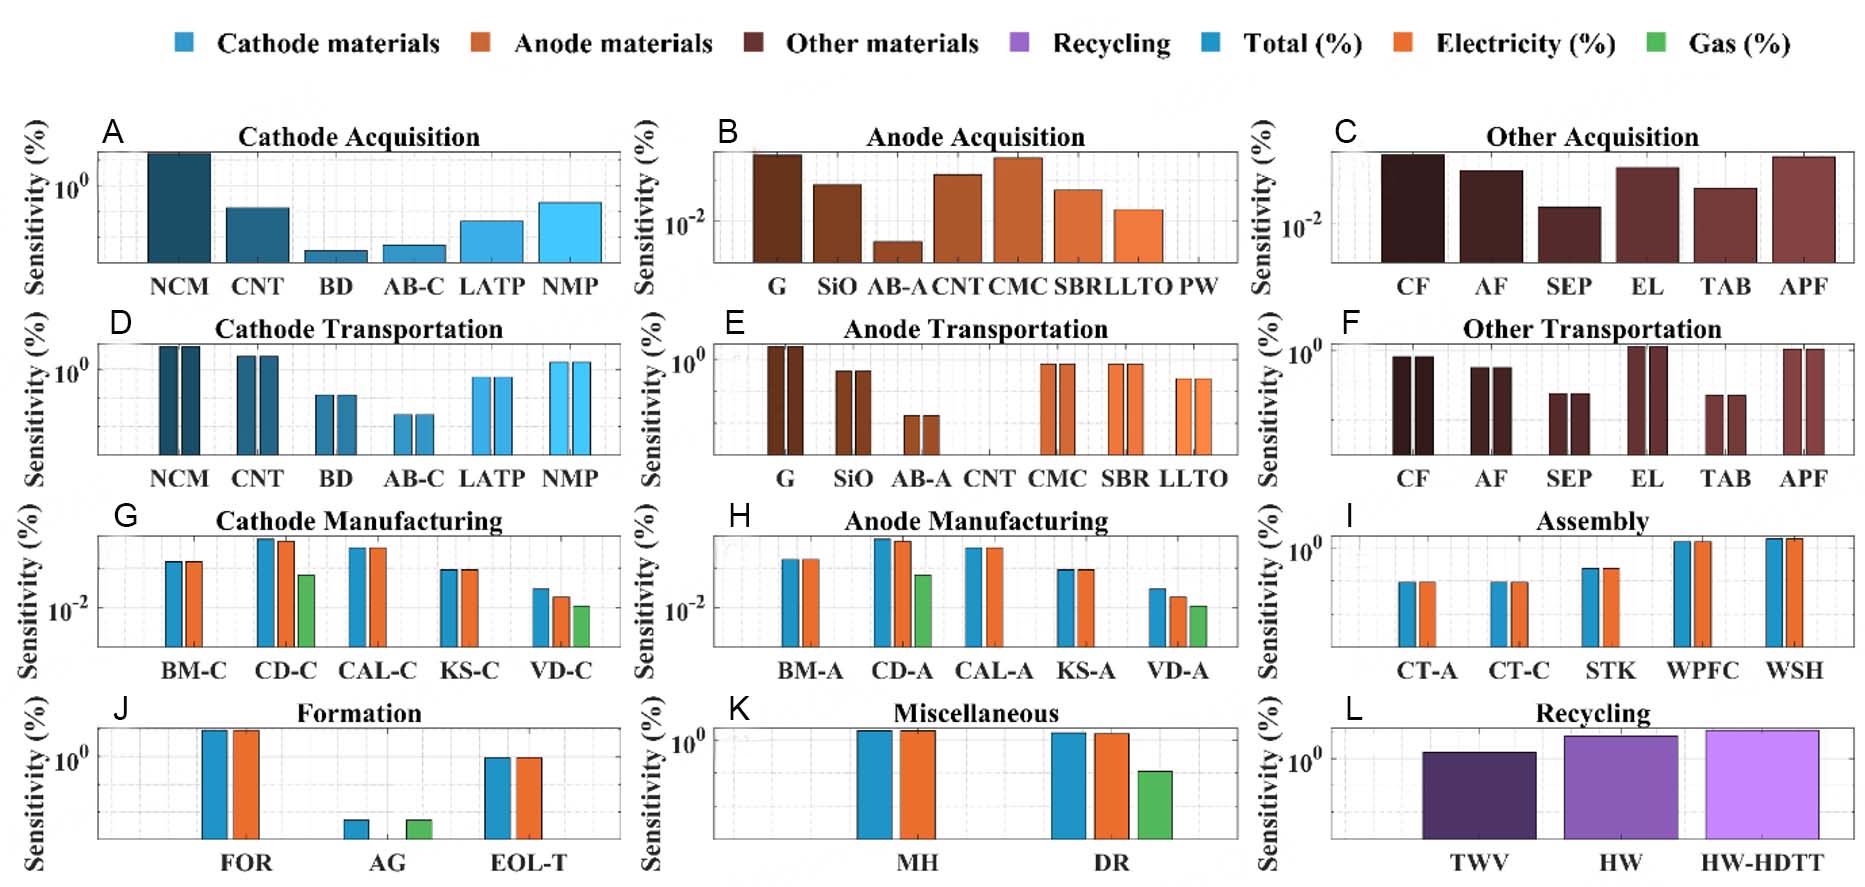
Figure 7. Sensitivity analysis results for the CTG carbon footprint of SSSB. (A) Cathode acquisition, (B) anode acquisition, (C) other acquisition, (D) cathode transportation, (E) anode transportation, (F) other transportation, (G) cathode manufacturing, (H) anode manufacturing, (I) assembly, (J) formation, (K) miscellaneous, (L) recycling.
Sensitivity analysis of the raw material acquisition stage
Raw material procurement is segmented into upstream raw material synthesis and cross-regional logistics subsections, with carbon footprint adopted as the core evaluation metric. Sensitivity outcomes replicate the uneven emission distribution documented in Section "Environmental impacts of the raw material acquisition stage", with cathode raw materials delivering dominant coefficients and anode/auxiliary inputs registering secondary influence (refer to Supplementary Figures 2-4).
Within raw material synthesis workflows, NCM811 cathode precursor exhibits the maximum sensitivity coefficient of 16.73%, vastly exceeding all alternative inputs and representing the highest-priority decarbonization target across upstream supply chains. Auxiliary cathode materials including single-walled CNTs, polymeric binders and cathode acetylene black all record sensitivity coefficients below 0.14%, exerting negligible influence on aggregate carbon inventories.
For anode raw materials, graphite (0.40%) and CMC binder (0.34%) constitute secondary sensitive parameters, while silicon oxide, conductive agents and residual anode inputs register coefficients below 0.1%. Among miscellaneous raw materials, electrolytic copper foil (0.61%) and aluminum plastic shell film (0.54%) display relatively elevated sensitivity magnitudes, whereas separators, electrolyte salts and tab materials all deliver coefficients lower than 0.30%.
Within raw material logistics sensitivity evaluation, cathode precursor transit remains the dominant contributor, with NCM811 transportation recording a coefficient of 6.48%, followed by cathode CNT logistics (2.89%) and NMP solvent delivery (1.80%). Graphite anode transportation represents the primary sensitive anode logistics parameter at 2.59%, with all remaining anode material transit coefficients falling below 1.00%. Shell film logistics (1.07%) and electrolyte transportation (1.26%) register mild secondary sensitivity, while separator and tab delivery coefficients drop below 0.10, carrying minimal analytical significance [Supplementary Figures 5-7].
Sensitivity analysis of the battery manufacturing stage
Cell fabrication encompasses cathode/anode electrode production, cell assembly, formation cycling and miscellaneous auxiliary workflows, with grid electricity functioning as the primary energy carrier and natural gas as secondary thermal input. Sensitivity outcomes confirm that electricity parameter fluctuation drives nearly all carbon footprint variance, while natural gas consumption delivers marginal influence, with core sensitive sub-processes concentrated within high-power fabrication units [Supplementary Figures 8-12].
Identical sensitivity magnitudes are recorded for cathode and anode electrode workflows. Coating and drying units deliver the highest aggregate sensitivity of 0.54%, decomposed into an electricity-derived component of 0.47% and a natural gas contribution of 0.07%. Calendering processes register a sensitivity coefficient of 0.33%, while batch mixing records 0.16%; both operations rely exclusively on grid electricity. Slitting and vacuum drying deliver coefficients below 0.03%, with vacuum drying’s natural gas-associated sensitivity limited to merely 0.01%, functionally negligible.
Within cell assembly workflows, washing operations exhibit an aggregate sensitivity coefficient of 1.887611%, with welding, packaging and electrolyte filling-sealing recording 1.51%; both units operate solely via grid power. Electrode cutting and stacking register coefficients below 0.10%, exerting trivial influence on total fabrication carbon footprints.
For formation and aging sub-processes, electrochemical formation delivers the single highest sensitivity coefficient across all manufacturing workflows at 9.42%, driven entirely by grid electricity draw. End-of-line performance testing records a sensitivity of 0.942% (pure electricity consumption), while static aging’s coefficient stands at only 0.004%, originating from minor natural gas heating demand with negligible systemic impact.
For miscellaneous auxiliary units, material handling registers a sensitivity of 1.89% (100% electricity-dependent), while dry rooms record 1.65%, split into 1.54% electricity and 0.11% natural gas contributions; natural gas accounts for merely 6.70% of dry room total sensitivity, reaffirming electricity’s dominant role.
Collectively, over 98.00% of fabrication-stage carbon footprint sensitivity originates from grid electricity variation, with natural gas demand fluctuations generating minimal systemic shifts. Electrochemical formation, industrial washing, material handling, and humidity-controlled dry rooms constitute the four core electricity-intensive sensitive workflows, validating the prior conclusion that grid power consumption acts as the definitive manufacturing emission hotspot.
Sensitivity analysis of the waste disposal stage
Waste remediation carbon footprint sensitivity displays clear hierarchical differentiation: hazardous waste highway transportation ranks first, secure hazardous waste landfilling second, and municipal wastewater treatment delivers the weakest parametric response [Supplementary Figure 13]. Heavy-duty diesel truck transit of hazardous waste records a sensitivity coefficient of 11.20%, representing the most impactful single parameter within the waste phase. Hazardous waste secure disposal follows at 7.05%, while full wastewater treatment workflows register the minimum coefficient of 1.74%. Sensitivity distribution across all supplementary environmental indicators mirrors the carbon footprint ranking hierarchy, confirming diesel hazardous waste transit as the primary driver for waste-stage greenhouse gas emissions.
Comprehensive conclusions of sensitivity analysis
Integrating sensitivity outcomes across all three CTG phases, the four highest-priority decarbonization parameters ranked by sensitivity coefficient magnitude are listed sequentially: NCM811 raw material synthesis (16.73%), heavy-duty diesel hazardous waste transportation (11.20%), electricity consumption during cell formation (9.42%), and NCM811 raw material logistics (6.48%). All residual raw material, manufacturing and thermal gas parameters record sensitivity coefficients below 2%, delivering marginal systemic carbon impacts.
These high-sensitivity hotspots demonstrate perfect alignment with the segmented carbon footprint accounting results outlined in Section "Accounting of environmental indicators for SSSBs at the CTG stage", verifying the robustness and internal consistency of the full LCA modeling framework. The ranked sensitivity hierarchy delivers unambiguous actionable guidance for industrial low-carbon retrofits: prioritizing decarbonization of NCM811 upstream manufacturing, efficiency upgrades for high-power formation equipment, and low-emission hazardous waste logistics delivers the maximum quantifiable greenhouse gas mitigation gains for SSSB production systems.
CONCLUSION
This research performs a comprehensive CTG LCA of SSSBs based on the CLCD and the eFootprint modeling platform. Taking 1 kWh nominal cell capacity as the functional unit, nine core environmental impact categories including GWP are quantified across three interconnected stages: raw material procurement, full cell manufacturing, and on-site waste remediation. Complementary sensitivity assessments are further implemented to disentangle key emission hotspots and prioritize low-carbon transformation pathways. The primary research outcomes are summarized as follows.
The aggregate CTG carbon footprint of industrial SSSBs reaches 133.64 kg CO2 eq, with environmental burdens distributed extremely unevenly across the whole supply chain. and ranking as the top priority for upstream decarbonization initiatives. Within raw material production workflows, NCM811 dominates overall ecological loads, while graphite and electrolytic copper foil represent secondary contributors. By contrast, solid electrolyte materials LATP and LLTO generate negligible environmental pressures. Targeted technical routes can be developed to cut carbon emissions in core high-impact segments: optimized precursor synthesis and low-temperature calcination for ternary precursors, alongside advanced graphitization techniques for anode graphite, are projected to deliver a baseline greenhouse gas abatement of 45%-54%; the integration of water-based cathode coating and low-temperature synthesis can push the maximum mitigation potential up to 71%[40]. Additional decarbonization gains can be unlocked via high-nickel low-cobalt or cobalt-free cathode substitutes, which eliminate carbon-intensive cobalt mining and high-temperature precursor calcination procedures. Further optimization of LATP and LLTO synthesis workflows is also viable to lower energy consumption and associated ecological burdens during solid electrolyte fabrication. Subsequent research may extend the boundary of supply chain modeling to incorporate energy mix forecasting and carbon footprint evaluation for lithium battery mineral extraction and exporting regions worldwide.
The aggregate carbon footprint associated with cross-regional raw material logistics totals merely
Grid electricity constitutes the dominant energy input throughout all cell fabrication workflows, responsible for over 98% of manufacturing-stage carbon emissions. Electrochemical formation, on-site washing stations, material handling systems, and humidity-controlled dry rooms are identified as the four most energy-intensive manufacturing modules. Natural gas is exclusively adopted for temperature and humidity regulation processes; despite its trivial contribution to climate emissions, it generates elevated PED and ADP. Future low-carbon manufacturing strategies can deploy high-efficiency intelligent control hardware for power-hungry processes, including formation cycling and dry room operation, to reduce unit power consumption. Procurement of wind and photovoltaic renewable power can substantially lower grid carbon intensity and cut fabrication greenhouse gas outputs. In addition, electric heat pumps can substitute gas-fired heating units for thermal control workflows to curb fossil resource depletion.
Within the on-site waste treatment stage, hazardous waste highway transportation serves as the primary carbon emission hotspot, contributing 56.0% of total waste-phase GWP. Secure landfilling of hazardous waste ranks as the secondary emission source, while municipal wastewater treatment generates minimal climate impacts. Heavy-duty diesel truck transit of hazardous waste is confirmed as the core driver of waste-stage carbon burdens, highlighting logistics optimization as the key waste mitigation measure.
Hierarchical ranking of critical sensitive factors derived from full-process sensitivity analysis is arranged in descending order of impact magnitude: NCM811 raw material synthesis (16.73%), heavy-duty diesel transportation of hazardous waste (11.20%), electricity consumption during cell formation (9.42%), and NCM811 raw material logistics (6.48%). More than 98% of total carbon footprint sensitivity within the manufacturing phase originates from electricity demand fluctuations, whereas variations in natural gas consumption, auxiliary raw material dosage, and minor sub-processes exert negligible influences on overall environmental outcomes.
This work fills the research gap of industrially calibrated localized life cycle inventories for China’s domestic SSSB sector. It quantitatively verifies the decisive roles of upstream cathode raw material production, factory power utilization, and hazardous waste logistics in shaping full-chain carbon footprints, furnishing quantitative data support for low-carbon process retrofits, industrial policy design, and regional clean energy transition.
Limitations and future research directions
Several limitations remain inherent within the present study, which lay groundwork for follow-up investigation. Partial background inventory datasets for lithium battery raw materials are incomplete, and several upstream material characterization factors are sourced from European databases rather than China’s localized industrial inventory system. Subsequent research will focus on supplementing and refining domestic upstream raw-material life-cycle inventories to establish a more robust, China-adapted LCA accounting framework.
For extended research scope, future work will expand the assessment boundary from CTG to cradle-to-grave, incorporating cell service cycles, retired battery dismantling and multi-pathway secondary material recovery. Comparative environmental impact evaluations will also be conducted across SSSBs, conventional liquid LIBs and ASSBs, to deliver comprehensive technical route decision-making references for industrial and policy practitioners.
DECLARATIONS
Authors' contributions
Methodology, data curation, software, writing - original draft: Zhang, W.
Methodology, writing - review & editing: Chen, Q.
Conceptualization, methodology, software, writing - review & editing: Chen, J.
Conceptualization, methodology, writing - review & editing: Lai, X.
Software: Zhi, M.
Investigation: Liu, X.
Data curation: Huang, W.
Methodology: Zheng, Y.
Availability of data and materials
The LCI for the SSSB raw material used in this article can be found in the Supplementary Materials.
AI and AI-assisted tools statement
During the preparation of this manuscript, the AI tool Doubao (Seed 2.0, released 2026-02-14) was used solely for language editing. The tool did not influence the study design, data collection, analysis, interpretation, or the scientific content of the work. All authors take full responsibility for the accuracy, integrity, and final content of the manuscript.
Financial support and sponsorship
This research is supported by the National Natural Science Foundation of China (NSFC) under Grant numbers 52277223 and 52577238 and the Shanghai Pujiang Programme (23PJD062).
Conflicts of interest
All authors declared that there are no conflicts of interest.
Ethical approval and consent to participate
Not applicable.
Consent for publication
Not applicable.
Copyright
© The Author(s) 2026.
Supplementary Materials
REFERENCES
1. World Economic Forum. A vision for a sustainable battery value chain in 2030. Unlocking the full potential to power sustainable development and climate change mitigation Geneva. 2019. Available from: https://cn.weforum.org/ [Last accessed on 20 Jul 2026].
2. Arshad, F.; Lin, J.; Manurkar, N.; et al. Life cycle assessment of lithium-ion batteries: a critical review. Resour. Conserv. Recycl. 2022, 180, 106164.
3. Šimaitis, J.; Lupton, R.; Vagg, C.; Butnar, I.; Sacchi, R.; Allen, S. Battery electric vehicles show the lowest carbon footprints among passenger cars across 1.5-3.0 °C energy decarbonisation pathways. Commun. Earth. Environ. 2025, 6, 476.
4. Mandade, P.; Weil, M.; Baumann, M.; Wei, Z. Environmental life cycle assessment of emerging solid-state batteries: a review. Chem. Eng. J. Adv. 2023, 13, 100439.
5. Seshadri, N.; Cross, D.; Fotouhi, A. Experimental evaluation of thermal barrier materials used in battery electric vehicles. Automot. Innov. 2026, 9, 401-20.
6. Lian, Y.; Ling, H.; Song, G.; Wang, H.; He, B.; Ouyang, M. Investigation on high-temperature-uniformity direct cooling performance of battery pack with large-format blade battery. Automot. Innov. 2025, 8, 769-85.
7. Yang, H.; Wang, Z.; Zhang, Z.; et al. Performance comparison of semi-solid-state batteries with liquid electrolyte batteries: a perspective from vehicle operation. Appl. Energy. 2025, 402, 126899.
8. Xu, C.; Zhang, F.; Chen, J.; et al. Safety assessment of LiNi0.9Mn0.05Co0.05O2 and high-voltage LiNi0.6Mn0.2Co0.2O2 cathode lithium-ion batteries with similar energy density. Automot. Innov. 2026, 422.
9. EVTank. White paper on the development of China's solid-state battery industry (2025) Beijing. 2025 Available from: http://www.evtank.cn/ [Last accessed on 20 Jul 2026].
10. China MoIaITotPsRo. Solid-state battery for electric vehicle—Part 1: terms and classification: standardization administration of the people's republic of China. 2026. Available from: https://wap.miit.gov.cn/ [Last accessed on 20 Jul 2026].
11. Zhan, W.; Liu, Z.; Yu, Y.; et al. Life cycle carbon footprint of battery electric bus: coupling effects of mileage, energy mix and recycling processes. Carbon. Footprints. 2025, 4, 19.
12. Chen, Q.; Lai, X.; Zhang, Y.; et al. Environmental impacts and supply risks for LiFePO4 - LiCoxNiyMn1-x-yO2 hybrid battery pack in China. Process. Saf. Environ. Prot. 2025, 198, 107115.
13. Wang, L.; Zhang, Z.; Xu, F.; et al. 3D-printed honeycomb lithium-silicon alloy anodes for stabilized interface in sulfide all-solid-state batteries. eTransportation 2025, 26, 100476.
14. Pei, L.; Han, Y.; Dong, J.; et al. High-performance solid-state sodium-ion batteries for lightweight electric vehicles: a closed-loop feedback-optimized composite electrolyte design. eTransportation 2025, 25, 100439.
15. Wu, Y.; Zhang, Z.; Zhang, Q.; et al. Industrialization challenges for sulfide-based all solid state battery. eTransportation 2024, 22, 100371.
16. Li, G.; Fan, G.; Zhang, X.; et al. Modeling of an all-solid-state battery with a composite positive electrode. eTransportation 2024, 20, 100315.
17. Zhang, N.; Zhao, X.; Liu, G.; et al. Solid electrolyte membranes for all-solid-state rechargeable batteries. eTransportation 2024, 20, 100319.
18. Gries, A.; Zindel, A.; Langer, F.; et al. Evaluation of various solvents for the wet-chemical synthesis of β-Li3PS4 under energy and environmental aspects. ACS. Appl. Energy. Mater. 2024, 7, 5138-48.
19. Xu, J.; Feng, T.; Guo, W.; et al. Comparative LCA of energy and environmental impacts in sulfide-based all-solid-state battery manufacturing: wet vs. dry processes. J. Energy. Storage. 2026, 150, 120406.
20. Barke, A.; Cistjakov, W.; Steckermeier, D.; et al. Green batteries for clean skies: sustainability assessment of lithium-sulfur all-solid-state batteries for electric aircraft. J. Ind. Ecol. 2022, 27, 795-810.
21. Popien, J.; Thies, C.; Barke, A.; Spengler, T. S. Comparative sustainability assessment of lithium-ion, lithium-sulfur, and all-solid-state traction batteries. Int. J. Life. Cycle. Assess. 2023, 28, 462-77.
22. Wang, Z.; Tian, X.; Zhao, S.; Zhang, P.; An, C. Toward a sustainable future: a holistic environmental, social, and economic assessment of industrial recycling for all-solid-state batteries with oxide-based electrolytes. Environ. Sci. Technol. 2025, 59, 21957-66.
23. Troy, S.; Schreiber, A.; Reppert, T.; et al. Life cycle assessment and resource analysis of all-solid-state batteries. Appl. Energy. 2016, 169, 757-67.
24. Zhang, S.; Brandell, D.; Valvo, M.; Steubing, B.; Nordberg, Å. Future climate impact of all-solid-state batteries. J. Clean. Prod. 2025, 525, 146607.
25. Zhang, J.; Ke, X.; Gu, Y.; et al. Cradle-to-gate life cycle assessment of all-solid-state lithium-ion batteries for sustainable design and manufacturing. Int. J. Life. Cycle. Assess. 2022, 27, 227-37.
26. Qian, G.; Zhu, Z.; Guo, P.; et al. Non-destructive and adaptive negative electrode impedance estimation of lithium-ion batteries using ensemble learning. Appl. Energy. 2026, 402, 127017.
27. Moon, Y.; Kim, H.; Nguyen, M. H.; Song, C. K.; Song, W. J.; Park, S. Harnessing native Li2CO3 layers on Li7La3Zr2O12 (LLZO) for high-performance tri-layer composite electrolytes in semi-solid-state batteries. Small 2025, 21, e09544.
28. Wang, W. W.; Zhi, S. T.; Xu, X. T.; Liu, X. Y.; Zhen, H. S. Building a novel electromechanical-thermal model for semi-solid-state batteries. Energies 2025, 18, 844.
29. Li, H.; Zhao, H.; Liu, D.; Li, Z.; Hu, Q. Electro-thermal coupling modeling and heat generation decoupling analysis of semi-solid-state lithium-ion battery. Electrochim. Acta. 2025, 512, 145455.
30. Dilger, N.; Kaluza, A.; Kiesewetter, A.; et al. Definition and reference framework for life cycle technologies in life cycle engineering - a case study on all solid state traction batteries. Proc. CIRP. 2021, 98, 217-22.
31. Falcone, M.; Quattromini, N. F.; Rossi, C.; Pulvirenti, B. Life cycle assessment of a lithium-ion battery pack unit made of cylindrical cells. Batteries 2022, 8, 76.
32. Longo, S.; Antonucci, V.; Cellura, M.; Ferraro, M. Life cycle assessment of storage systems: the case study of a sodium/nickel chloride battery. J. Clean. Prod. 2014, 85, 337-46.
33. Verma, S.; Dwivedi, G.; Verma, P. Life cycle assessment of electric vehicles in comparison to combustion engine vehicles: a review. Mater. Today. Proc. 2022, 49, 217-22.
34. Dai, Q.; Kelly, J. C.; Gaines, L.; Wang, M. Life cycle analysis of lithium-ion batteries for automotive applications. Batteries 2019, 5, 48.
35. Degen, F.; Winter, M.; Bendig, D.; Tübke, J. Energy consumption of current and future production of lithium-ion and post lithium-ion battery cells. Nat. Energy. 2023, 8, 1284-95.
36. Lai, X.; Chen, J.; Chen, Q.; et al. Comprehensive assessment of carbon emissions and environmental impacts of sodium-ion batteries and lithium-ion batteries at the manufacturing stage. J. Clean. Prod. 2023, 423, 138674.
37. Dou, H.; Hao, H. The greenhouse gas emissions reduction co-benefit of end-of-life electric vehicle battery treatment strategies. Carbon. Footprints. 2023, 2, 2.
38. Kallitsis, E.; Korre, A.; Kelsall, G. H. Life cycle assessment of recycling options for automotive Li-ion battery packs. J. Clean. Prod. 2022, 371, 133636.
39. Lai, X.; Gu, H.; Chen, Q.; et al. Investigating greenhouse gas emissions and environmental impacts from the production of lithium-ion batteries in China. J. Clean. Prod. 2022, 372, 133756.
40. Degen, F.; Mitterfellner, M.; Kampker, A. Comparative life cycle assessment of lithium-ion, sodium-ion, and solid-state battery cells for electric vehicles. J. Ind. Ecol. 2024, 29, 113-28.
Cite This Article
 Open Access
How to Cite
Download Citation
Export Citation File:
Type of Import
Tips on Downloading Citation
Citation Manager File Format
Type of Import
Direct Import: When the Direct Import option is selected (the default state), a dialogue box will give you the option to Save or Open the downloaded citation data. Choosing Open will either launch your citation manager or give you a choice of applications with which to use the metadata. The Save option saves the file locally for later use.
Indirect Import: When the Indirect Import option is selected, the metadata is displayed and may be copied and pasted as needed.
About This Article
Copyright

Data & Comments
Data
0








Comments
Comments must be written in English. Spam, offensive content, impersonation, and private information will not be permitted. If any comment is reported and identified as inappropriate content by OAE staff, the comment will be removed without notice. If you have any queries or need any help, please contact us at support@oaepublish.com.