



Figure4
From: A method for quantifying the upfront carbon footprint of urban densification in Texas through 2050
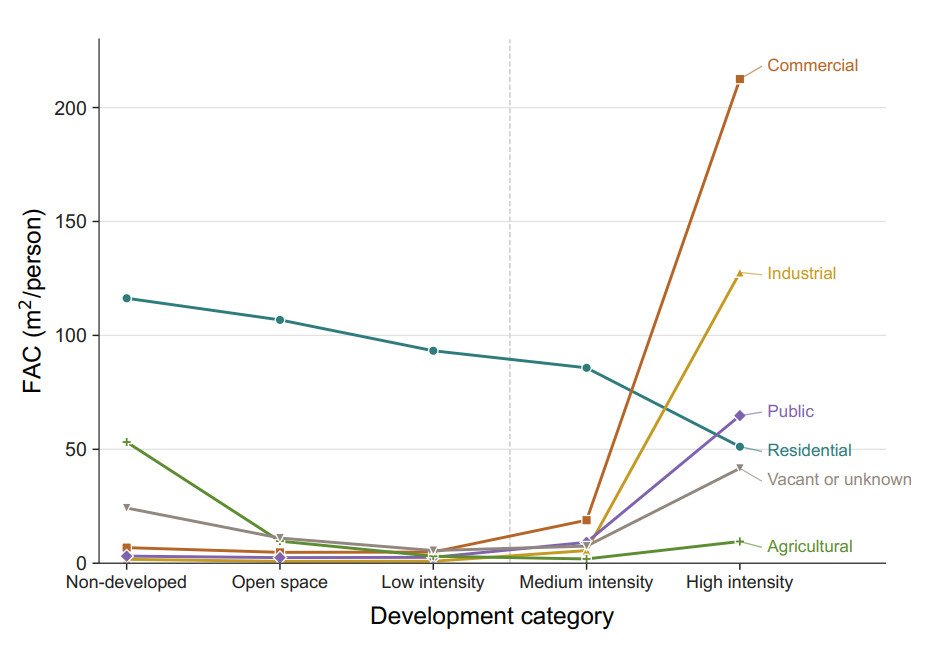
Figure 4. 2021 Texas Floor Area per Capita (FAC) for each building type across NLCD development categories. Residential FAC decreases with development intensity, while commercial, industrial, and public FAC increase sharply in high-intensity developed areas. Numerical values, including total FAC by development category, are provided in Supplementary Table 4.