


Figure2
From: A method for quantifying the upfront carbon footprint of urban densification in Texas through 2050
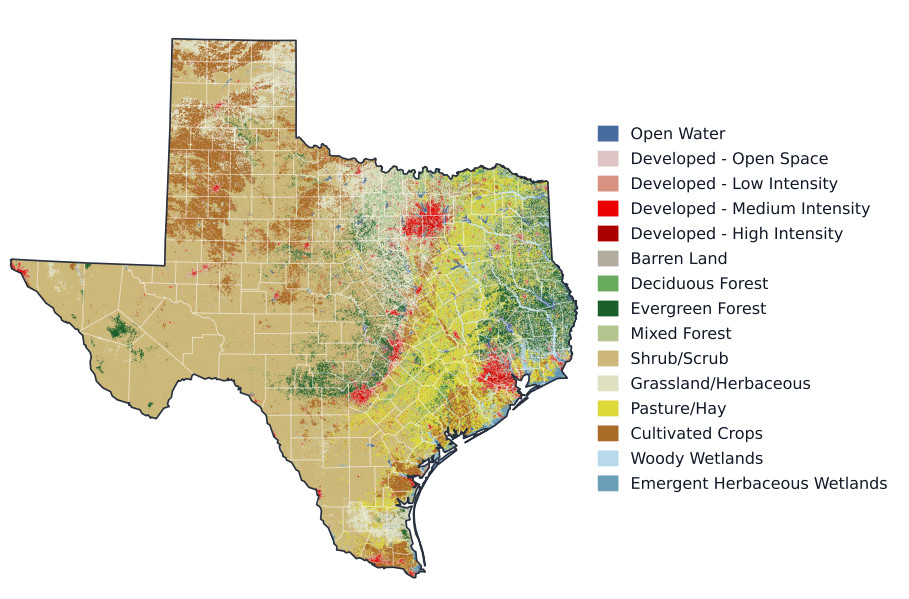
Figure 2. 2021 National Land Cover Database map clipped to Texas–used to develop baseline empirical relationships between land use, buildings, and population that feed the land cover change projections. Red pixels indicate urban settings, and it is clear that most of the current built environment exists within the "Texas Triangle"–the area broadly outlined by Dallas-Fort Worth, San Antonio, and Houston. Projections are driven by population growth and take place at the county level, which are outlined in white. County boundaries from Esri (2014)[37]; Texas state outline derived from the county polygons.