


Figure1
From: A method for quantifying the upfront carbon footprint of urban densification in Texas through 2050
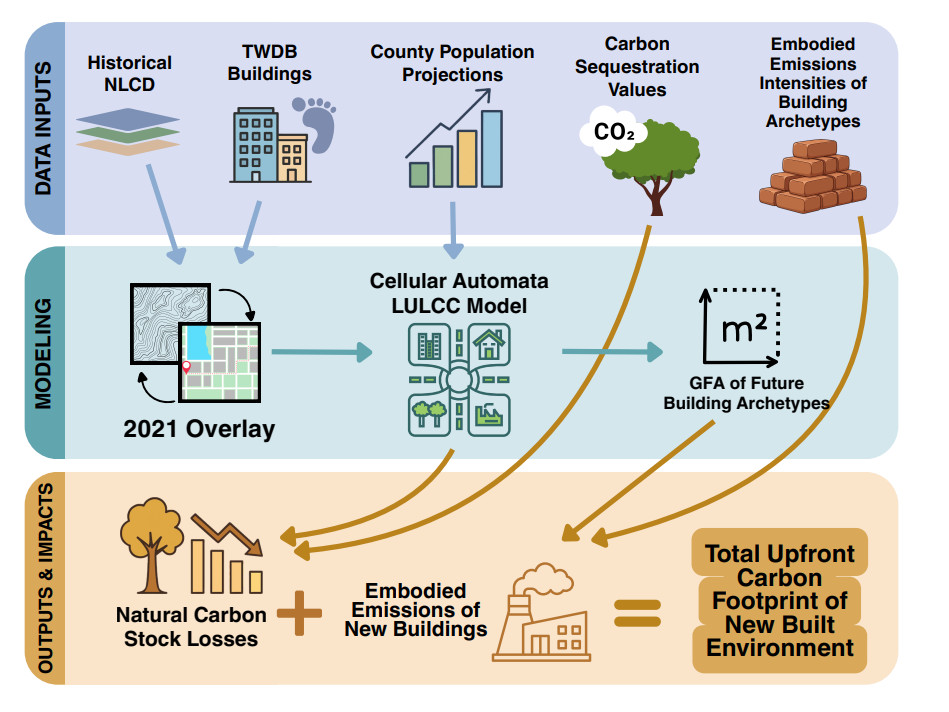
Figure 1. Flow diagram of overall methodology used in this study. national land cover database (NLCD) land cover[33], TWDB buildings[34], and TDC population datasets[28] are combined to produce a novel LULCC model that informs calculation of embodied carbon footprint of the Texas built environment. The diagram was created using Canva, and all icons and graphical elements are from Canva's built-in content library. https://www.canva.com/.