



fig2
From: Life cycle assessment of low carbon concrete using recycled concrete aggregate and rice husk ash
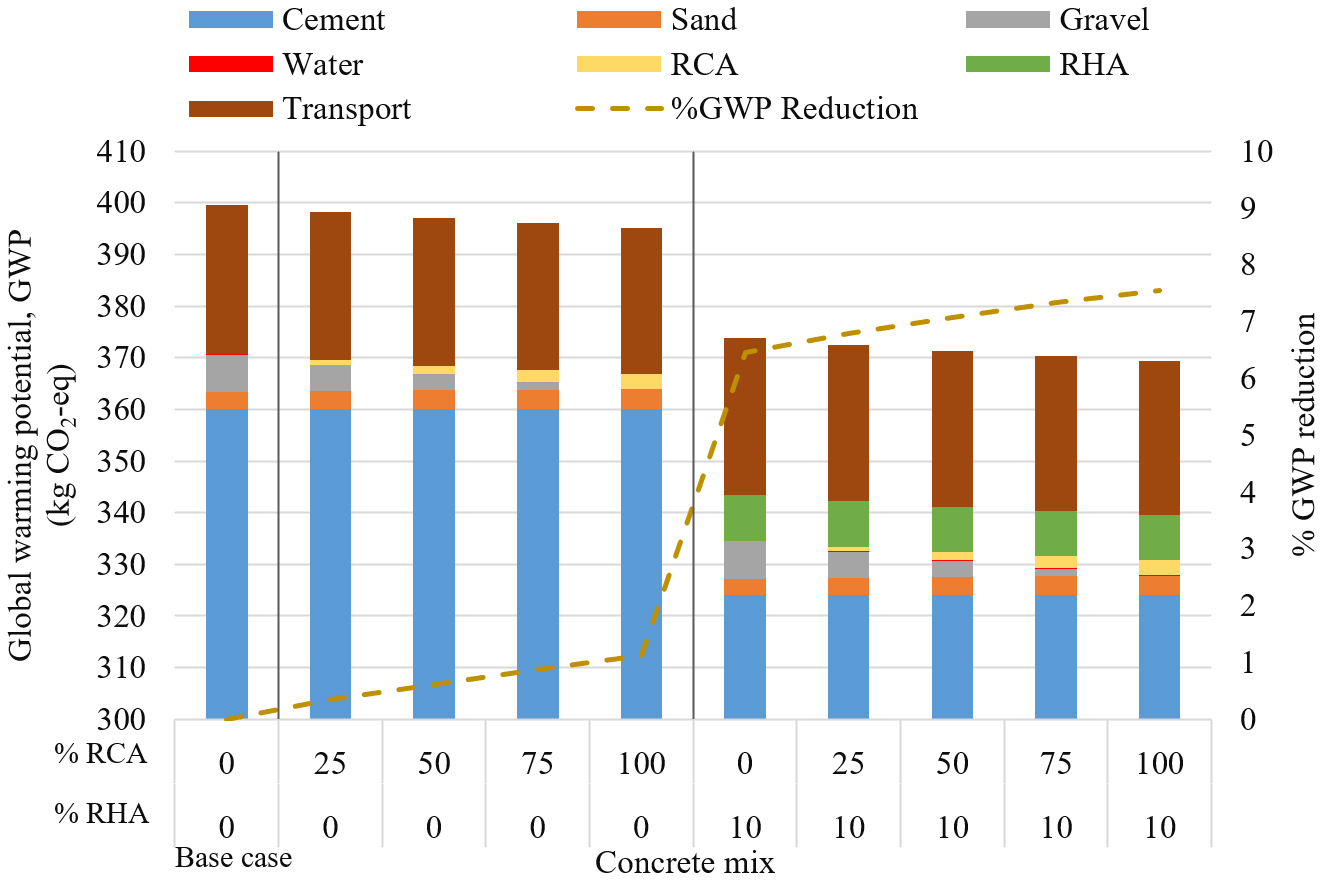
Figure 2. Global warming potential and %GWP reduction of varying concrete mixes. Note: The vertical axis is intentionally truncated to improve visualization of the relative contributions of the life cycle inventory components.





