



fig5
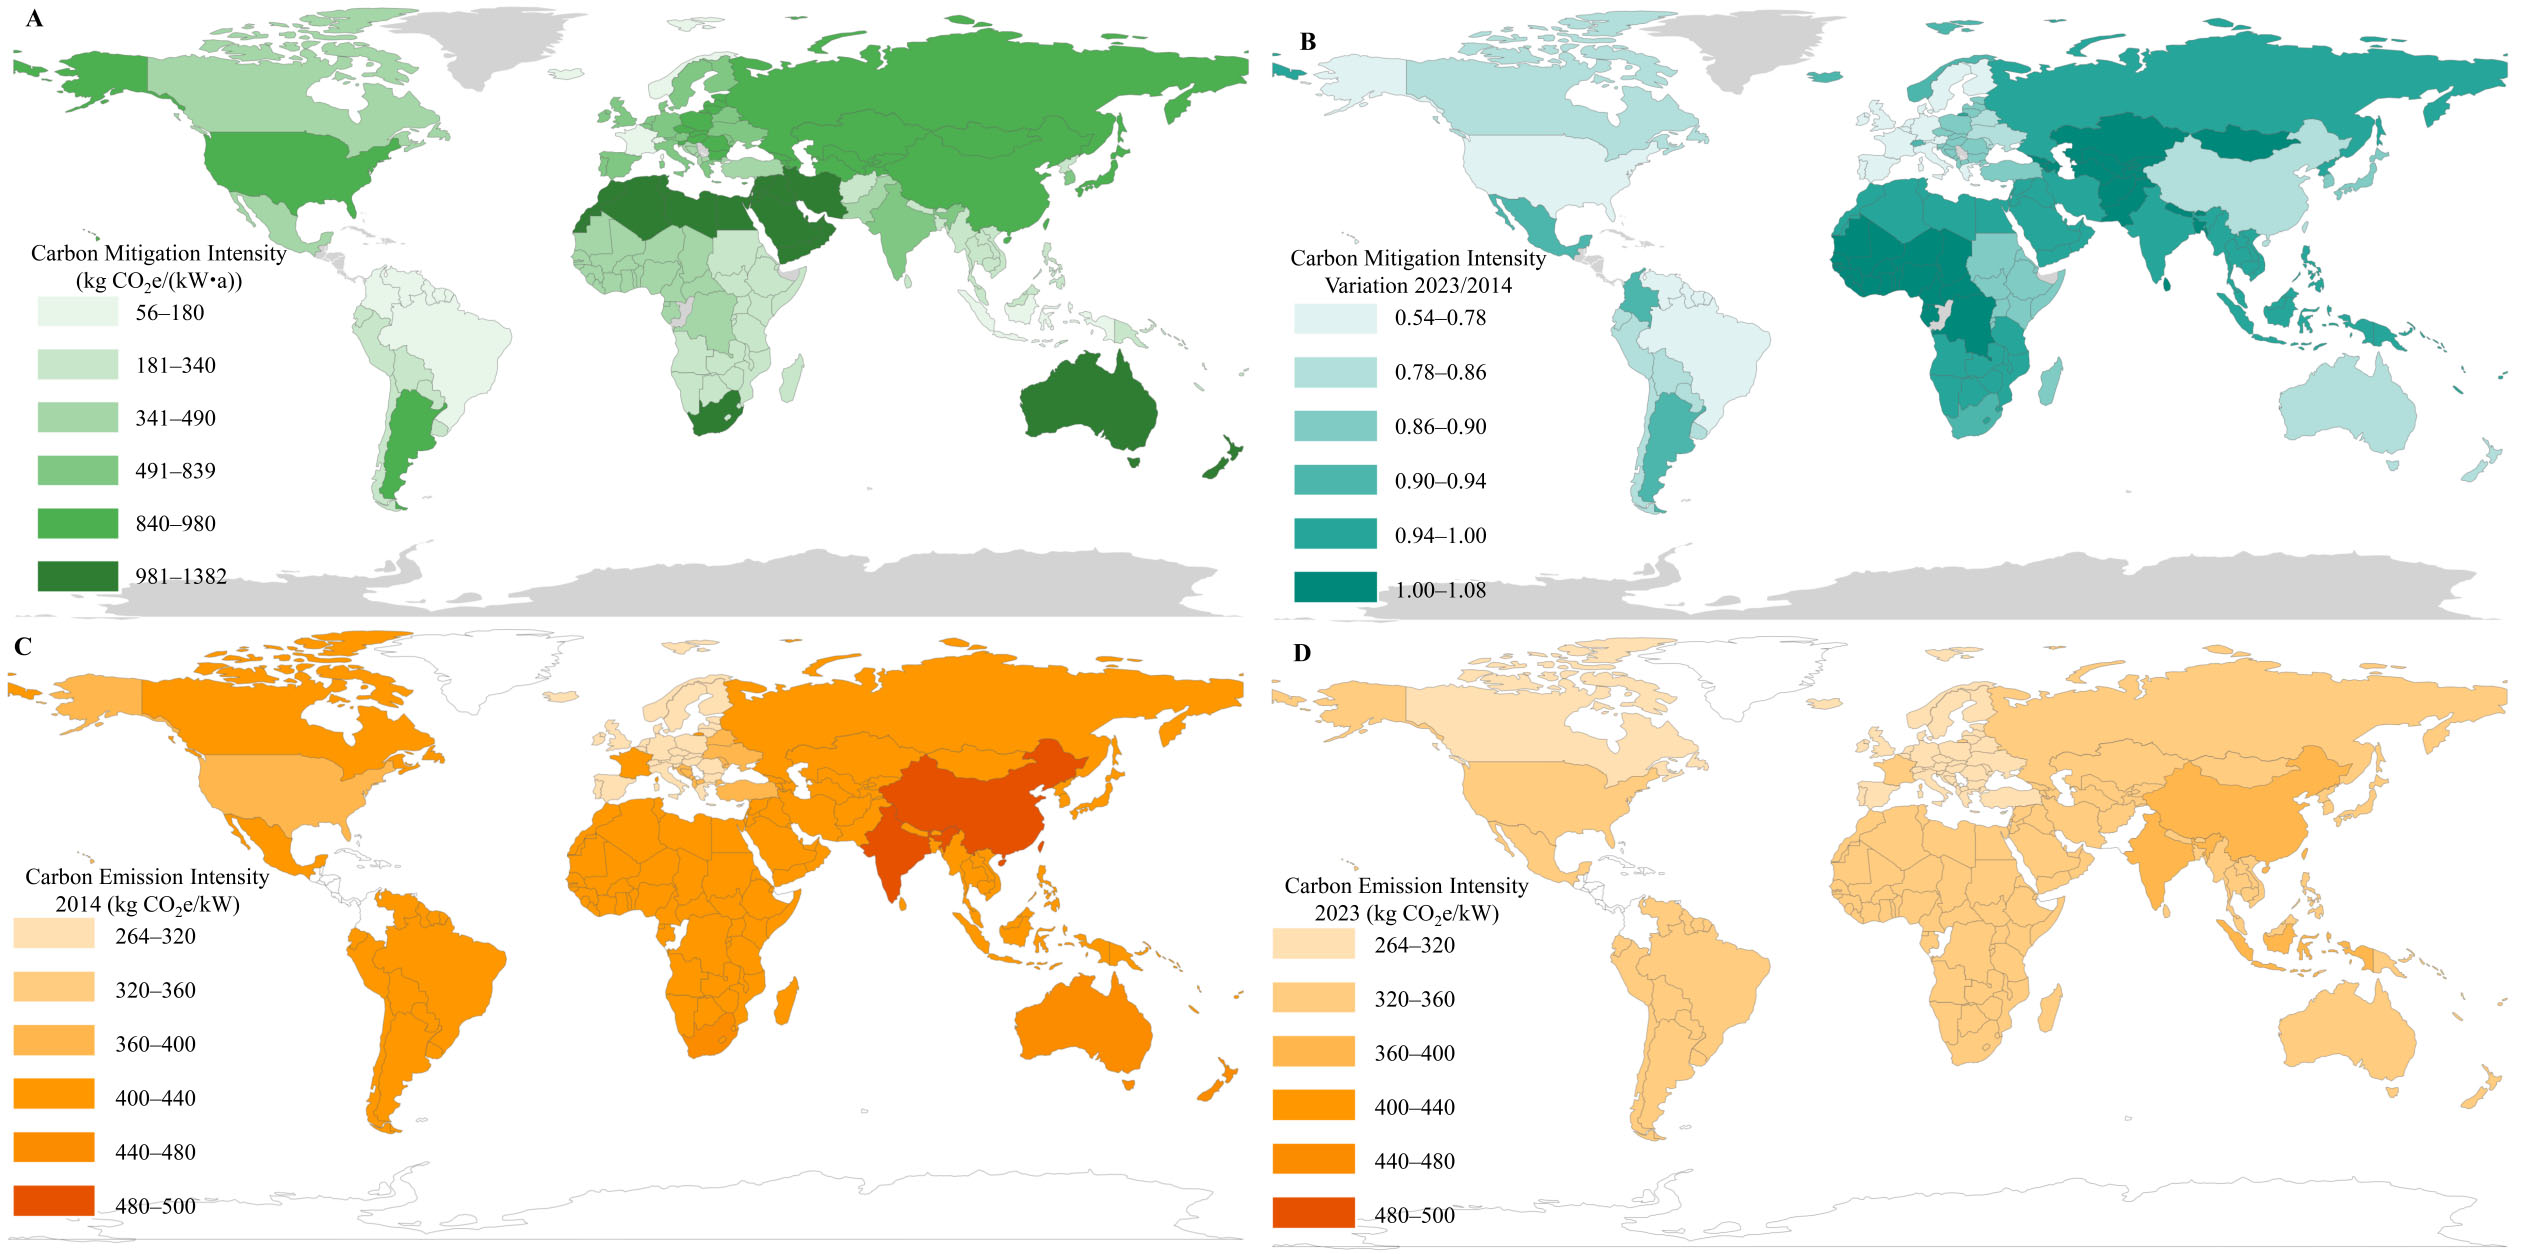
Figure 5. Spatiotemporal dynamics of carbon mitigation intensity and carbon emission intensity. (A) Carbon mitigation intensity across regions in 2014; (B) Carbon mitigation intensity variation expressed as the ratio of carbon mitigation intensity in 2023 to that of 2014; (C) Carbon emission intensity across regions in 2014; (D) Carbon emission intensity across regions in 2023. White and gray regions indicate the absence of data. The country boundary data are obtained from the Folium example GeoJSON dataset (https://raw.githubusercontent.com/python-visualization/folium/master/examples/data/world-countries.json).





