



fig3
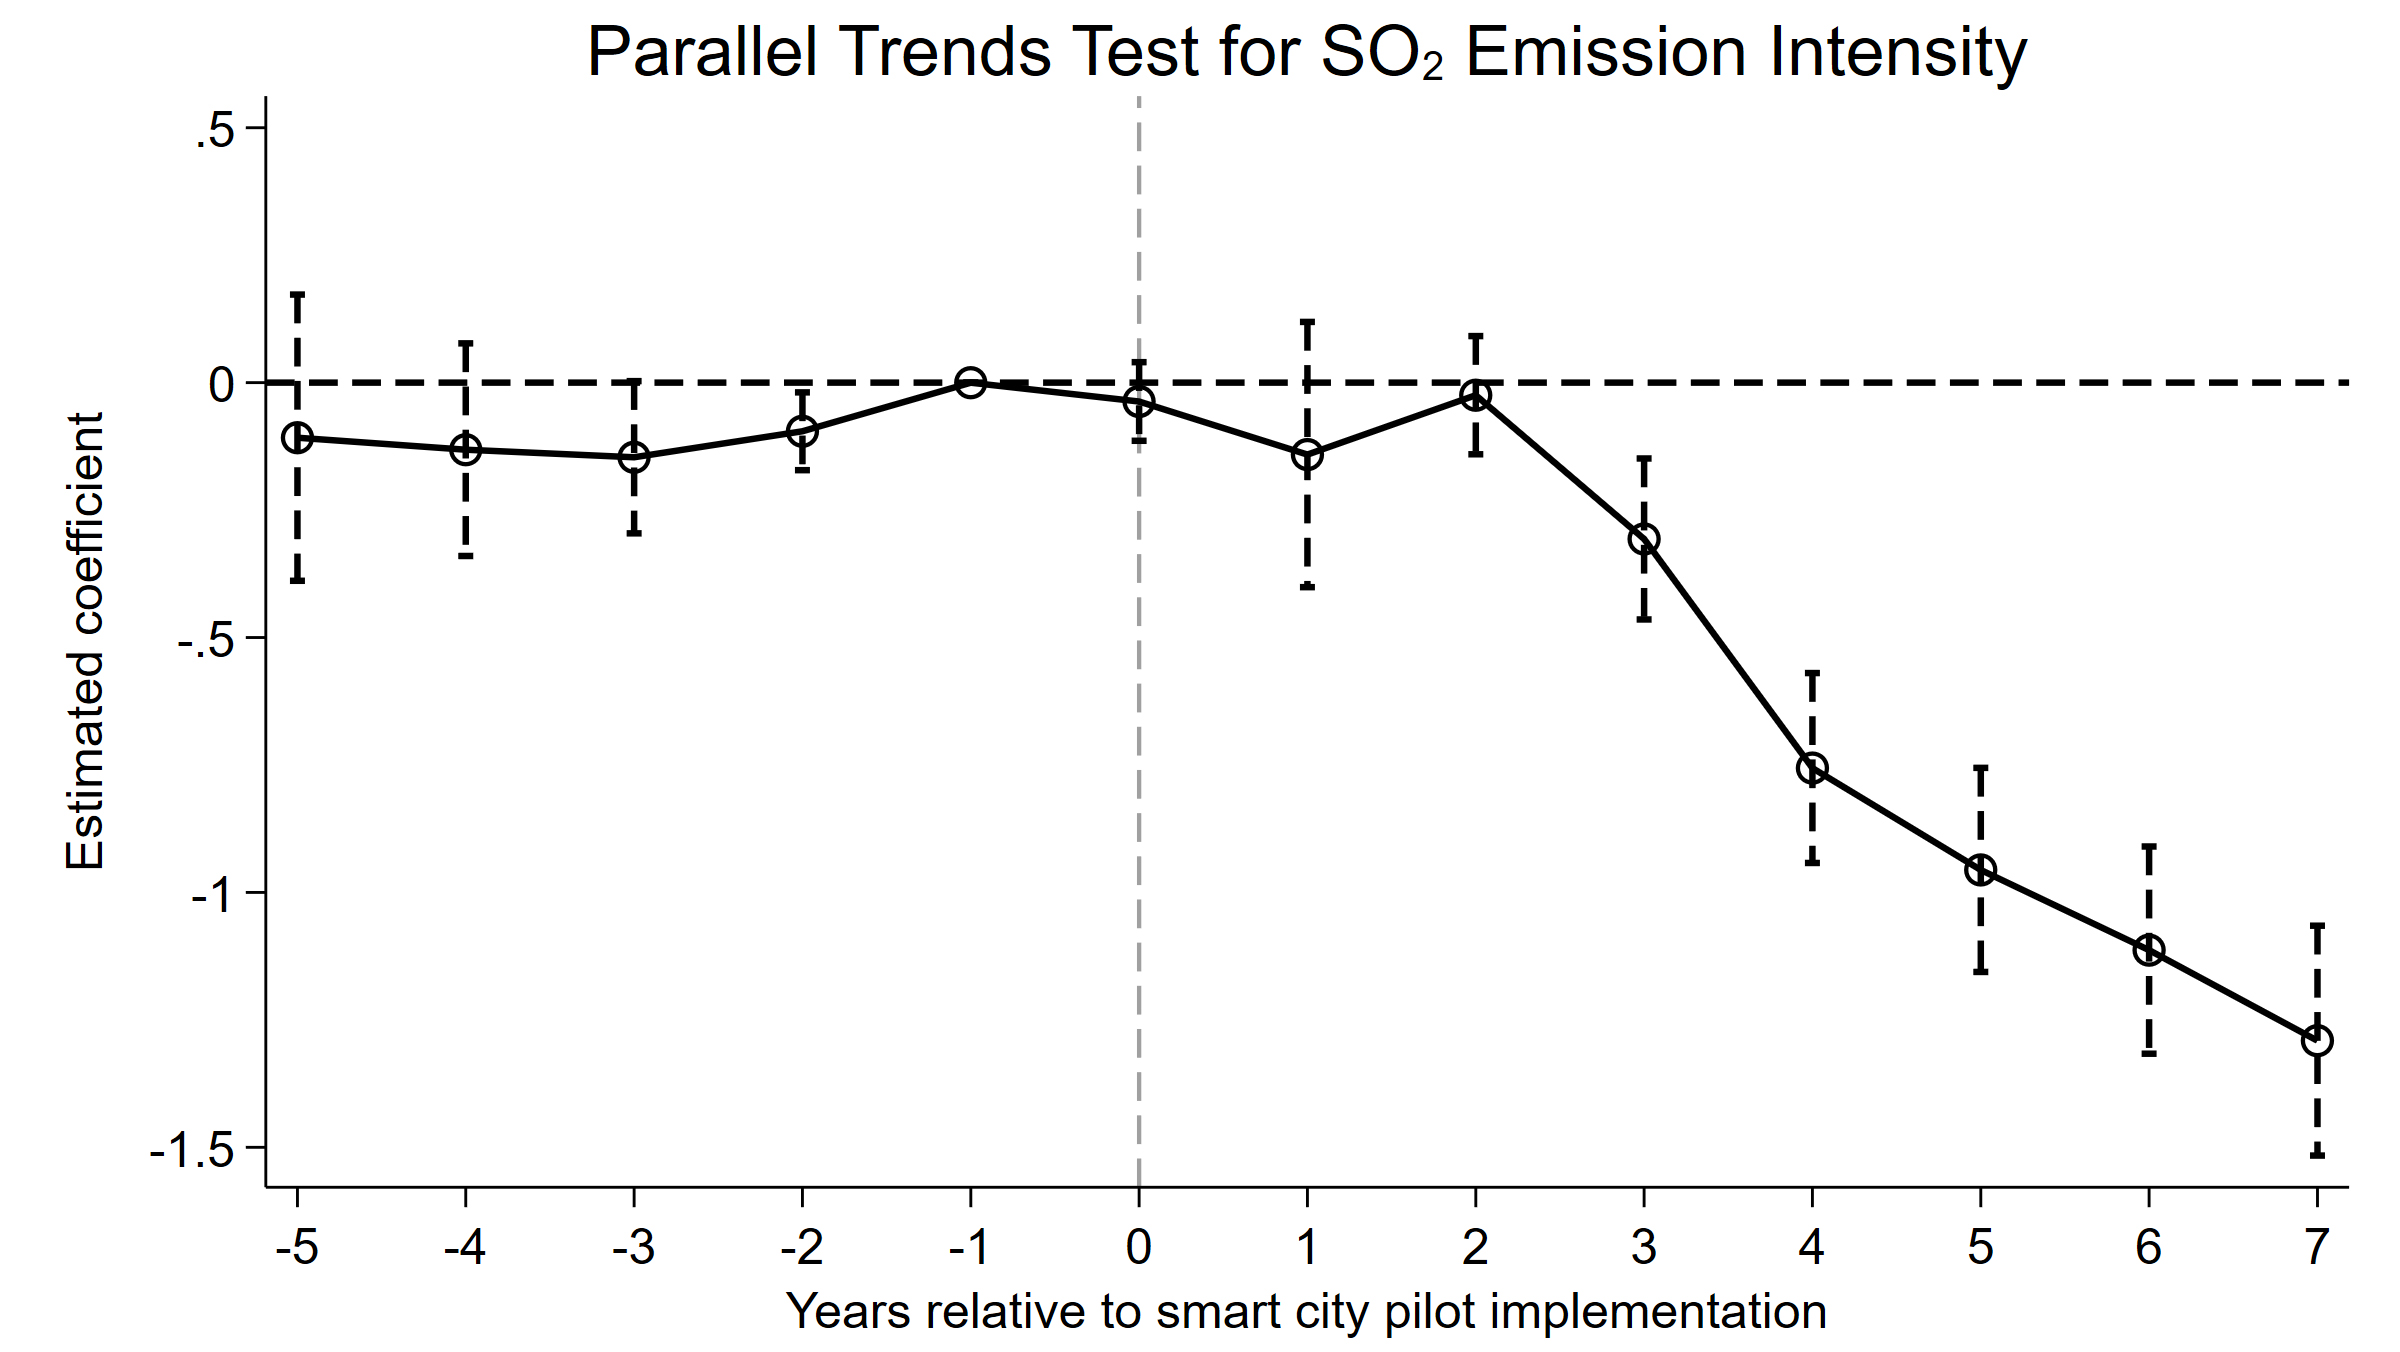
Figure 3. Parallel trend test of SO2 emission intensity. The horizontal dashed line denotes the zero-effect benchmark, the vertical dashed line marks the year of policy implementation (event time = 0), and the capped vertical bars represent 95% confidence intervals.





