



fig2
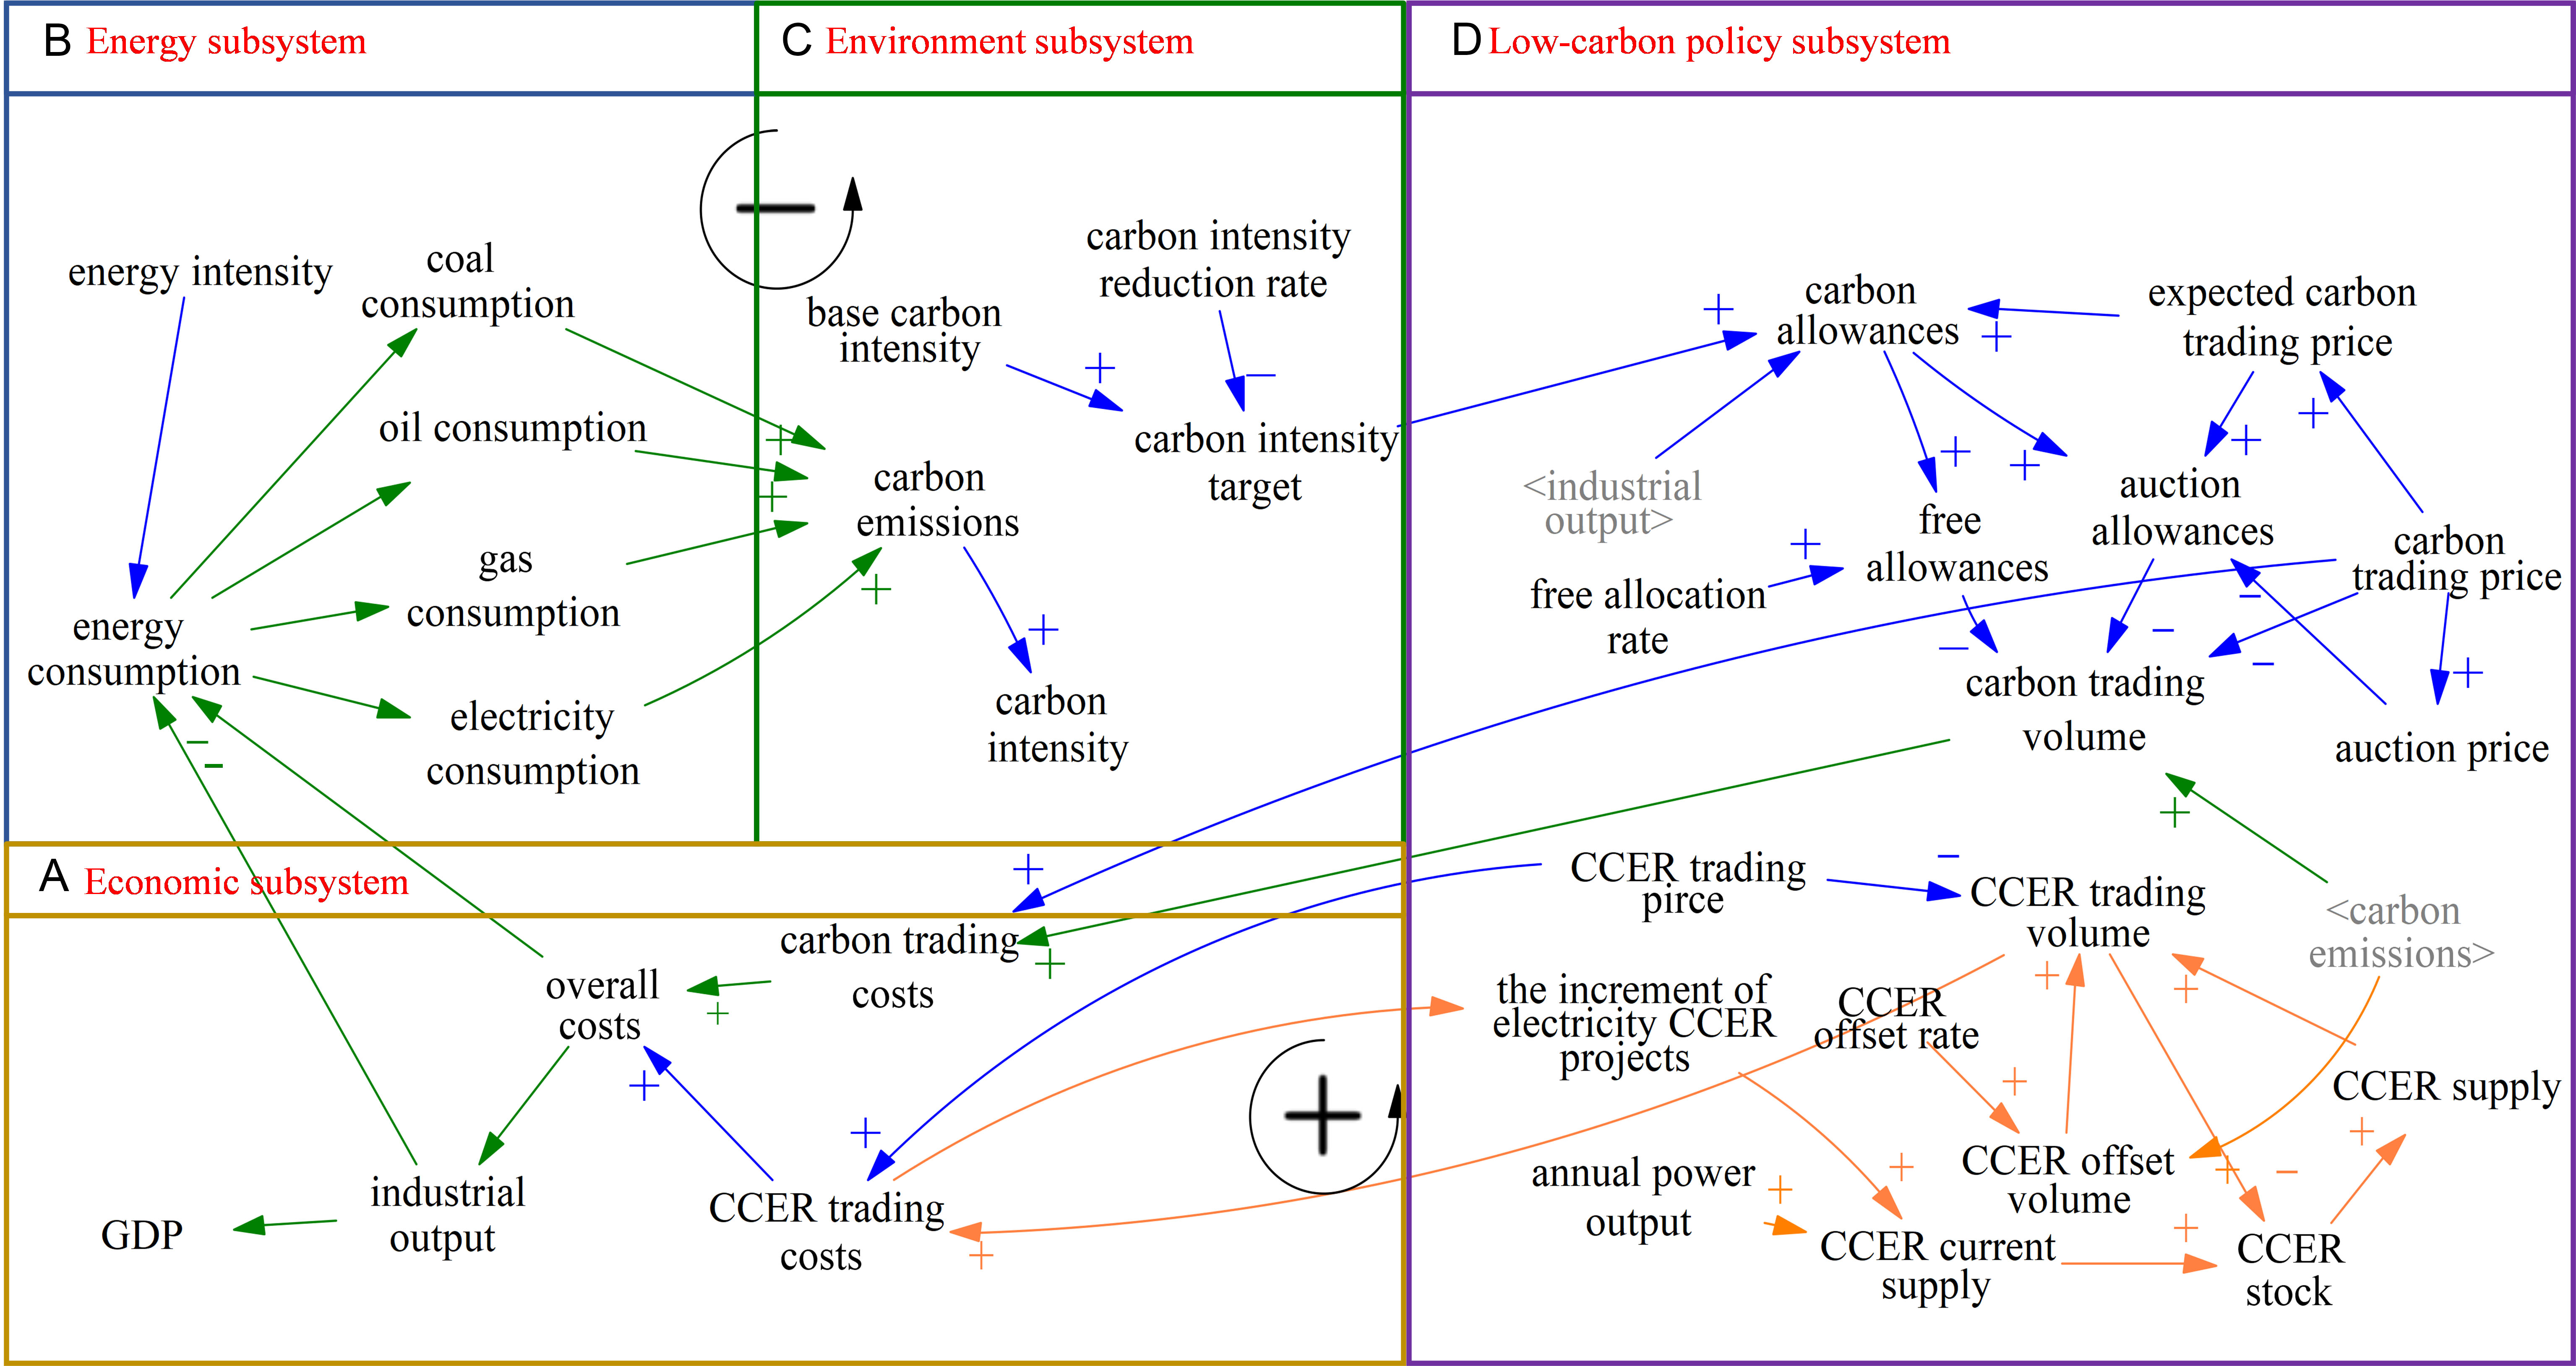
Figure 2. Causal loop diagram. (A) shows the economic subsystems involved in the causal loop; (B) shows the energy subsystems involved in the causal loop; (C) shows the environment subsystems involved in the causal loop; (D) shows the low-carbon policy subsystems involved in the causal loop. “+” and “-” indicate positive and negative causal relationships, respectively. CCER: China Certified Emission Reduction.