



fig10
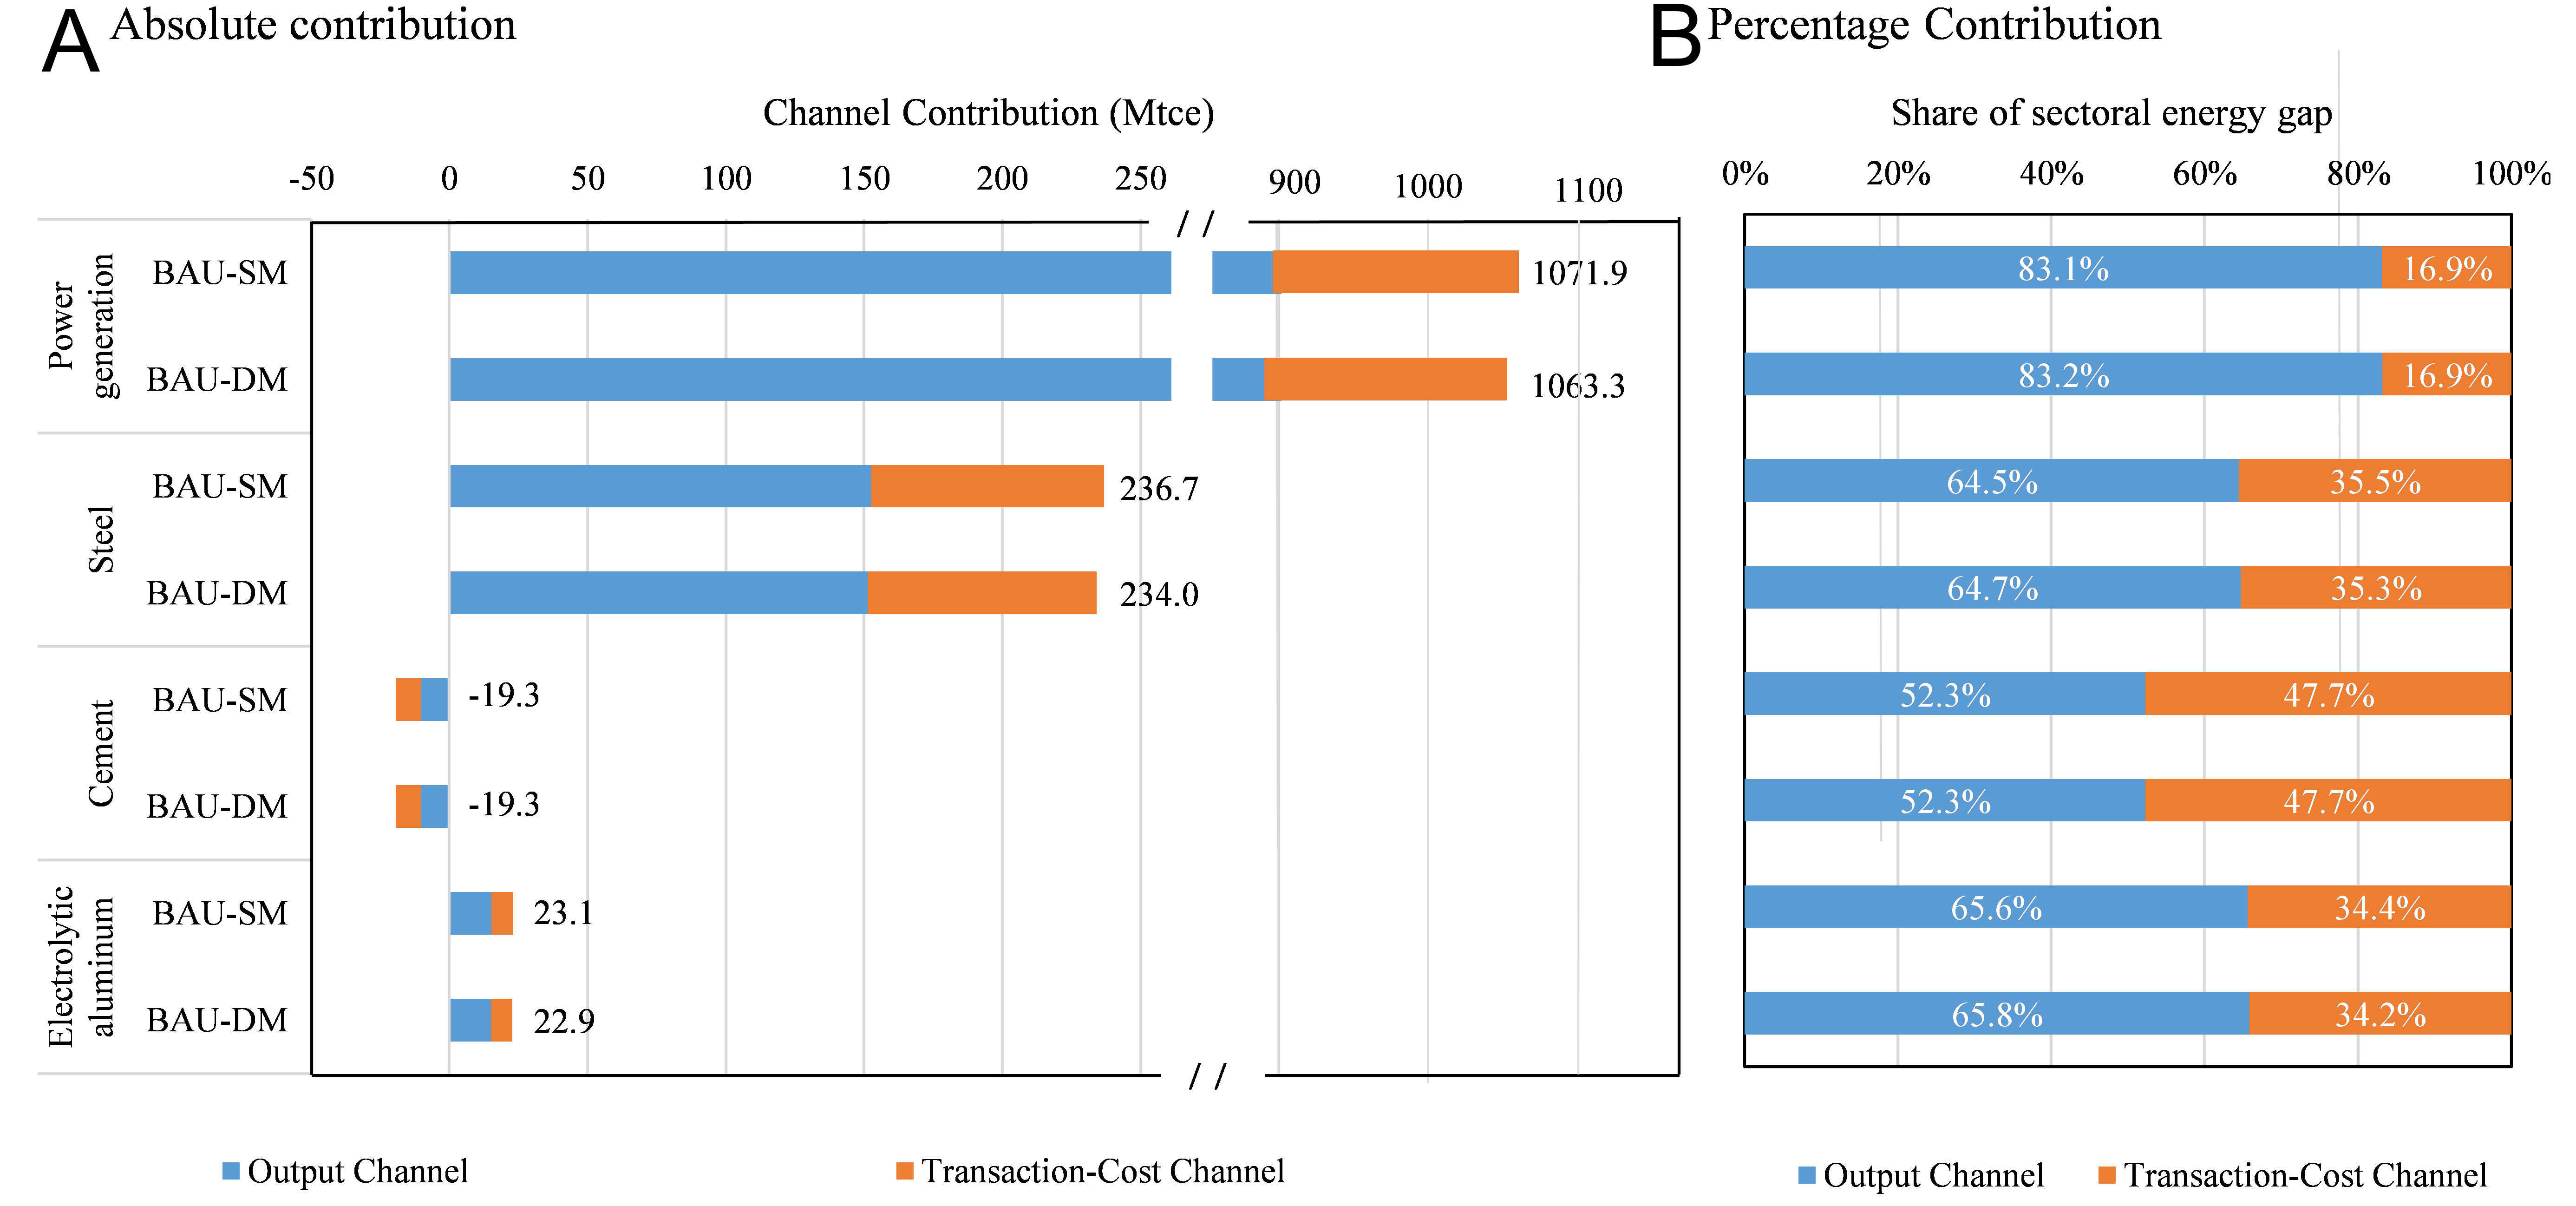
Figure 10. Sectoral decomposition of the 2030 energy-consumption gap between the BAU scenario and both SM and DM scenarios. (A) presents the absolute contributions of the output channel and transaction cost channel in each sector; (B) presents the percentage contribution of each channel to the corresponding sectoral energy gap. Positive values indicate energy savings under SM and DM, while negative values indicate an energy-consumption rebound. Owing to floating-point arithmetic limitations, the sum may deviate slightly from unity. BAU is the baseline scenario with no carbon trading market. SM is the single market scenario with ETS. DM is the dual market scenario integrating ETS and CCER. CCER: China Certified Emission Reduction; ETS: China’s Emissions Trading System.