


fig6
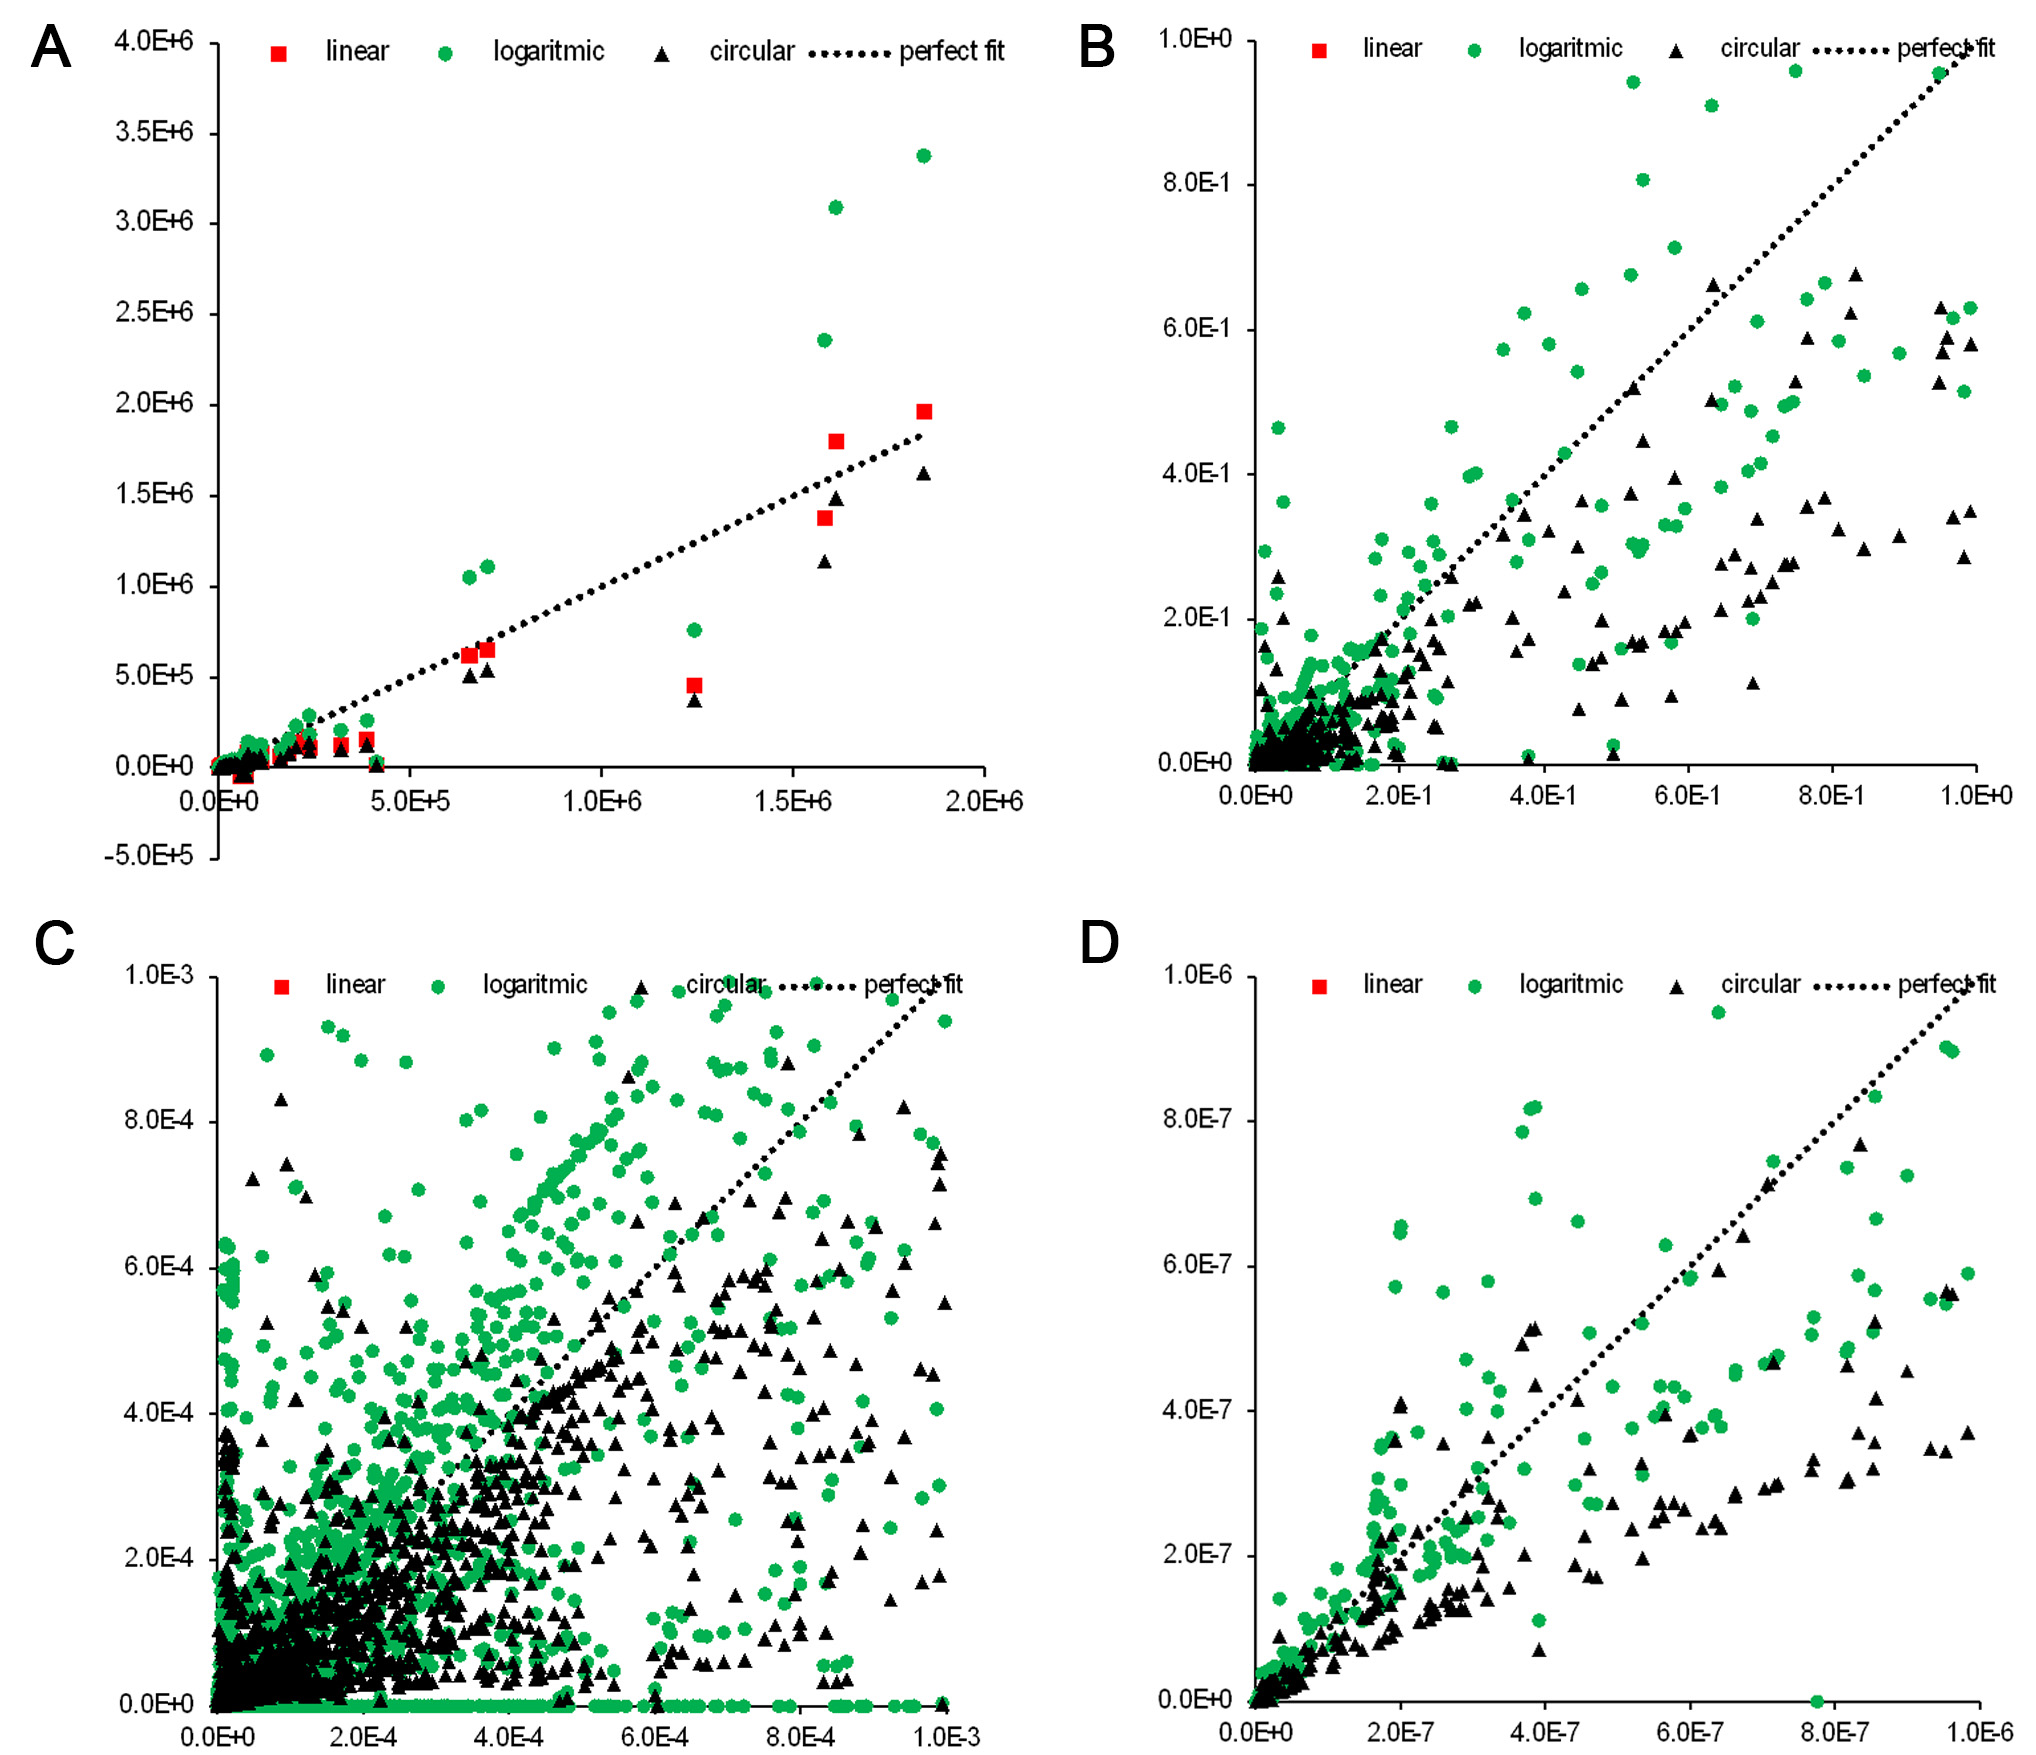
Figure 6. Scatterplots of true (horizontal axis) versus predicted (vertical axis) acidification impacts using three methods. Panel (A) shows the full dataset; panels (B-D) provide zoomed views of regions with smaller values.
Figure 6. Scatterplots of true (horizontal axis) versus predicted (vertical axis) acidification impacts using three methods. Panel (A) shows the full dataset; panels (B-D) provide zoomed views of regions with smaller values.


All published articles are preserved here permanently
https://www.portico.org/publishers/oae/


