


fig4
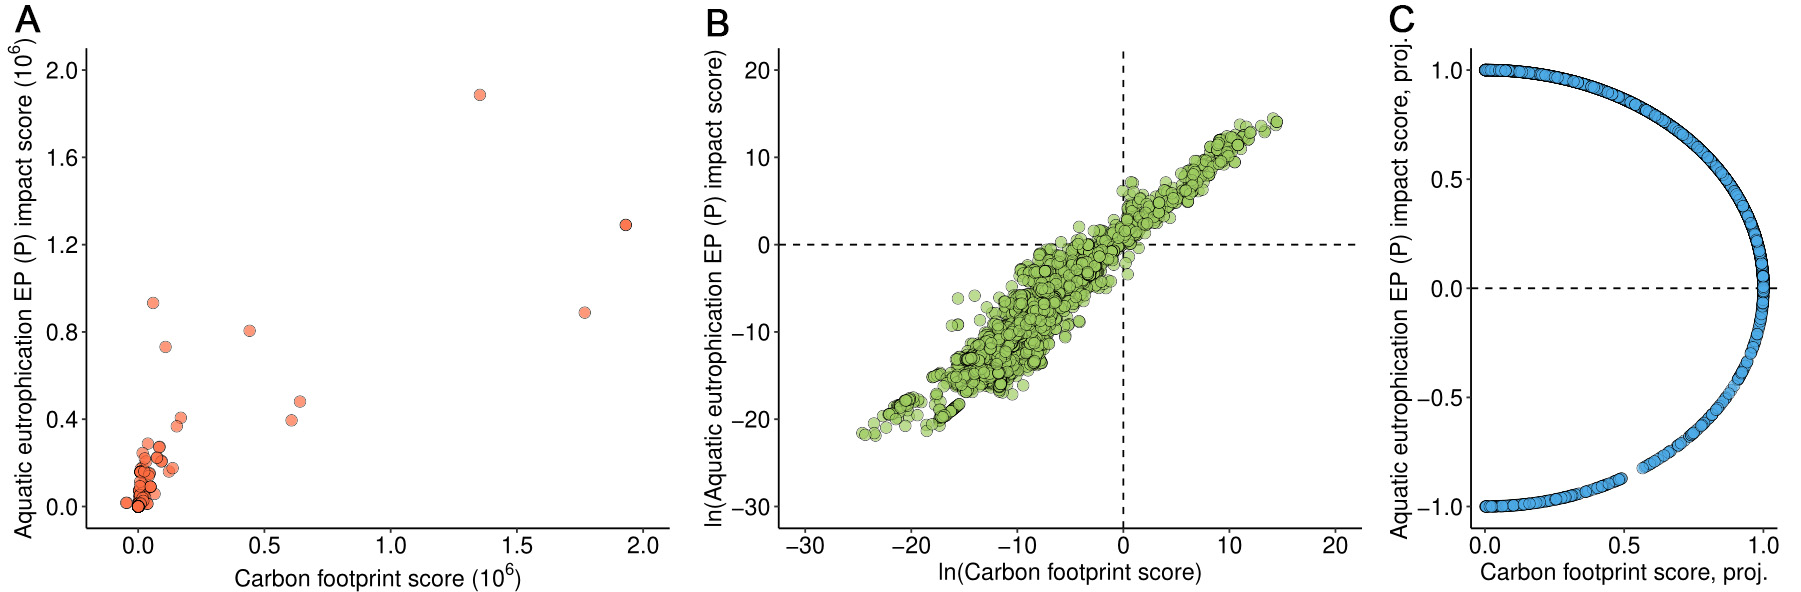
Figure 4. Scatterplots of the carbon footprint (horizontal axis) versus aquatic eutrophication EP (P) impact (vertical axis) for the product sample. Panel (A) shows both axes on a linear scale; panel (B) uses logarithmic scales; panel (C) presents the data projected onto the unit circle (“proj.”).


