fig1

The uncertainty of using carbon footprint as a predictor of overall environmental impacts: comparing linear, logarithmic and circular methods

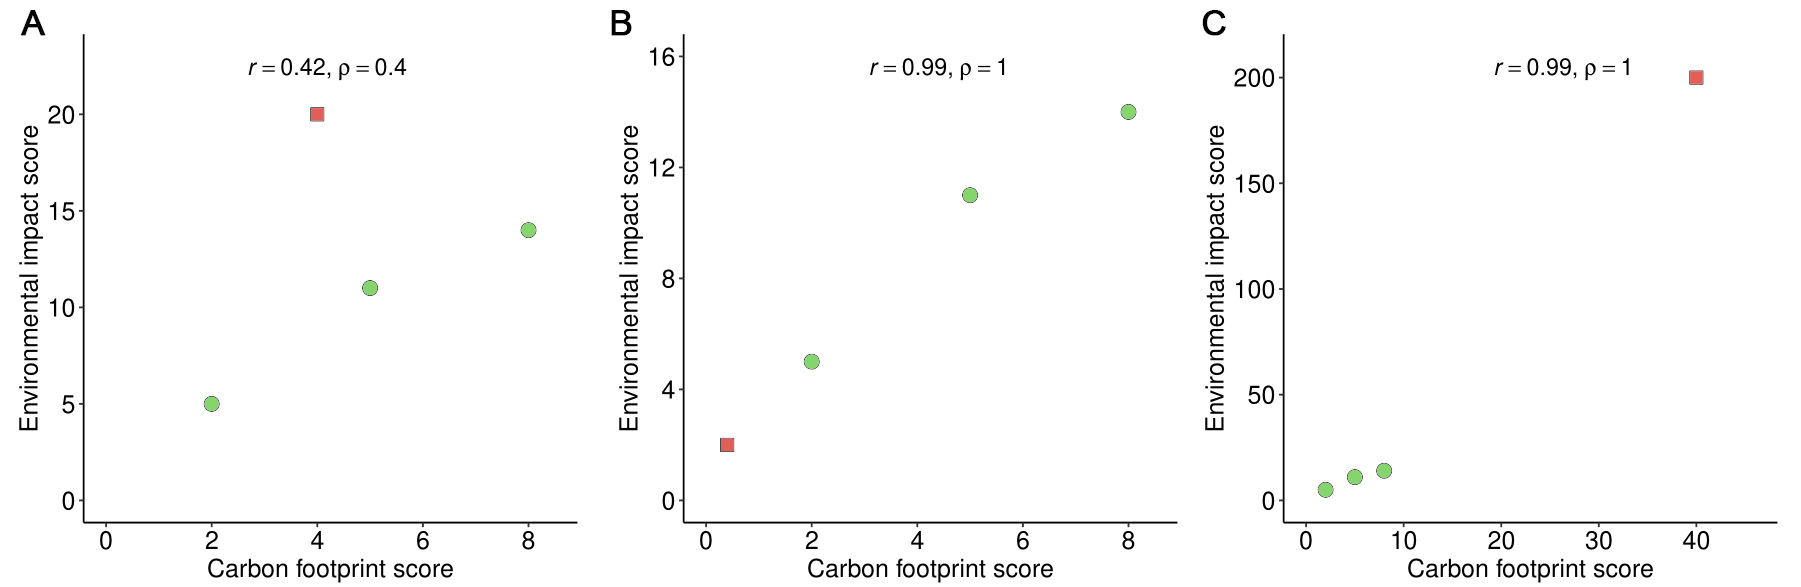
Figure 1. (A) Four data points yield a weak correlation; (B) Rescaling the red square data point by a factor of 0.1 produces a strong correlation; (C) Rescaling the same data point by a factor of 10 also results in a strong correlation. The Pearson correlation coefficient is denoted r, and the Spearman rank correlation coefficient is denoted ρ.

Carbon Footprints
ISSN 2831-932X (Online)

Portico

All published articles are preserved here permanently

https://www.portico.org/publishers/oae/

Portico

All published articles are preserved here permanently

https://www.portico.org/publishers/oae/