

fig3
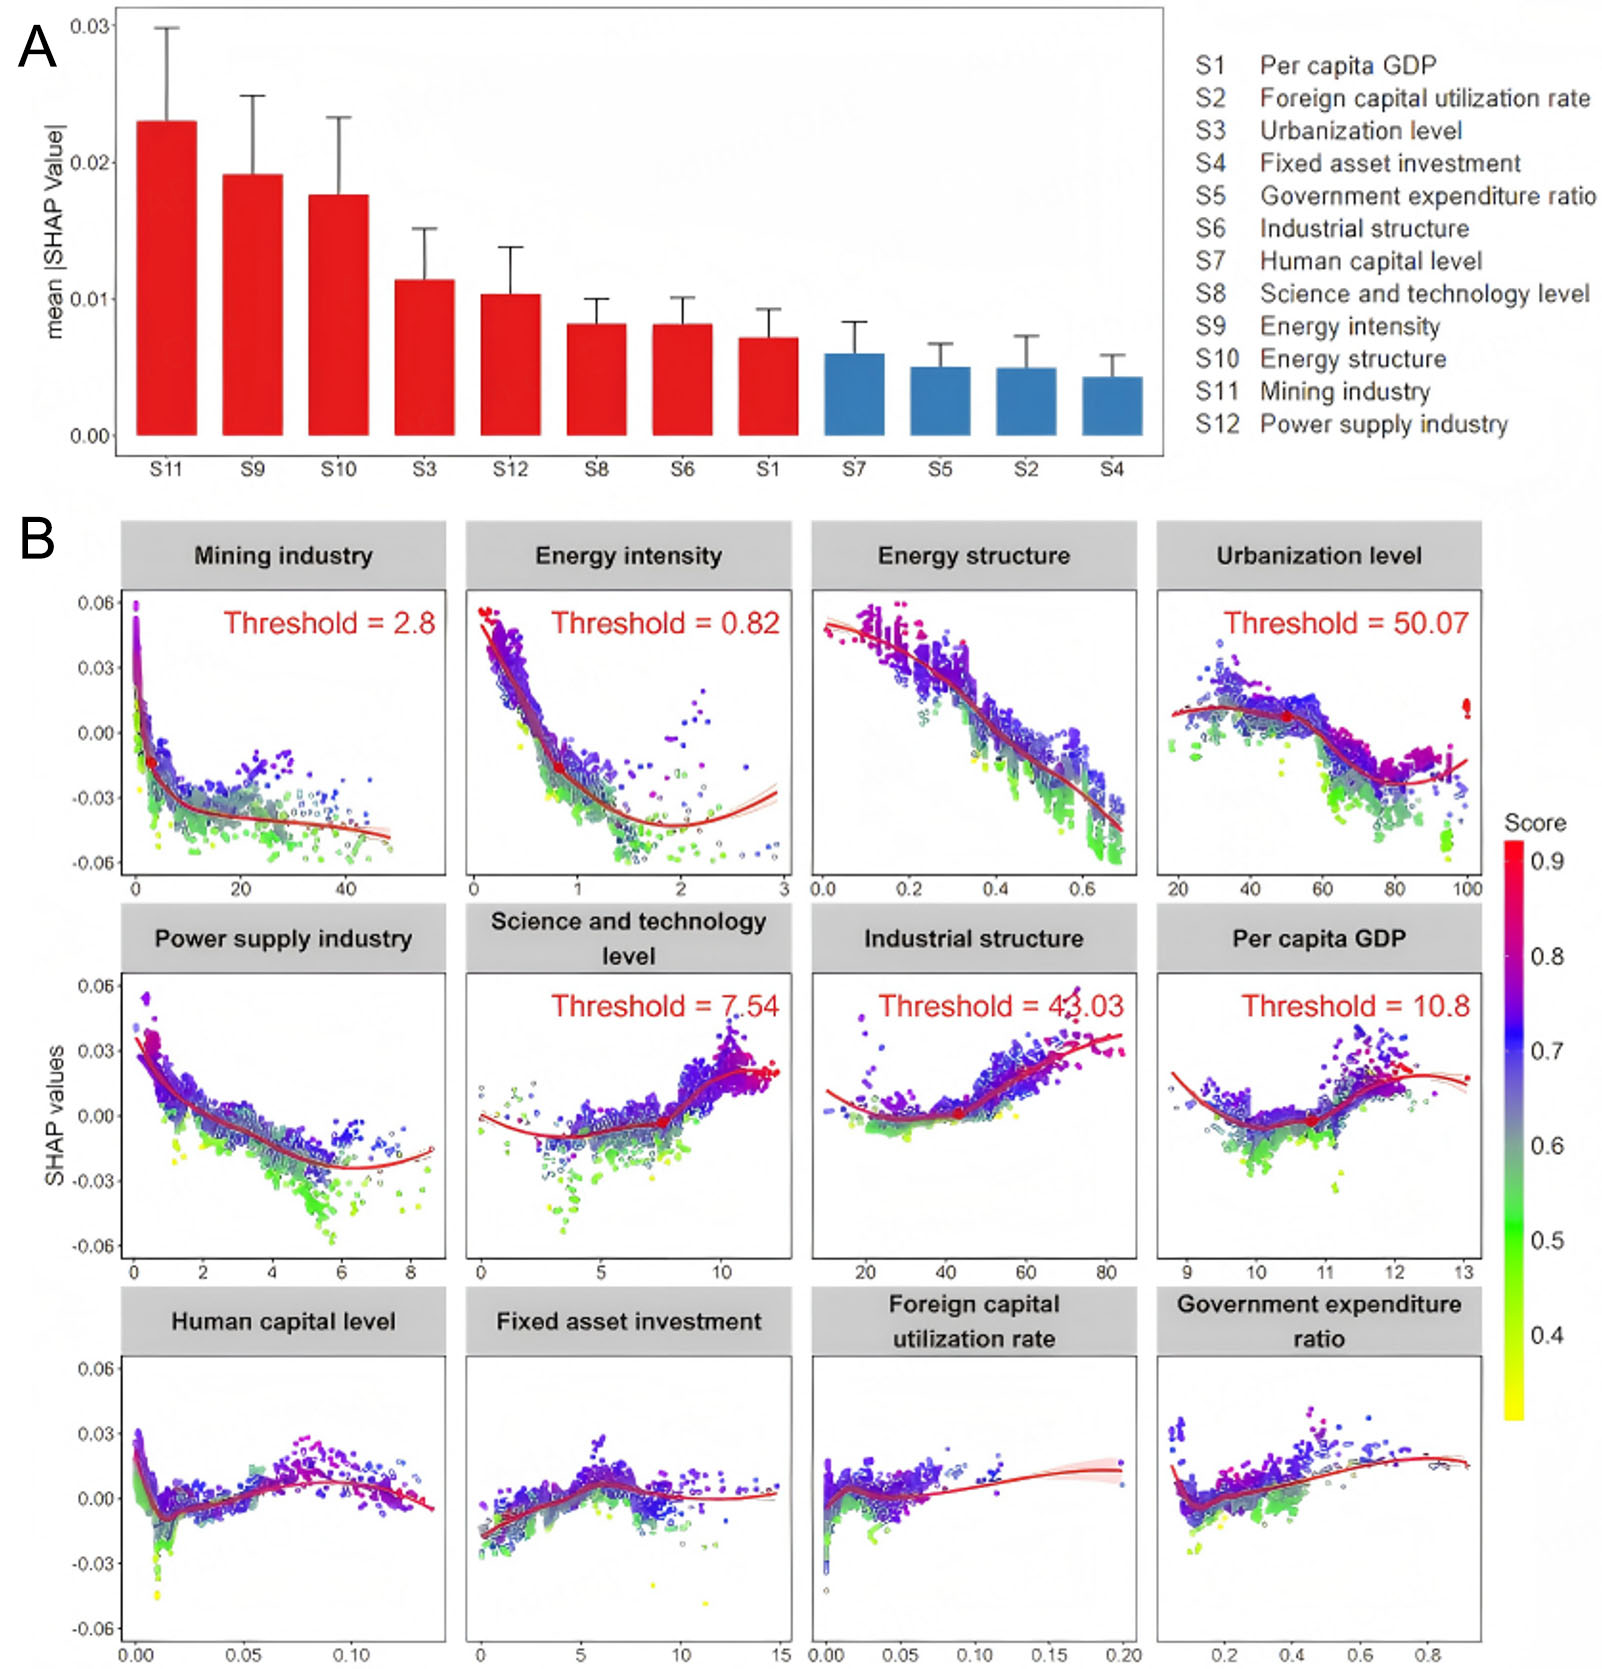
Figure 3. Contribution and nonlinear effects of socioeconomic variables on synergistic governance performance. (A) Mean SHAP value ranking of socioeconomic factors, where higher ranks indicate greater predictive importance. (B) Non-linear relationships between socioeconomic factors and synergistic governance, with point color indicating the level of synergistic governance. Curves are fitted using LOESS, and shaded areas denote the 95% confidence intervals.


