

fig5
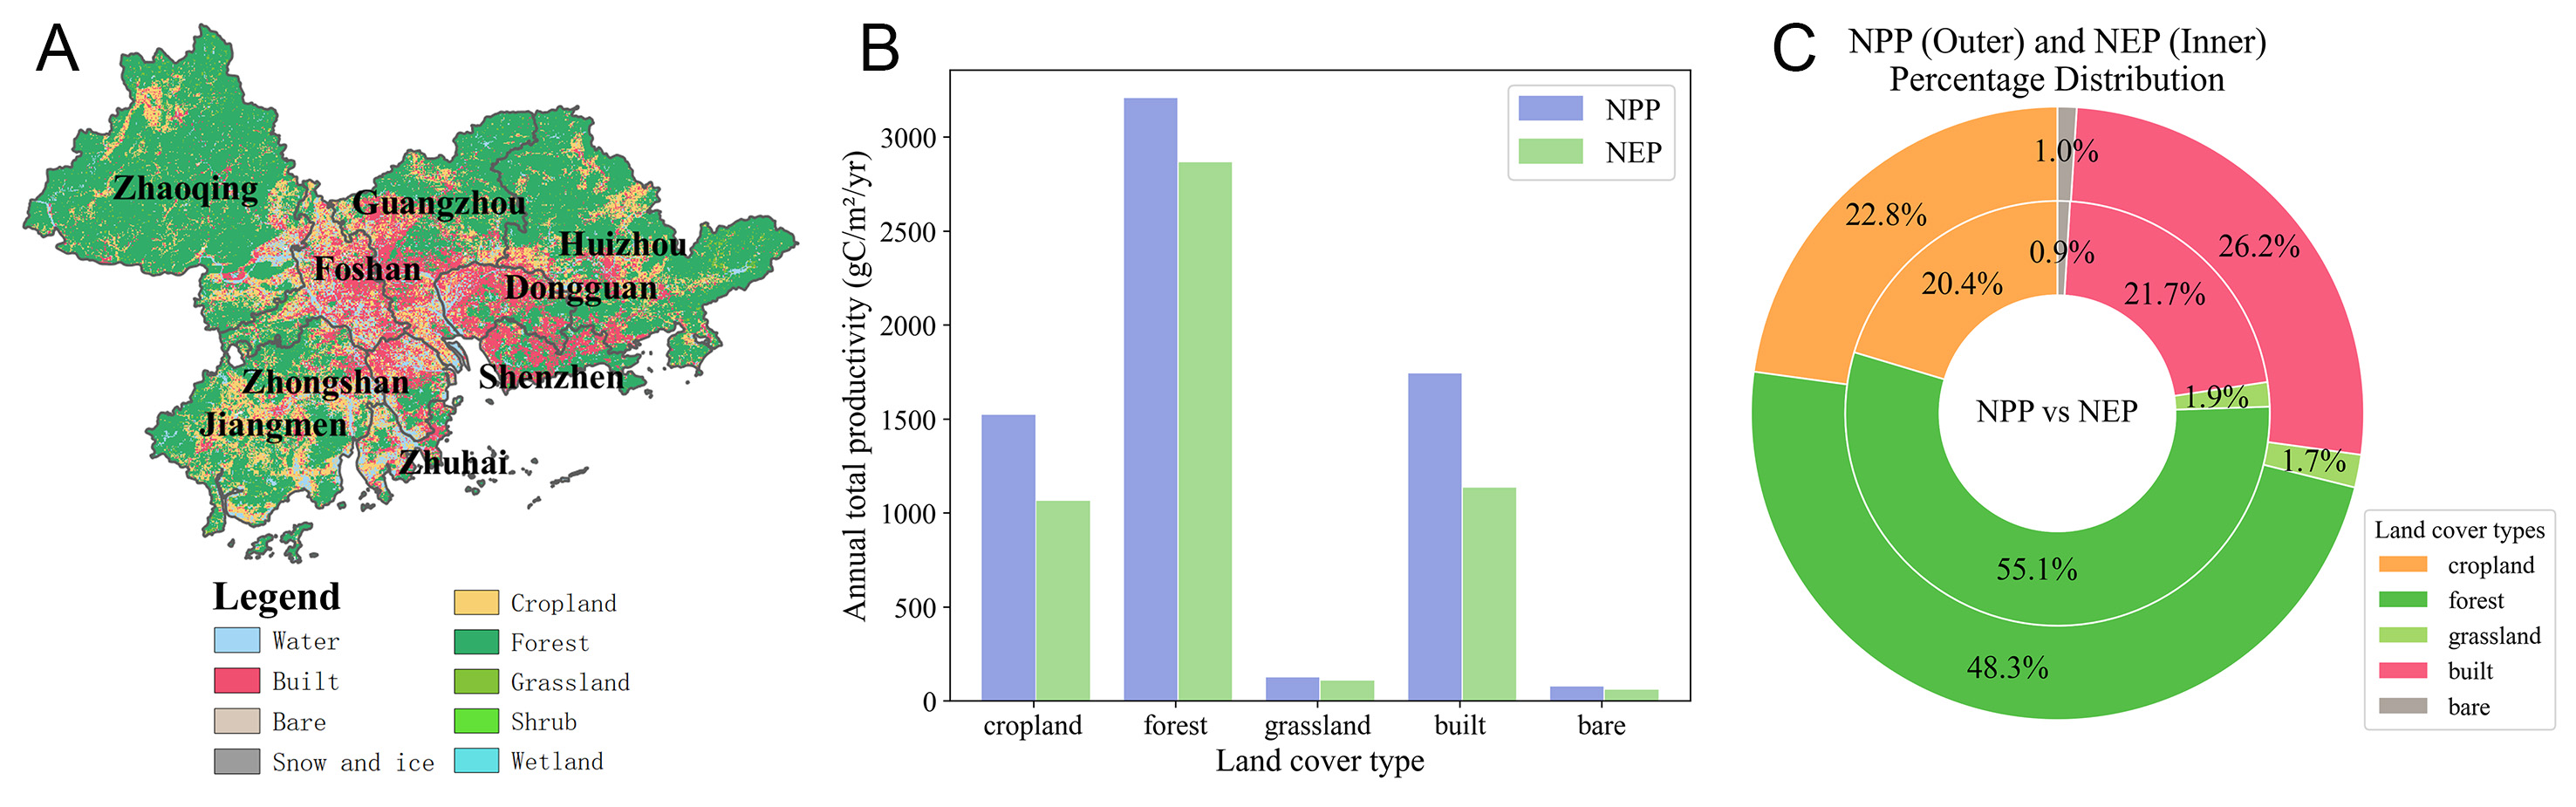
Figure 5. (A) LULC classification map of the PRD region. (B) Annual total amount of NPP and NEP by LULC types. (C) Percentage distribution of NPP and NEP by LULC types.
Figure 5. (A) LULC classification map of the PRD region. (B) Annual total amount of NPP and NEP by LULC types. (C) Percentage distribution of NPP and NEP by LULC types.


All published articles are preserved here permanently
https://www.portico.org/publishers/oae/


