

fig3
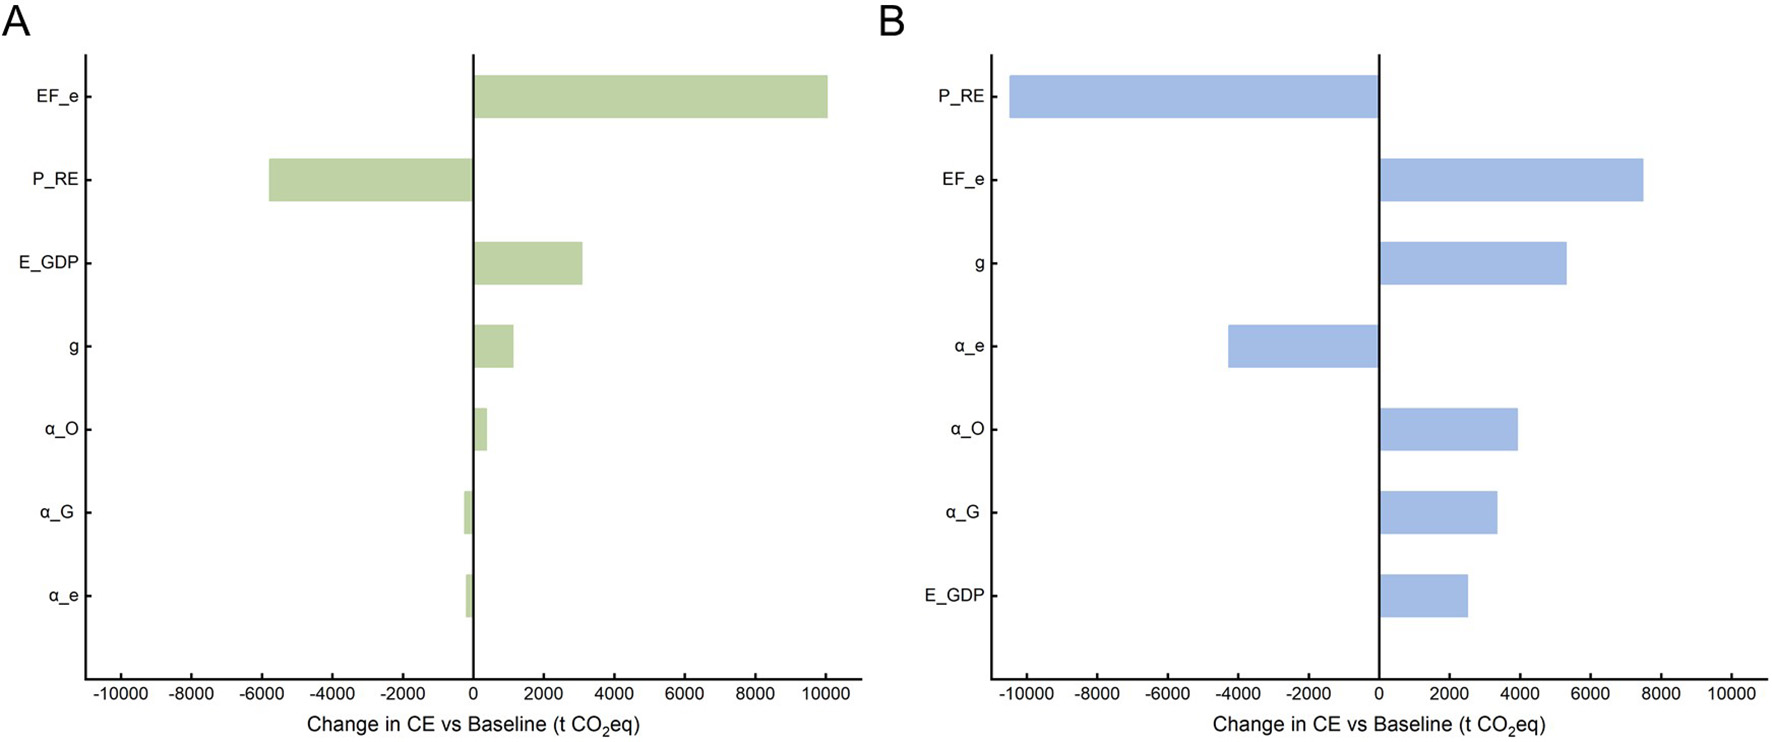
Figure 3. Sensitivity analysis. (A) Absolute changes in emissions in 2030. (B) Absolute changes in emissions in 2040. P_RE: Share of renewable energy in total electricity consumption; EF_e: carbon emission factor for electricity; g: GDP growth rate; α_e: proportion of electricity in total energy consumption; α_O: proportion of gasoline in total energy consumption; α_G: proportion of natural gas in total energy consumption; E_GDP: energy consumption per 10,000 CNY of GDP.


