

fig3
From: Evolution of urban green space carbon sinks and their value in the arid region of Northwest China
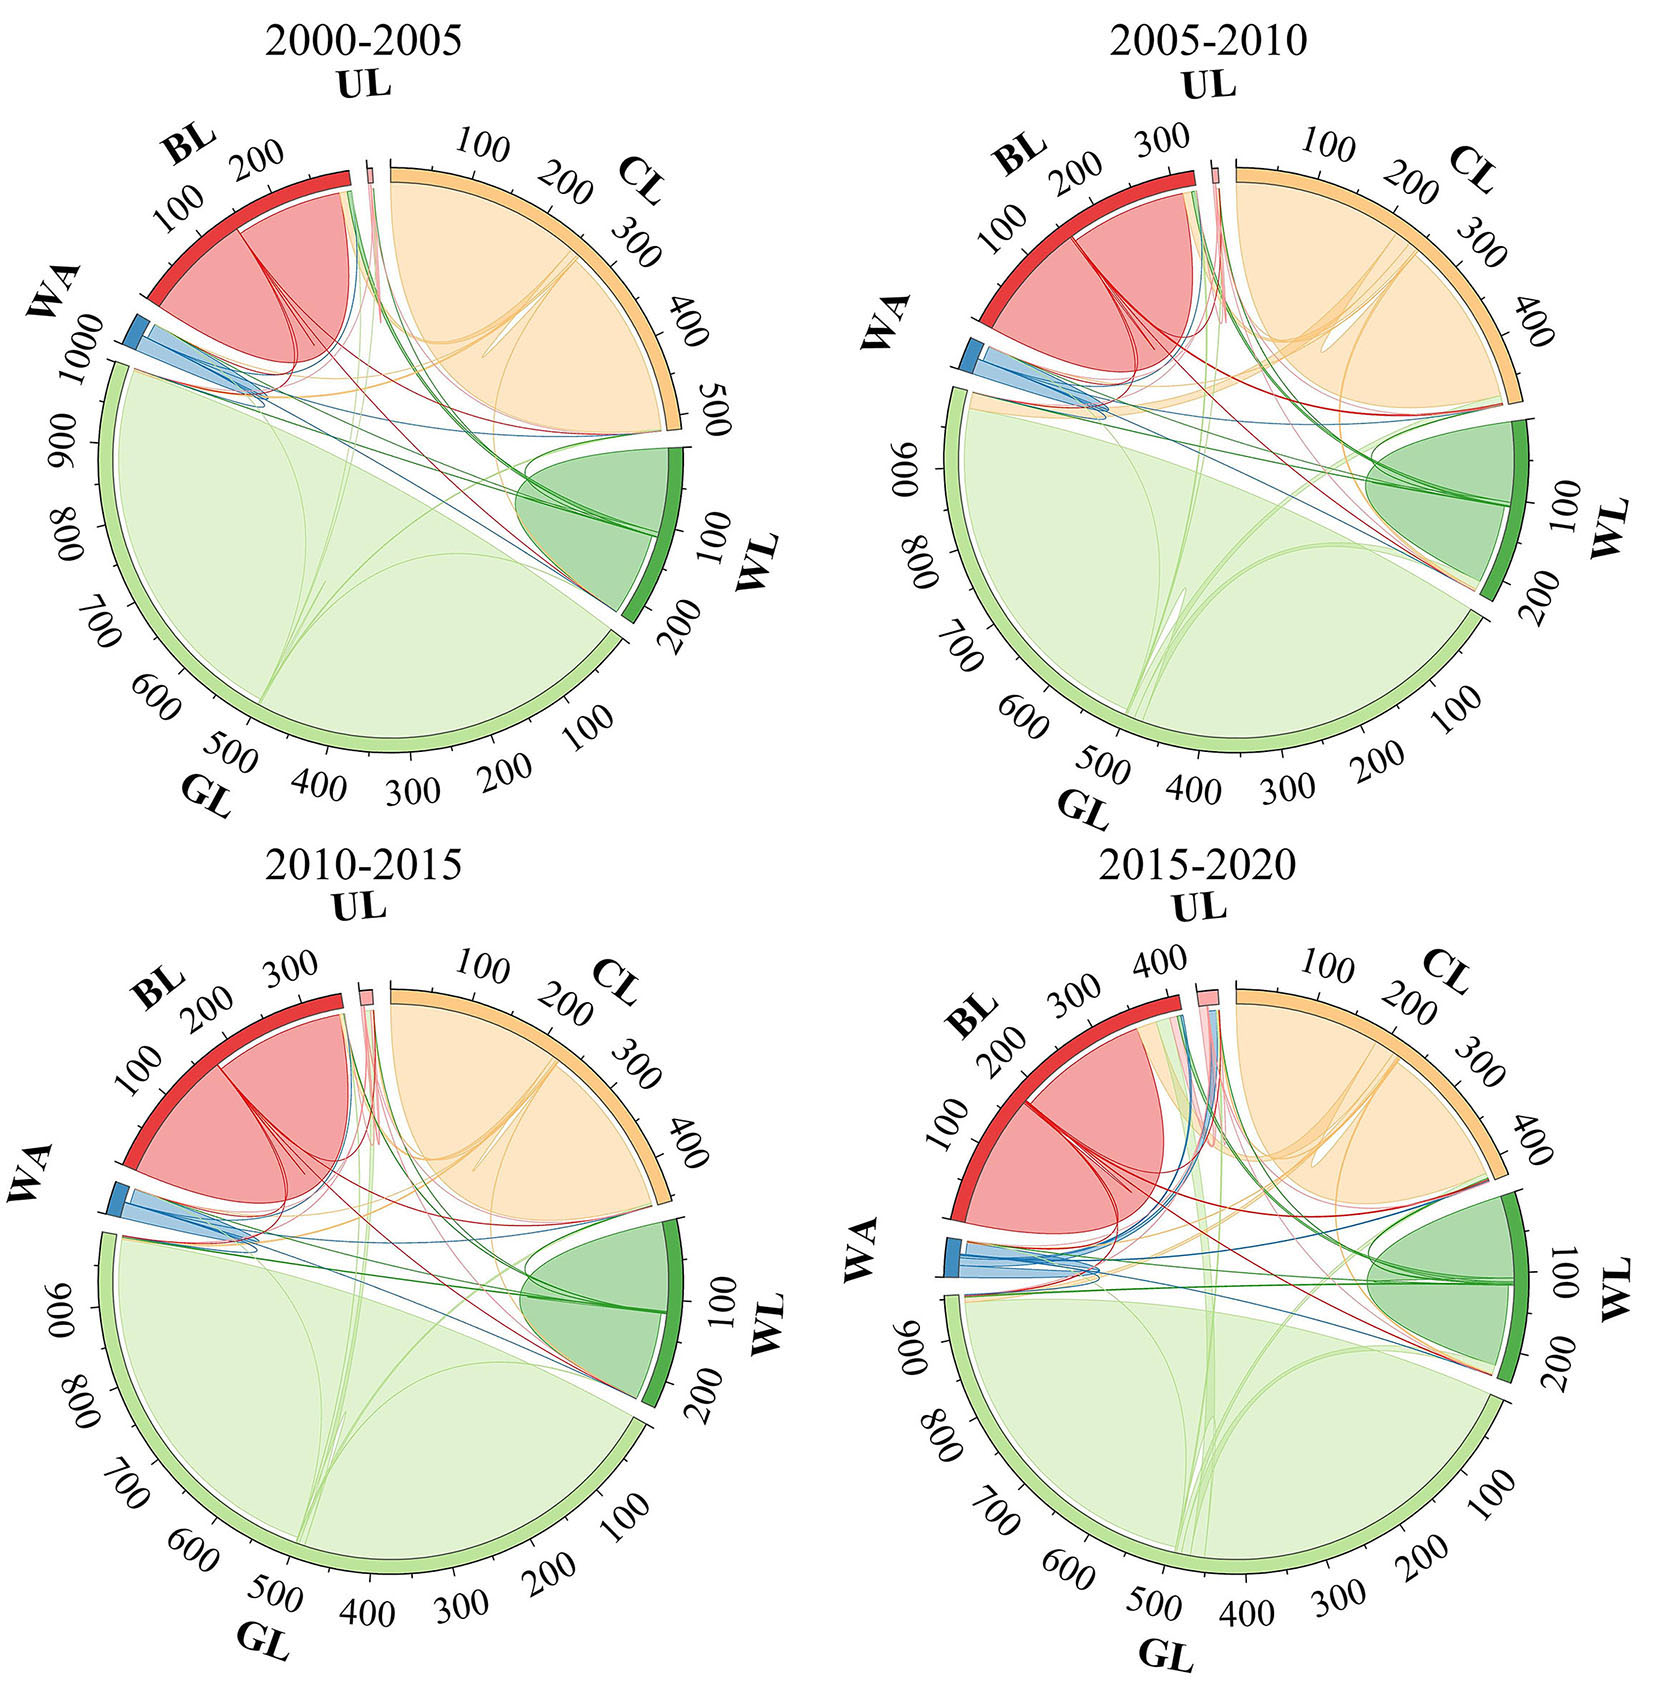
Figure 3. Land use transfer matrix chord chart, 2000-2020. Note: CL, WL, GL, WA, BL, and UL represent Cropland, Woodland, Grassland, Water area, Built-up land, and Unexploited land, respectively.


