



fig3
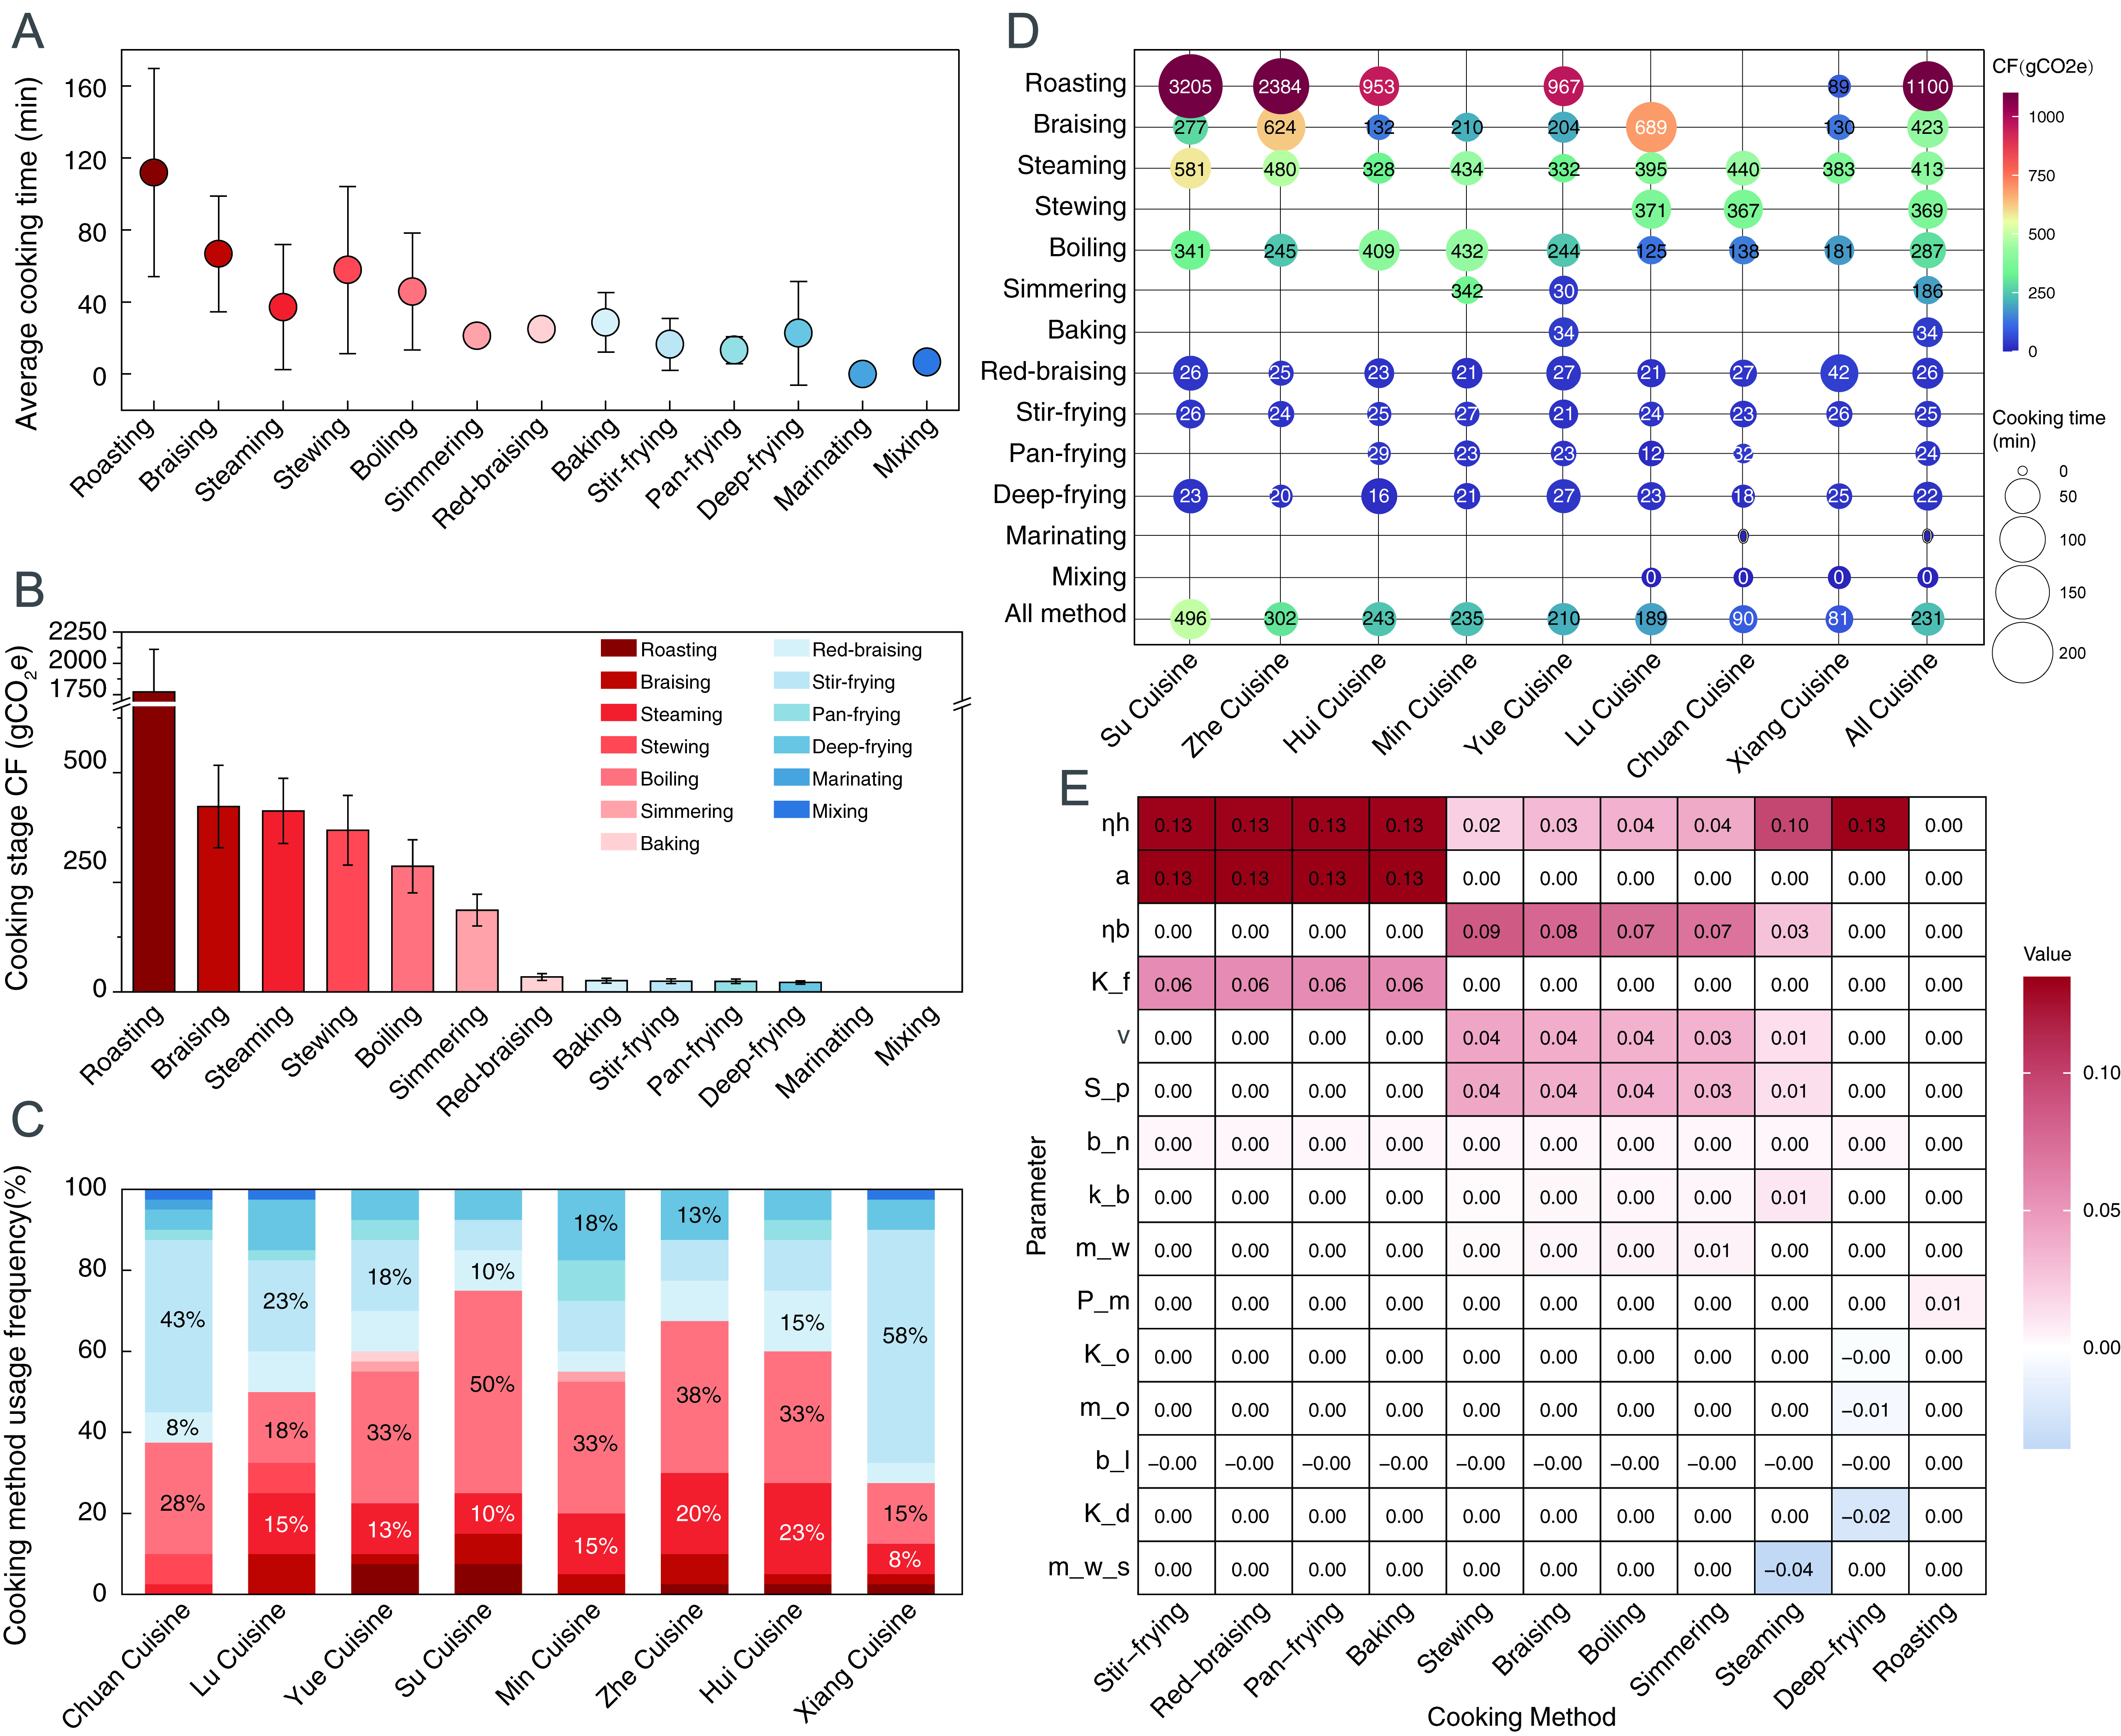
Figure 3. Carbon footprint, cooking times, and usage frequency of 13 cooking methods in Chinese eight cuisines. (A) Average cooking time, error bars represent the standard deviation (SD) of cooking time; (B) Average carbon footprint for various cooking methods, error bars represent the 95%CI of the carbon footprint; (C) Usage frequency of cooking methods in Chinese eight cuisines; (D) Average cooking time and carbon footprint of Chinese eight cuisines; (E) Sensitivity ratios of key parameters across 13 cooking methods.





