


fig3
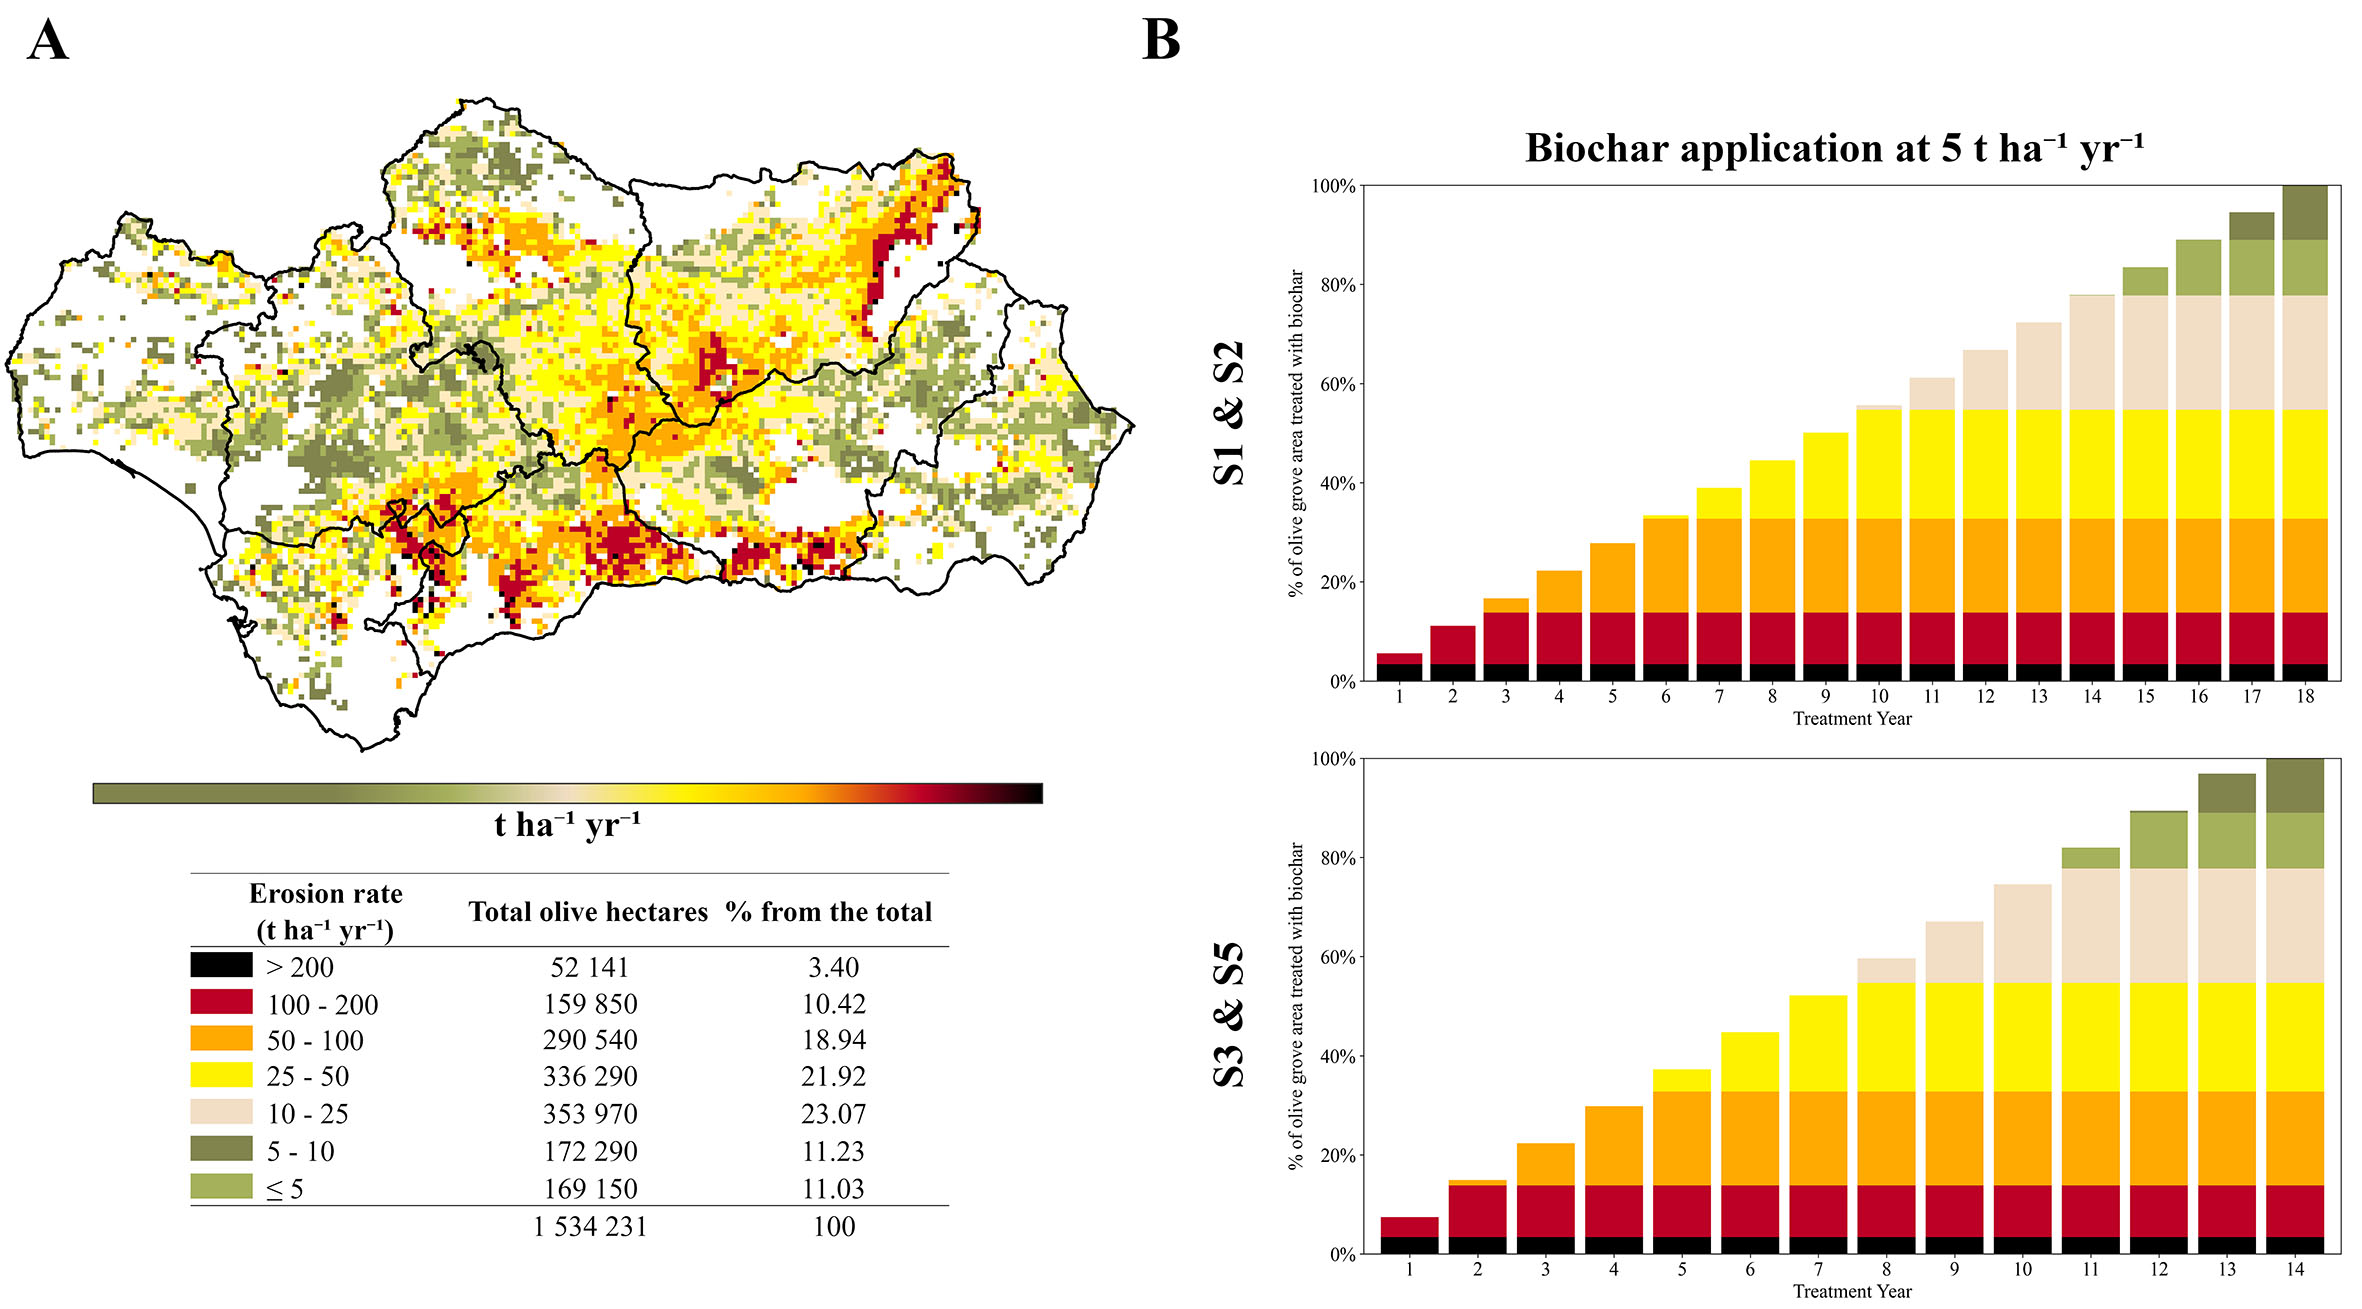
Figure 3. Spatial distribution of soil erosion rates in olive groves in Andalusia and area treated with biochar. (A) shows the spatial distribution of soil erosion rates across Andalusian olive groves, mapped using ArcGIS Pro based on data from[13]. The table indicating the total area for each erosion category in tonne of soil loss per hectare per year (t ha-1 year-1). (B) illustrates the cumulative percentage of olive grove area treated over time for scenarios S1 and S2 on the top (only exhausted olive pomace as feedstock), and scenarios S3 and S5 on the bottom (exhausted olive pomace and olive pruning as feedstock), assuming an application rate of 5 t·ha-1.


