

fig10
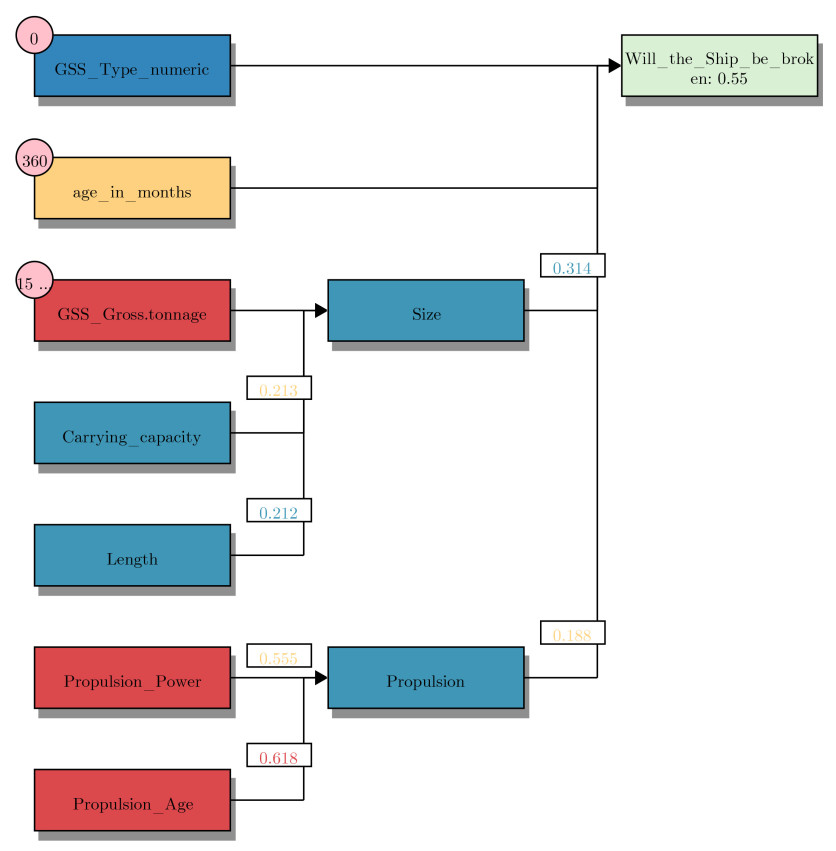
Figure 10. HFRBM decision visualization for data instance 44 without input layer. The input blocks are colored based on which input membership function is activated the most (low, medium or high), and the pink bubbles on the input blocks contain the actual feature value. The numbers exiting those input blocks represent the output value of the FRBM, and are colored based on which input membership function is activated in the next FRBM. These colors correspond to the color scale as seen in Figure 8B. The final output block is colored green if the prediction is correct, and red if the HFRBM prediction is incorrect. The darker the color, the more extreme the score is toward one of the two classes.


