



Implementation of deep learning-based gauze detection in pancreatic laparoscopic and robotic surgery: an exploratory multicenter evaluation
 0
Abstract
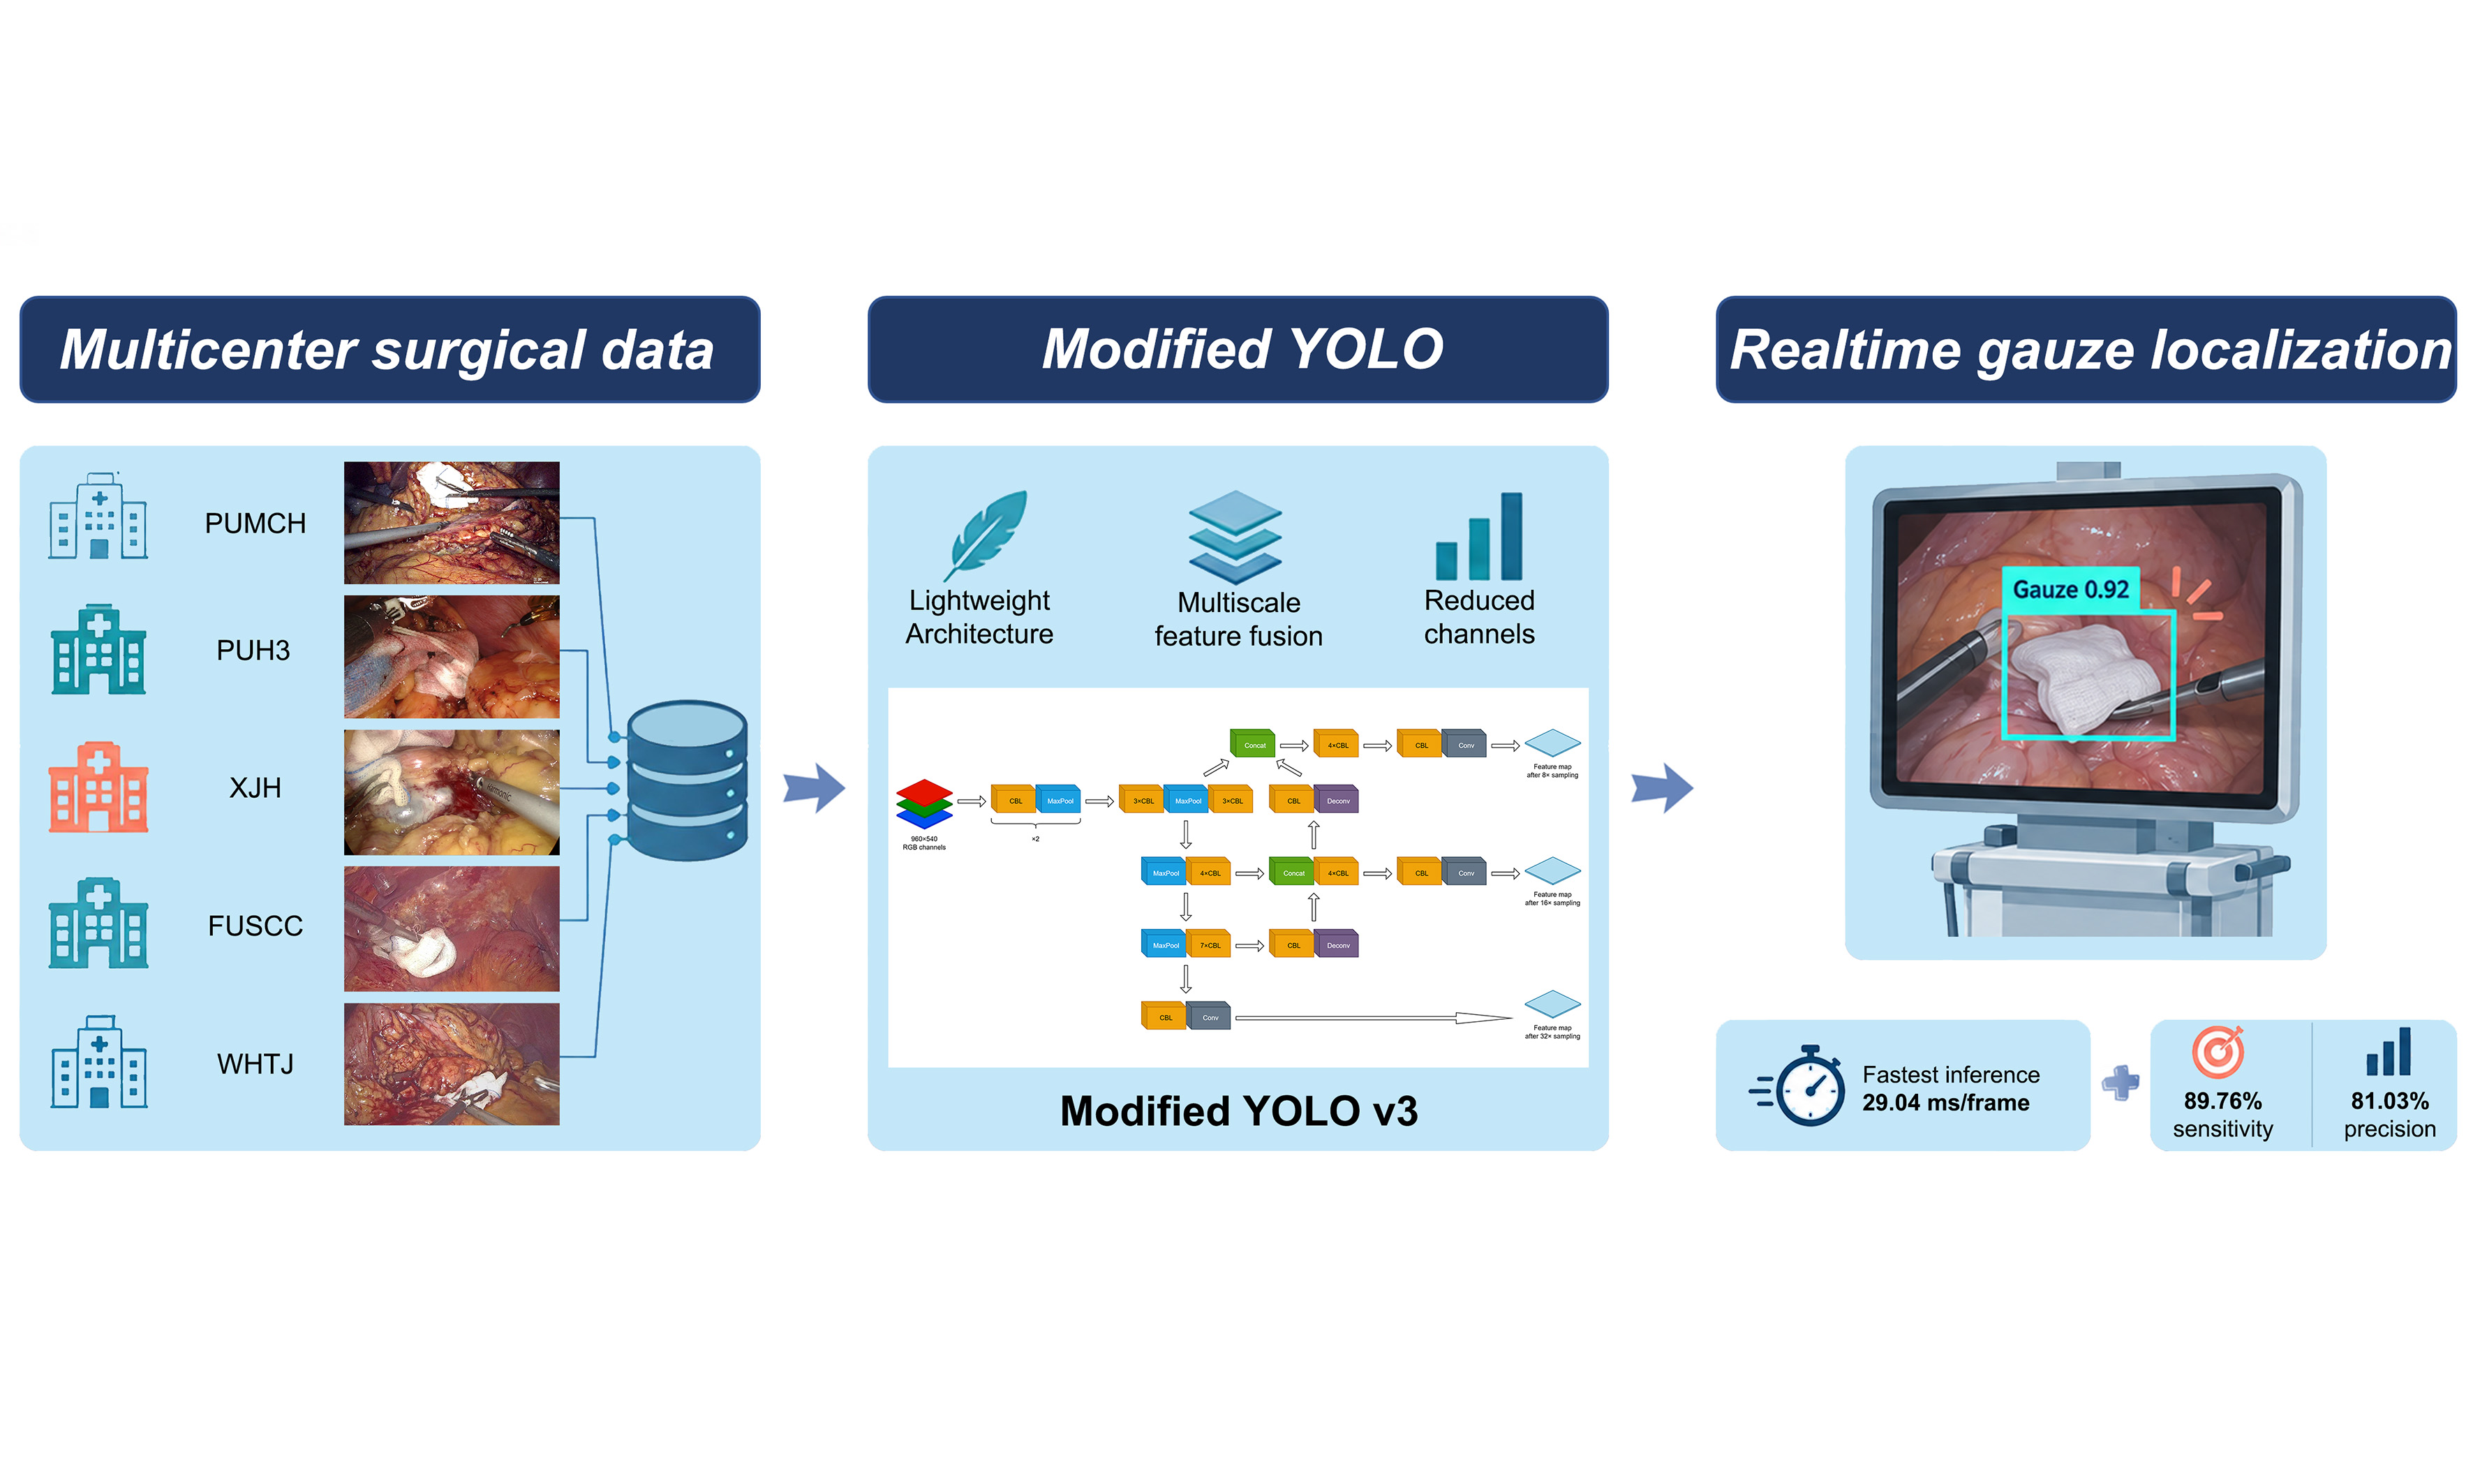
Aim: Retained gauze is a serious complication in laparoscopic and robotic surgery. Deep learning has been applied to target detection of surgical instruments, but research on gauze detection remains scarce. This study aimed to develop a deep learning algorithm for gauze detection in pancreatic surgery using a large multicenter dataset and to assess cross-center performance variation and the effect of incorporating data from multiple clinical centers.
Methods: We collected 581 videos comprising 296,127 frames from five clinical centers. A modified You Only Look Once-v3 (YOLOv3) model was designed for detection. A baseline model was trained using data from a single center, after which data from additional centers were sequentially incorporated to test cross-center performance and determine optimal data volume. Real-time testing was subsequently conducted during laparoscopic surgeries.
Results: In the test set combining different centers, the baseline model exhibited a sensitivity rate (SR) of 84.70% and a precision rate (PR) of 79.58%. Incorporating data from multiple centers improved the SR and PR to 89.76% and 81.03%, respectively. Data volume experiments revealed that the improvement in sensitivity became less pronounced after 25,000 images. The model achieved a computation speed of 29.04 ms per frame, facilitating effective real-time application without surgical delay.
Conclusion: The developed model achieved efficient surgical gauze detection and enabled real-time gauze tracing in clinical settings. Incorporating data from multiple centers was associated with improved performance on the corresponding evaluated test sets, supporting the feasibility of multicenter training and exploratory cross-center evaluation.
Keywords
INTRODUCTION
Laparoscopic surgery, which is associated with smaller incisions, a lower risk of postoperative infection, and faster recovery, has been widely adopted in surgical practice[1]. Minimally invasive surgery is also gaining intensive attention in the field of pancreatic diseases[2,3]. Gauze is frequently employed for hemostasis in laparoscopic pancreatic surgeries. However, its entrapment in less visible areas, such as between intestines or within tissue gaps, can pose challenges in locating it promptly. This difficulty may extend the duration of surgery and anesthesia, potentially resulting in serious consequences, including foreign body reactions, infections, abscesses, or even pseudotumors[4]. Such complications put patients at risk of requiring additional surgeries[5]. To mitigate this challenge, one approach involves incorporating a metal strip within the gauze for intraoperative X-ray detection when locating the gauze proves challenging. However, this method can only provide an approximate location of the gauze. Another strategy involves using brightly colored pigments on the gauze strips, but these pigments often darken and become challenging to detect after being saturated with blood. Consequently, there is a pressing need for an improved method to aid surgeons in precisely locating gauze during surgery.
Artificial intelligence (AI) has recently achieved significant success not only in areas such as facial recognition and autonomous driving[6,7], but also in the field of medicine, including ultrasound, magnetic resonance imaging (MRI), computed tomography (CT), positron emission tomography (PET), and more[8-10]. In the surgical domain, research in this field has also been steadily expanding, encompassing areas such as object detection and segmentation, workflow prediction, and skill assessment[11-15]. These endeavors are directed towards augmenting the intelligence and efficiency of surgical procedures. While deep learning has been successfully applied to target detection of surgical instruments, research on gauze detection remains scarce.
Moreover, existing studies on instrument detection have predominantly utilized single-center or single-scene datasets, characterized by data volumes spanning from thousands to tens of thousands of images and exhibiting relatively low scene complexity. This scenario has the potential to introduce biases in model generalization. Our team has previously proposed a gauze detection algorithm based on the You Only Look Once (YOLO) algorithm using data from a single center[16]. Based on data from multiple centers, we successfully constructed a model to detect the positions of gauze. The performance of the model across test sets from different clinical centers was assessed, and the effect of incorporating additional center-specific training data was explored. Initial clinical application demonstrated feasibility. The model’s actual clinical benefits require further exploration.
METHODS
Study design and data collection
This is a multicenter study with two phases. During the first observational phase conducted from February, 2023 to February, 2024, models were trained using retrospectively collected videos. A total of 581 videos of 541 laparoscopic and 40 robotic pancreatic surgeries were collected from five clinical centers (Peking Union Medical College Hospital, PUMCH; Peking University Third Hospital, PUH3; the Xijing Hospital of the Fourth Military Medical University, XJH; Fudan University Shanghai Cancer Center, FUSCC; and Tongji Hospital, WHTH). The inclusion criteria were as follows: (1) laparoscopic or robotic pancreatic surgery; (2) gauze appearing in the video data for ≥ 3 min. Exclusion criteria included: (1) any missing fragment in videos; (2) conversion to open surgery or termination of surgery for any reason. During the second interventional phase conducted from March, 2024 to May, 2024, after the model was developed, we initiated an exploratory clinical application in the surgical rooms of PUMCH and XJH. Five patients were included in each center. Three video clips were collected for each patient, generating 4,832 images for PUMCH and 4,672 images for XJH. Data of XJH generated during this process was used as an independent real-patient test set [Supplementary Table 1].
Video annotation and dataset division
During an early pilot exploration, we evaluated sampling one frame every 24 frames to assess frame redundancy and annotation workload. This exploratory sampling strategy was discontinued at an early stage and was not used for construction of the final dataset or for model training and evaluation. For the final dataset, one frame was sampled every four frames from the selected video segments. The same sampling strategy was applied consistently across the datasets used for model development and evaluation.
Each selected frame was independently annotated by two annotators according to the same annotation protocol. The smallest rectangle that can encompass the target gauze was labeled. Four annotators with at least one year of surgical training participated in the annotation process. The annotations were subsequently reviewed by a senior surgeon with extensive experience in pancreatic surgery. Discrepant or ambiguous annotations were re-examined and resolved under the supervision of the senior surgeon before inclusion in the final dataset. The annotated images were divided into training and test sets separately for each clinical center on a patient level. To prevent information leakage, all frames extracted from the same surgical video were assigned exclusively to either the training or test set. When multiple videos were available from the same patient, all videos from that patient were assigned to the same partition. The allocation was performed before frame extraction. The final numbers of training and test images were as follows: PUMCH, 160,390 and 15,071; XJH, 43,734 and 4,545; WHTH, 20,474 and 5,255; FUSCC, 15,648 and 5,575; and PUH3, 20,162 and 5,273, respectively. The center-specific allocation of images is summarized in Table 1. No test images were used for model training.
Distribution of datasets
| Data source | Videos | Images | Images in training set# | Images in test set |
| PUMCH | 153 | 175,461 | 160,390 | 15,071 |
| XJH* | 157 | 48,279 | 43,734 | 4,545 |
| WHTH | 97 | 25,729 | 20,474 | 5,255 |
| FUSCC | 90 | 21,223 | 15,648 | 5,575 |
| PUH3 | 84 | 25,435 | 20,162 | 5,273 |
| Total | 581 | 296,127 | 260,408 | 35,719 |
Neural network model construction
We developed a lightweight modified detector based on the YOLOv3 framework [Figure 1]. The backbone extracted features at three spatial scales, corresponding to feature-map strides of 32, 16, and 8. These feature maps were subsequently processed by a YOLOv3 neck and detection head to support multiscale gauze detection. Three modifications were introduced during model development. First, deconvolution was used to enlarge feature maps and facilitate feature fusion across different scales. Second, max-pooling was used to reduce computational cost. Third, channel pruning was performed after completion of model training to decrease the number of parameters and computational complexity. We used an AutoML-based pruning scheme in which a reinforcement-learning algorithm automatically searched for the pruning ratio of each network layer. The performance-difference threshold between the pruned model and the original trained model was set at 1%. These modifications were selected a priori with the practical design objective of reducing computational burden and facilitating real-time deployment while retaining the multiscale detection capability of the YOLOv3 framework.
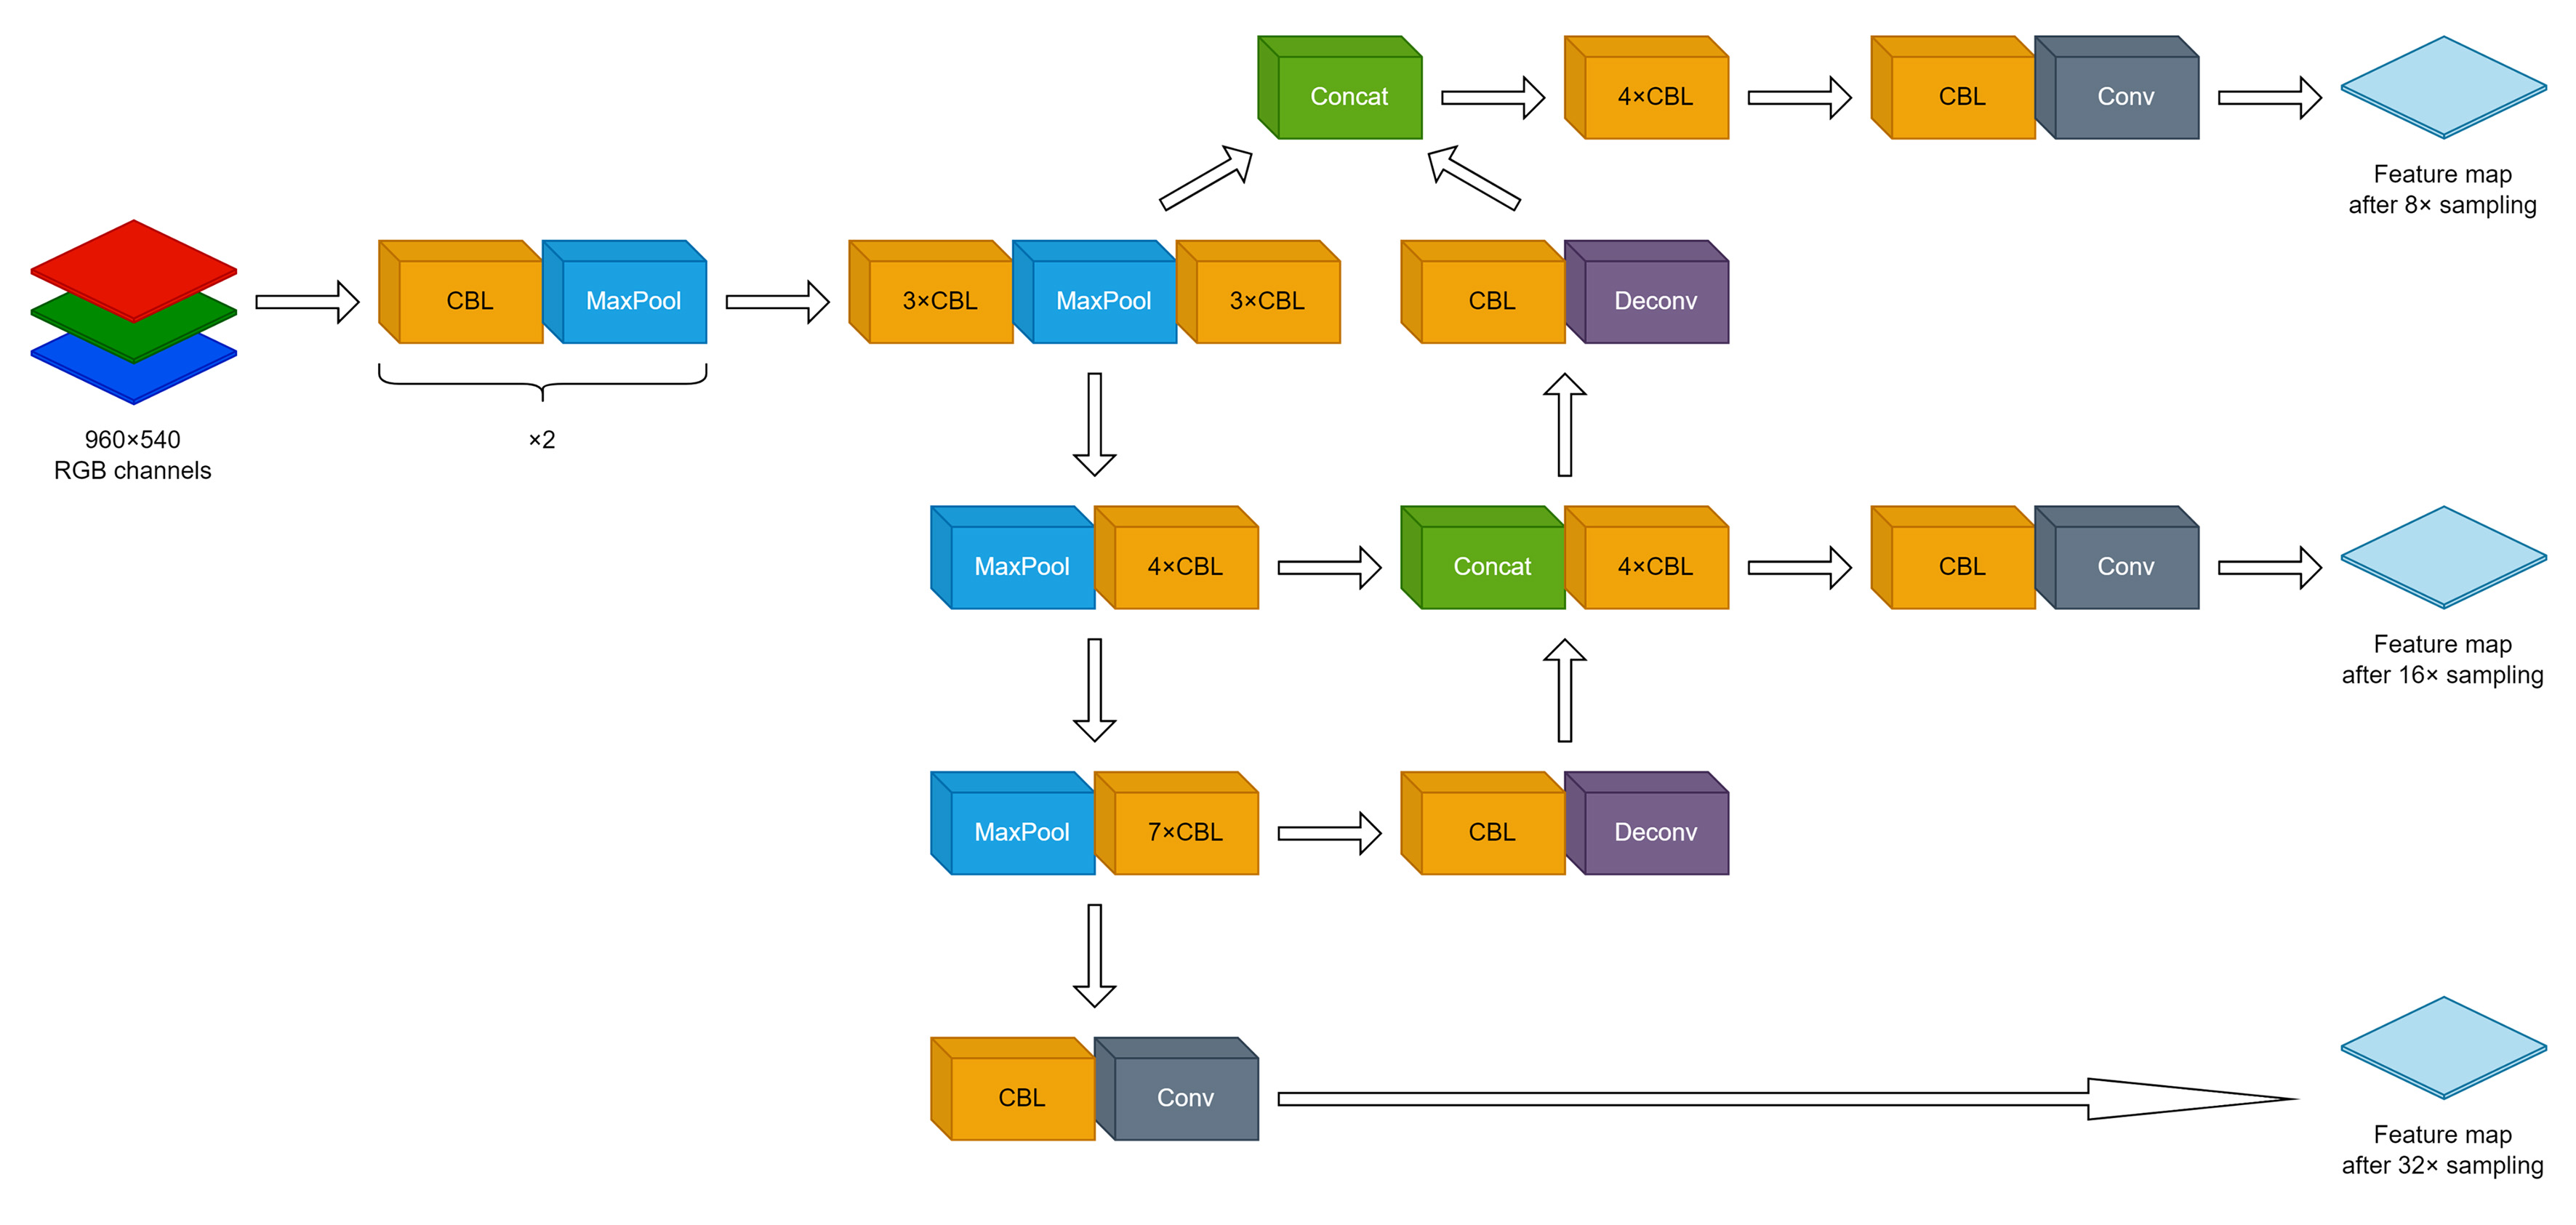
Figure 1. Schematic diagram of the neural network applied. The network was modified based on the YOLOv3 model, and the image was scaled and adjusted to 960 × 540 and input in the form of RGB three channels. CBL was the image feature extraction module, using max-pooling for downsampling and deconvolution to upsample the image after 4 times of downsampling. The feature maps corresponding to the layers were concatenated with the upsampled feature maps (Concat). Finally, the feature maps obtained after 32 times sampling, 16 times sampling, and 8 times sampling were input into the YOLO-Network as the anchor to generate anchor matching and generate the final prediction frame. This figure was created using DrawIO. CBL: Convolution+Batch normalization+Leaky-Relu; Conv: Convolution; Deconv: Deconvolution; RGB: red-green-blue.
The backbone provided feature outputs with channel dimensions of 1024, 512, and 256 at strides of 32, 16, and 8, respectively. These features were processed by the neck, producing corresponding output channel dimensions of 512, 256, and 128. The anchor generator used three groups of anchor sizes corresponding to the three detection scales: (116, 90), (156, 198), and (373, 326) for the stride-32 feature map; (30, 61), (62, 45), and (59, 119) for the stride-16 feature map; and (10, 13), (16, 30), and (33, 23) for the stride-8 feature map.
The model was trained using stochastic gradient descent with a learning rate of 0.002, momentum of 0.9, and weight decay of 0.0005. The batch size was 16, and the training schedule consisted of a maximum of 100 epochs. No separate validation set was used in this study. The center-specific test sets were separated at the patient and video levels before frame extraction and were not used for model training or checkpoint selection. The final checkpoint was selected as the checkpoint obtained at the end of the prespecified 100-epoch training schedule.
During training, positive and negative samples were assigned using a GridAssigner with positive and negative IoU thresholds of 0.5. During testing, predictions with a confidence score below 0.45 were discarded. Non-maximum suppression (NMS) was then applied using an IoU threshold of 0.3. A maximum of 100 detections was retained per image.
Test and evaluation
The Intersection over Union (IoU) is defined as:
Here, P denotes the predicted bounding box and GT denotes the ground-truth bounding box.
Predictions with a confidence score below 0.45 were discarded. NMS was then applied using an IoU threshold of 0.3. After NMS, each ground-truth box was matched to at most one prediction. A prediction with IoU > 0.3 with an unmatched ground-truth box was counted as a true positive; unmatched predictions were counted as false positives, including residual duplicate predictions; and unmatched ground-truth boxes were counted as false negatives. We selected this threshold because the primary objective of the model was to identify and continuously track the presence and approximate location of surgical gauze during laparoscopic procedures, rather than to achieve highly accurate contour localization. This criterion was predefined before model development and was consistently applied throughout all experiments.
Sensitivity rate (SR) denotes the proportion of ground-truth targets that are correctly detected, whereas precision rate (PR) denotes the proportion of correct predictions among all predictions, which are defined as follows:
False negative rate (FNR) refers to the proportion of positive samples that are not predicted correctly, and false discovery rate (FDR) refers to the proportion of false-positive predictions among all positive predictions. FNR and FDR were calculated by:
The performance of all models generated was tested in test sets from all centers separately and combined.
The in vitro test environment of the model is PyTorch: 1.11-cuda11.3-cudnn8-ubuntu20.04. The environment configurations are: Torch v1.11, MMEngine 0.6.0, MMCV 2.0.0rc4, MMDetection 3.0.0rc6, MMYOLO 0.5.0.
Baseline model generation
The baseline model was constructed first on data of PUMCH. SR, PR, FNR, FDR, and running speed were evaluated.
Data volume experiment
To investigate the appropriate sample size for stabilizing the performance of the model in the same scene, we first collected data from XJH for exploration. The dataset from XJH was generated following the method described in the Section “Video annotation and dataset division”. Starting from the model trained on the base training set, we added 1,000, 5,000, 10,000, 15,000, 20,000, 25,000, 30,000, 35,000, and 40,000 images from XJH to the training set [Table 1]. Changes in sensitivity and precision were then evaluated.
Cross-center performance and incremental multicenter training experiment
Due to differences in surgical style and image characteristics among hospitals, model performance may vary across clinical centers. We therefore used the PUMCH-trained baseline model as the starting point and sequentially incorporated training data from the other four centers to assess cross-center performance variation and the effect of additional center-specific data on sensitivity and precision. For each hospital, approximately 5,000 images were selected as the test set, and the remaining images were selected as the training set. The exact numbers of training and test images used for each center are provided in Table 1 and its footnote. This amount was based on the experimental results of labeling cost and data volume. To optimize computational efficiency, the strategy of adding training set data from XJH, WHTH, FUSCC and PUH3 was adopted. This allowed us to monitor changes in sensitivity and precision between the old model and the new model in the test set after each training iteration.
Ethical approval and consent to participate
The study was performed in accordance with the Declaration of Helsinki. The study was approved by the ethics committees of the participating hospitals: I-23PJ253 (the Institutional Review Board of Peking Union Medical College Hospital, which reviewed the conduction of the study in all centers) & I-23PJ343 (the Institutional Review Board of Peking Union Medical College Hospital, which reviewed the conduction of the study at PUMCH); IRB00006761-M2023135 (Peking University Third Hospital Medical Science Research Ethics Committee); KY20232167-F-1 (the Medical Ethics Committee of the First Affiliated Hospital of the Air Force Medical University); 2303272-6 (Shanghai Cancer Center Institutional Review Board); TJ-IRB20230420 (Institutional Review Board, Tongji Hospital, Tongji Medical College, Huazhong University of Science and Technology). At PUH3, FUSCC and WHTH, informed consent was waived as surgical videos were collected only retrospectively with no identifiable information included. At PUMCH and XJH, written informed consent was obtained from each participant before the collection of intraoperative videos, intraoperative photographs, and medical-record data. For the retrospective observational phase, an institutional consent form that authorized the collection and use of these materials for clinical teaching and medical research, with appropriate protection of personal privacy, was used. The consent form was an institutional broad informed consent document and was not specific to the present manuscript. For the interventional phase, an additional informed consent was obtained from all participants to inform them of the details of the study.
RESULTS
Data description
581 videos with a total of 296,127 frames of images were labeled [Table 1]. Among the different clinical centers, PUMCH and XJH were included in the data volume experiment, whereas all centers were included in the generalization experiment.
Performance of the model trained by baseline dataset
The model trained by the baseline dataset had satisfactory results of detecting gauze under different situations including image blur, irregular shape, and blood immersion [Figure 2]. The baseline model, trained using the PUMCH training set, achieved an SR of 87.46% and a PR of 88.28% on the PUMCH test set. When evaluated on the combined test set from all five centers, the corresponding SR and PR were 84.70% and 79.58%, respectively [Table 2]. The inference time was 29.04 ms per frame.
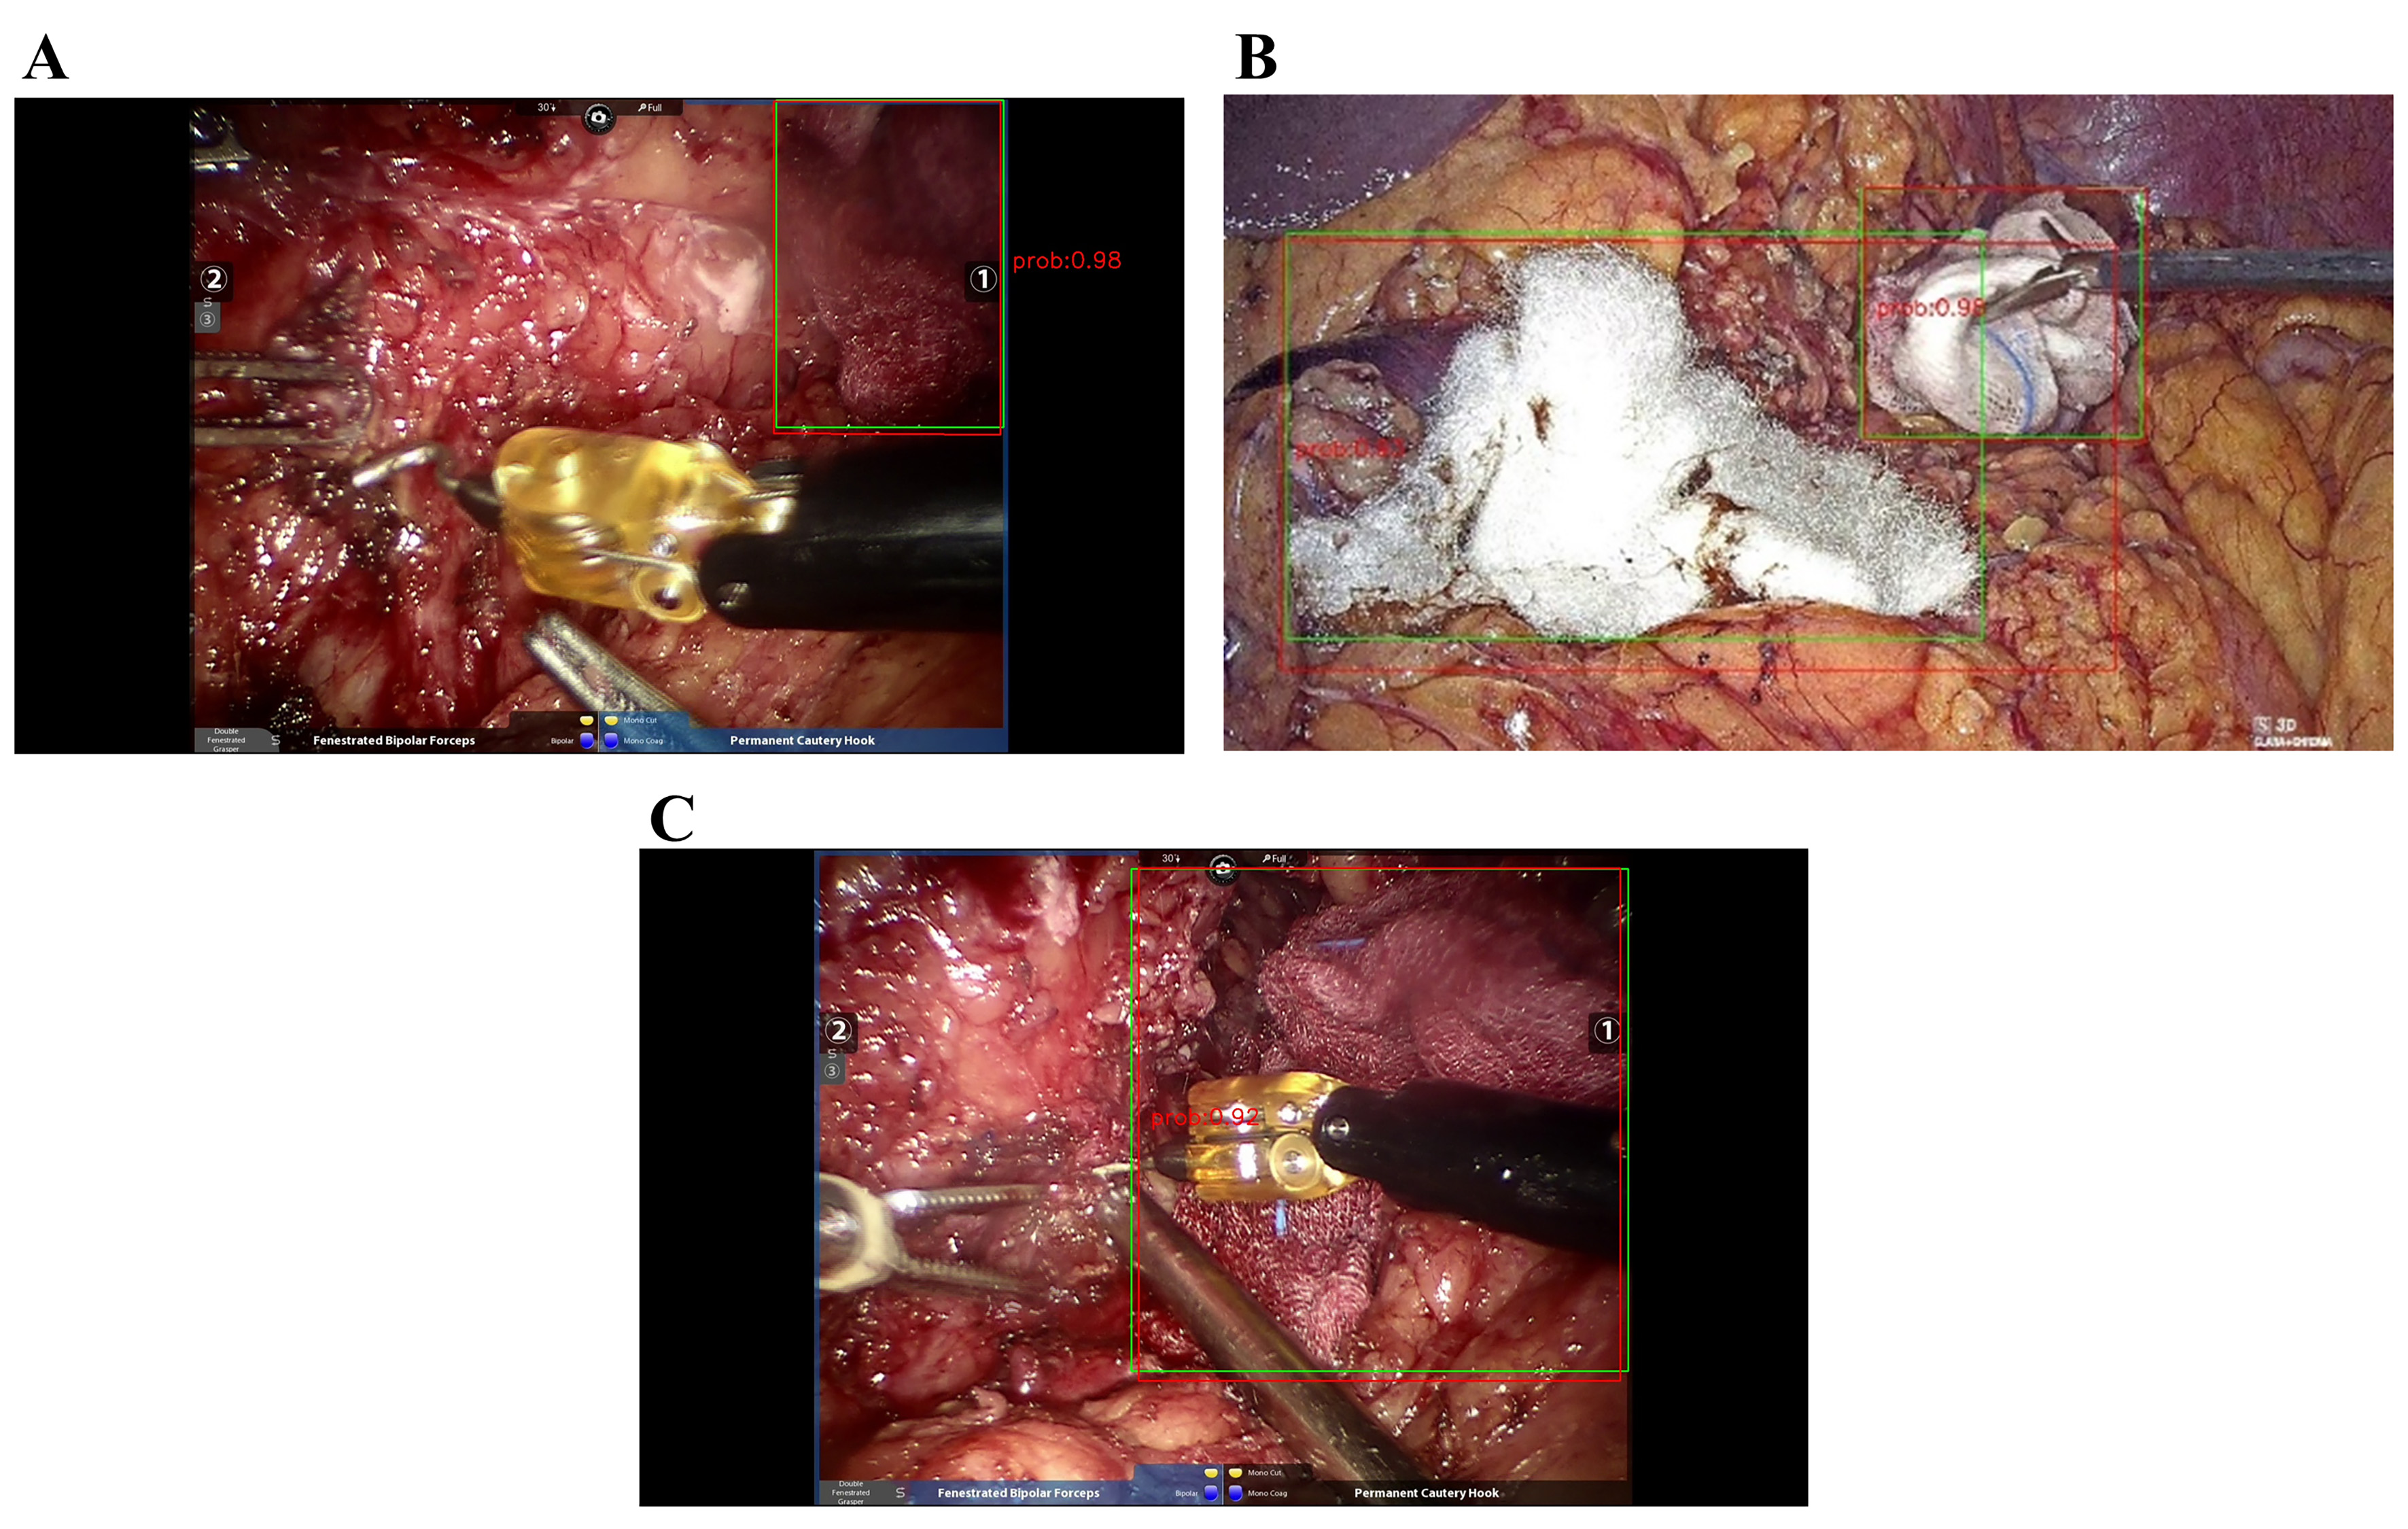
Figure 2. Samples of input and output at different situations. At baseline, the model demonstrated satisfactory results at different situations which included but were not limited to: (A) Blurry image, (B) folded gauze forming an irregular shape and (C) blood immersion of gauze. The green box indicates ground truth and the red box indicates the prediction output.
Sensitivity rate and precision rate of the model trained by different datasets
| Test set | Model 1 | Model 2 | Model 3 | Model 4 | Model 5 |
| PUMCH | |||||
| Sensitivity | 87.46% | 88.06% | 87.34% | 87.51% | 87.50% |
| Precision | 88.28% | 88.66% | 89.41% | 88.83% | 88.96% |
| XJH | |||||
| Sensitivity | 83.30% | 88.20% | 87.39% | 87.72% | 87.87% |
| Precision | 68.79% | 68.08% | 71.64% | 71.33% | 72.51% |
| WHTH | |||||
| Sensitivity | 85.50% | 88.78% | 91.09% | 90.44% | 90.97% |
| Precision | 77.26% | 76.71% | 80.65% | 80.68% | 80.67% |
| FUSCC | |||||
| Sensitivity | 88.28% | 90.02% | 91.16% | 93.31% | 93.31% |
| Precision | 76.34% | 76.25% | 77.58% | 79.49% | 79.26% |
| PUH3 | |||||
| Sensitivity | 75.17% | 83.84% | 84.99% | 86.66% | 92.10% |
| Precision | 78.83% | 73.13% | 78.21% | 77.82% | 76.21% |
| Total | |||||
| Sensitivity | 84.70% | 87.86% | 88.27% | 88.81% | 89.76% |
| Precision | 79.58% | 78.40% | 81.13% | 81.12% | 81.03% |
Results of data volume experiment
In order to explore the robustness of our model across different datasets, we first directly applied our baseline model to the XJH test set. The SR and PR of the baseline model in the XJH test set were 83.30% and 68.79%, respectively, both of which were lower than the corresponding values on the PUMCH test set [Table 2]. We attempted to enhance the performance of the model on the XJH test set by sequentially adding 0 to 40,000 images from the XJH training set into our training sequence, and SR of the model on the XJH test set increased by 7.31 percentage points with the addition of data, whereas PR varied within a relatively narrow range [Table 3]. In addition, adding more XJH images did not adversely affect model performance on the PUMCH test set [Table 3]. However, the increase in sensitivity was not consistently accompanied by an increase in precision. In particular, on the XJH test set, sensitivity increased to 90.61% after additional XJH training data were incorporated, whereas precision remained approximately 68%-70%. Still, solely enlarging the training set could not improve model performance indefinitely. There was a slowdown in the growth of SR after 25,000 images from the XJH training set were added [Figure 3].
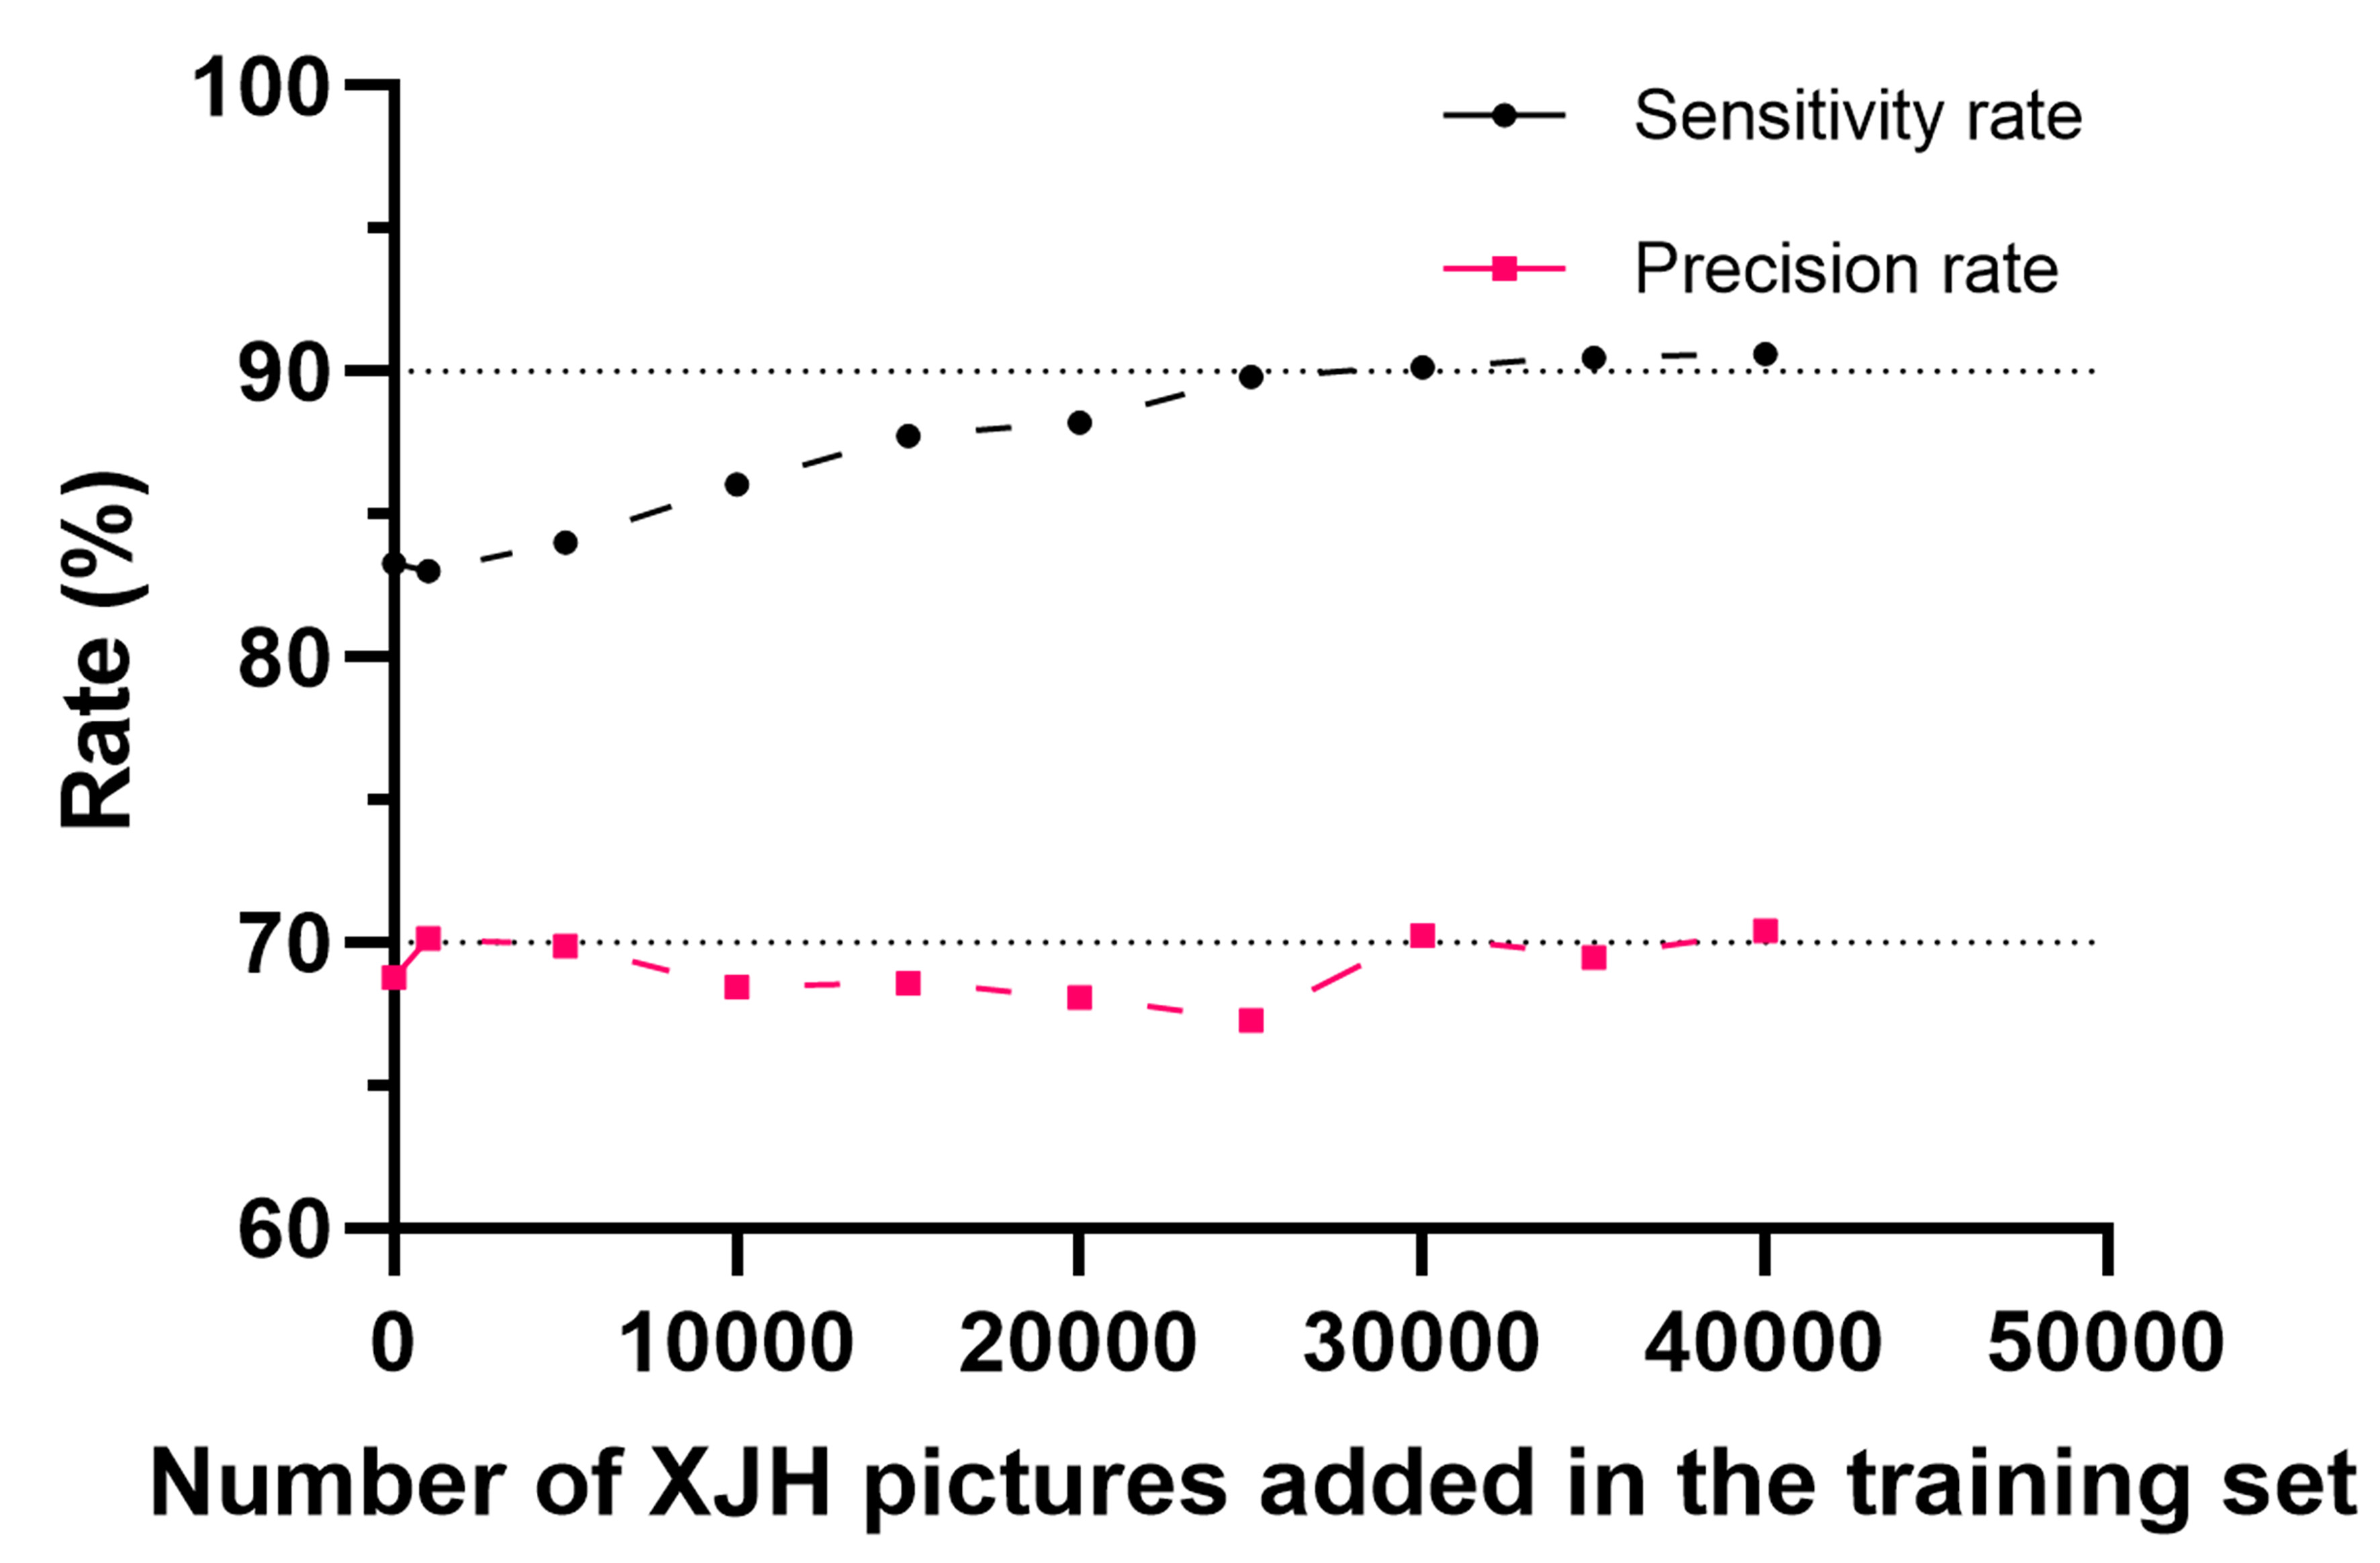
Figure 3. Relationship between the number of additional XJH training images and model performance on the XJH test set. This figure was created using GraphPad Prism 9.4.0. XJH: The Xijing Hospital of The Fourth Military Medical University.
Fluctuation of sensitivity and precision rate with XJH training set supplement
| PUMCH training set plus … | XJH test set | PUMCH test set | ||||
| Output* | Sensitivity | Precision | Output | Sensitivity | Precision | |
| 0 XJH images | 7,286 | 83.30% | 68.79% | 14,317 | 87.46% | 88.28% |
| 1,000 XJH images | 7,118 | 83.00% | 70.16% | 13,954 | 86.36% | 89.44% |
| 5,000 XJH images | 7,231 | 84.00% | 69.89% | 14,133 | 87.01% | 88.98% |
| 10,000 XJH images | 7,564 | 86.04% | 68.44% | 14,089 | 86.83% | 89.07% |
| 15,000 XJH images | 7,699 | 87.75% | 68.58% | 14,272 | 87.43% | 88.54% |
| 20,000 XJH images | 7,795 | 88.20% | 68.08% | 14,353 | 88.06% | 88.66% |
| 25,000 XJH images | 8,033 | 89.83% | 67.28% | 14,472 | 88.27% | 88.15% |
| 30,000 XJH images | 7,723 | 90.16% | 70.24% | 14,467 | 88.03% | 87.94% |
| 35,000 XJH images | 7,837 | 90.49% | 69.48% | 14,554 | 88.22% | 87.60% |
| 40,000 XJH images | 7,744 | 90.61% | 70.40% | 14,532 | 88.45% | 87.96% |
Cross-center performance and incremental multicenter training
After demonstrating the beneficial effect of enlarging the training set, we then sought to examine the generalization potential of our model by sequentially adding more clinical centers to the training set. We first evaluated the PUMCH-trained baseline model on independent test sets from the other four clinical centers, none of which contributed training data to Model 1. The sensitivity and precision values varied across centers, indicating differences in model performance under different center-specific data distributions. We then progressively incorporated training data from the additional centers and evaluated the resulting models on the predefined test sets. Addition of center-specific training data generally improved sensitivity on the corresponding test sets, whereas changes in precision were variable [Table 2]. The SR/PR of baseline model on the merged test sets was 84.70%/79.58%. On independent test sets from four hospitals, the sensitivity/precision was 83.30%/68.79%, 85.50%/77.26%, 88.28%/76.34%, and 75.17%/78.83%, respectively. After incorporating the training data from each hospital, the sensitivity/precision on their respective test sets improved by 4.90/-0.71, 5.59/3.39, 5.03/3.15, and 16.93/-2.62 percentage points compared to the baseline model. Sensitivity and precision also improved on the overall test set [Table 2].
Initial clinical application
After completing the above tests, we have initiated an exploratory clinical attempt and used this model in actual patients [Figure 4, Supplementary Table 1 and Supplementary Video 1]. In the preliminary clinical use, the model provided real-time gauze localization without subjectively noticeable delay. Surgeons provided generally positive qualitative feedback.
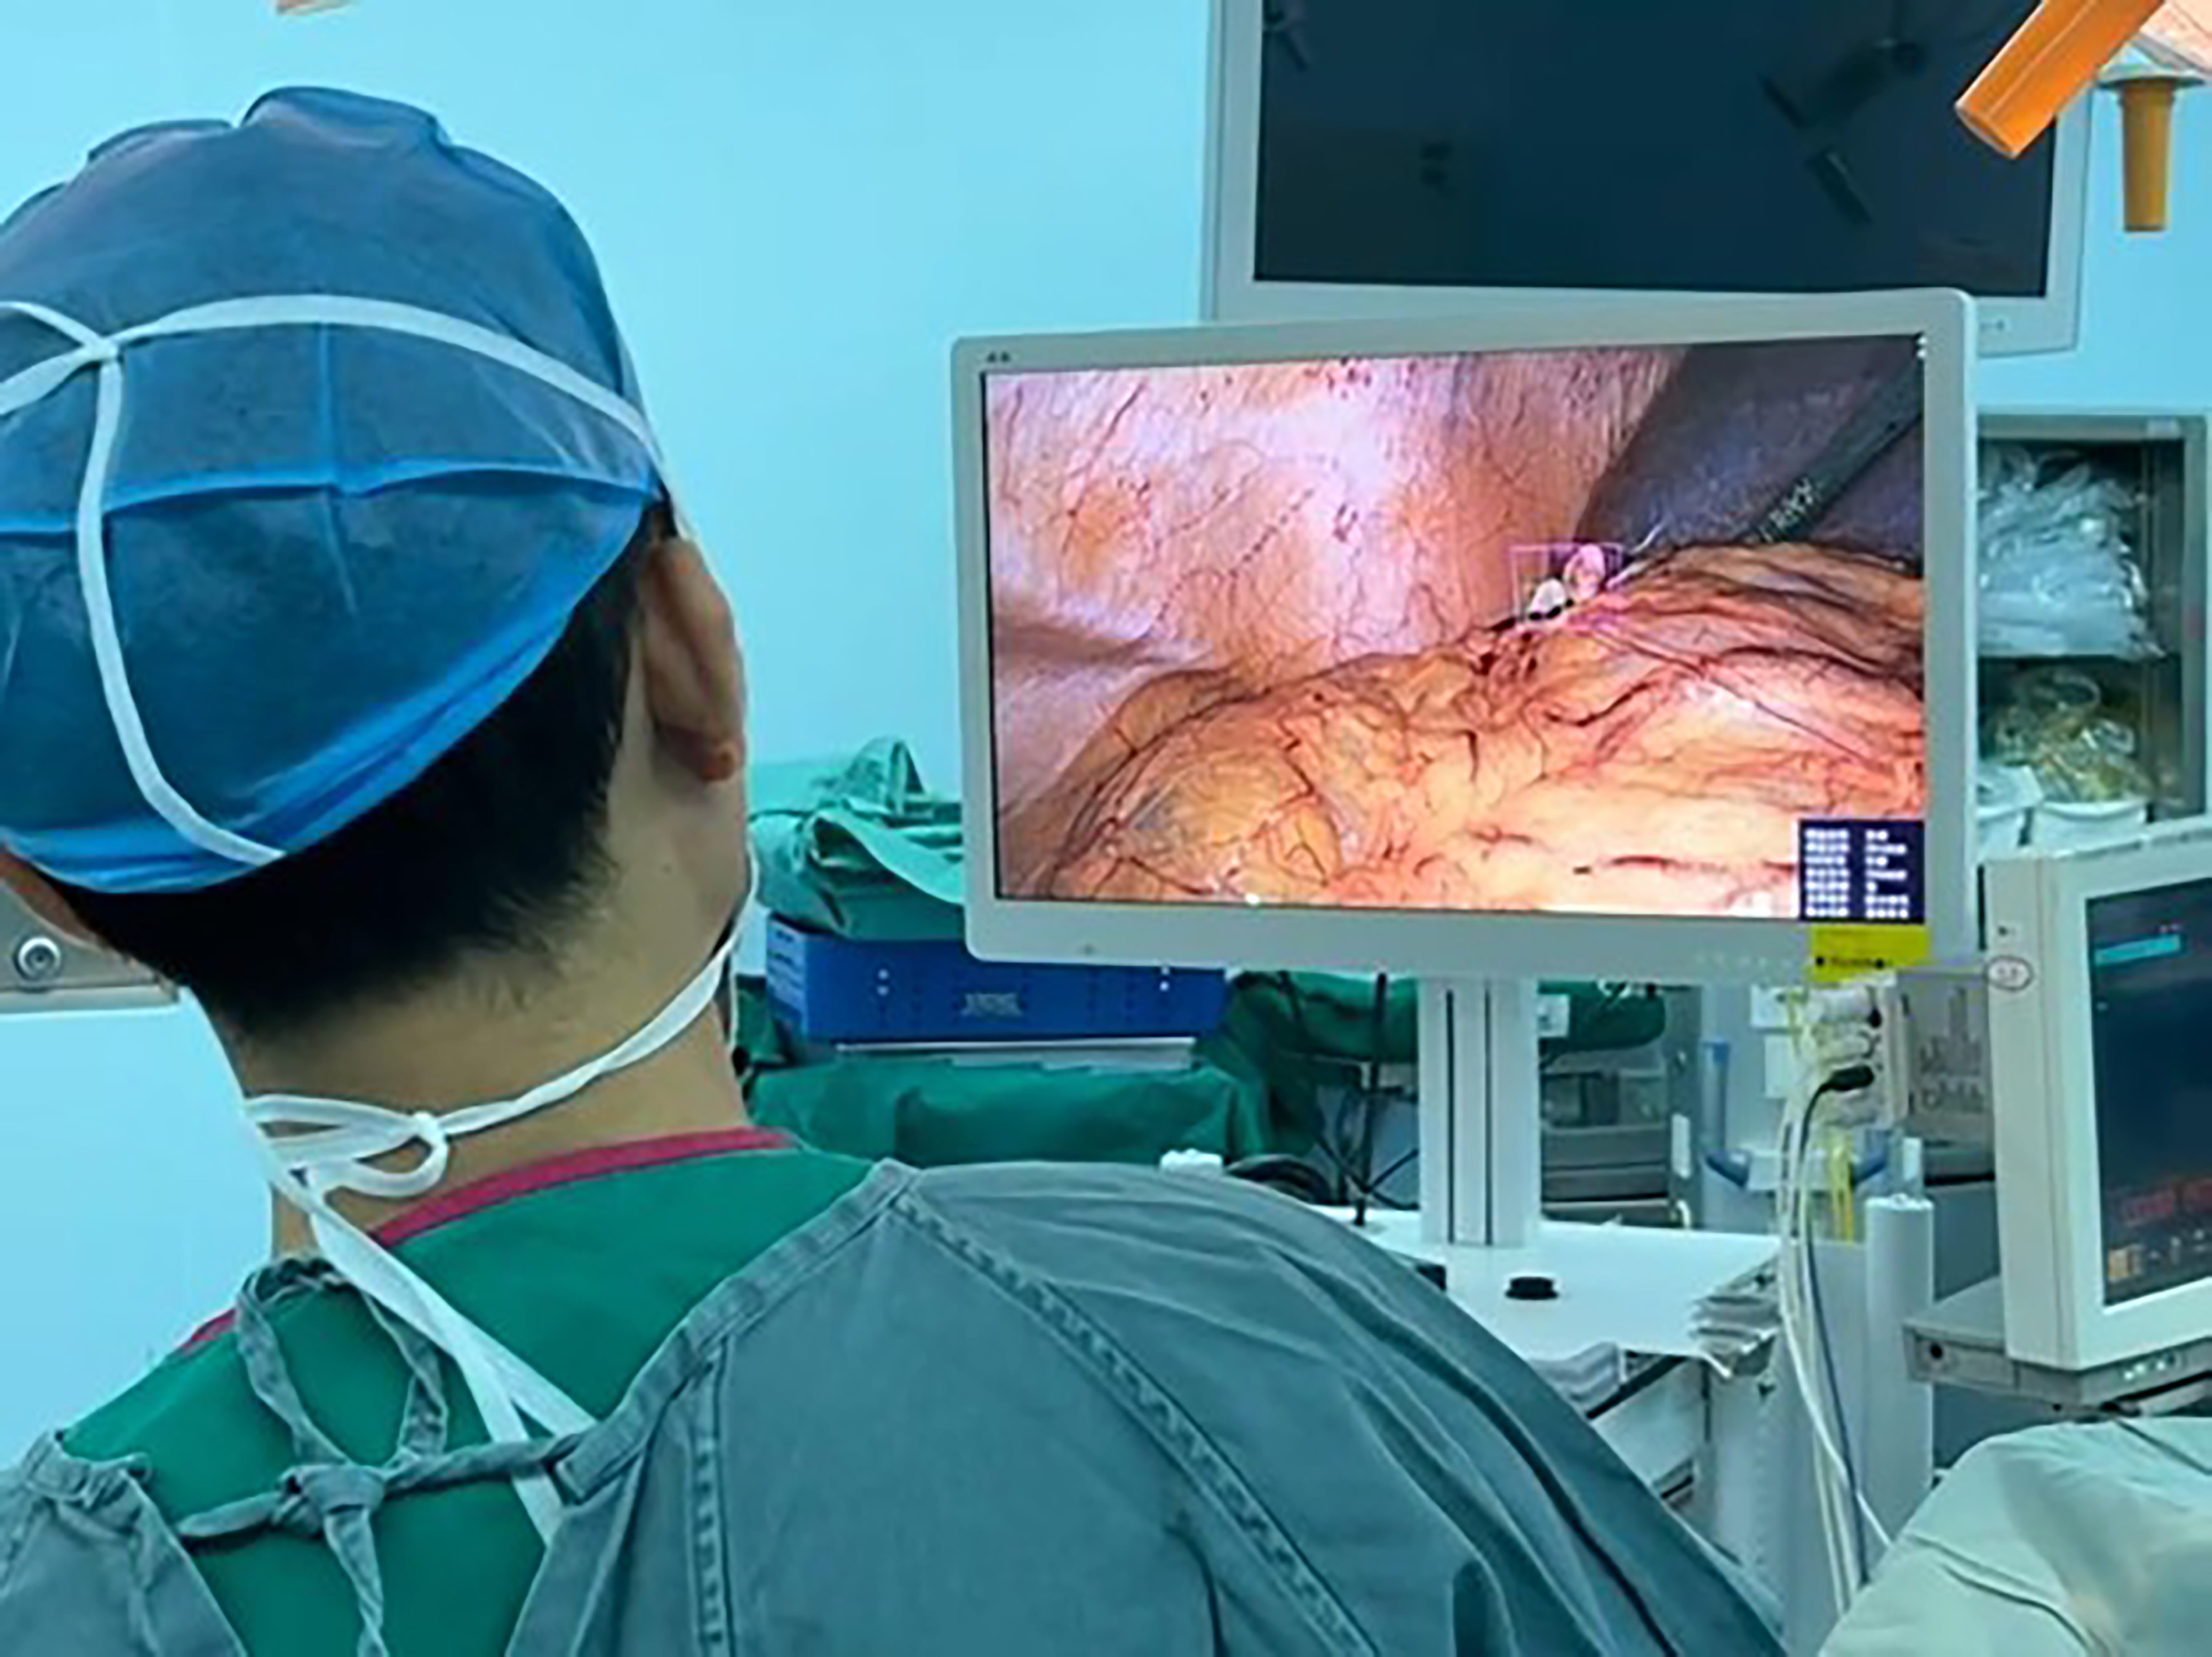
Figure 4. Gauze detection in actual surgical process. The figure was taken in the operation room.
Analyses of false positivity and false negativity
We extracted a part of the images from the total test set for the analyses of missed detection and false detection [Table 4]. We found that, in these images, the reasons for missed detection included: (1) Target objects were blocked by tissues or instruments and only a small part of gauze was exposed [Figure 5A]; (2) Target objects received poor illuminance due to viewing angle problems [Figure 5B]; (3) Target objects were severely soaked in blood and lost part of their texture features [Figure 5C]. The reasons for misdetection include target segmentation [Figure 6A] and misdetection caused by tissues and instruments with similar image features [Figure 6B].
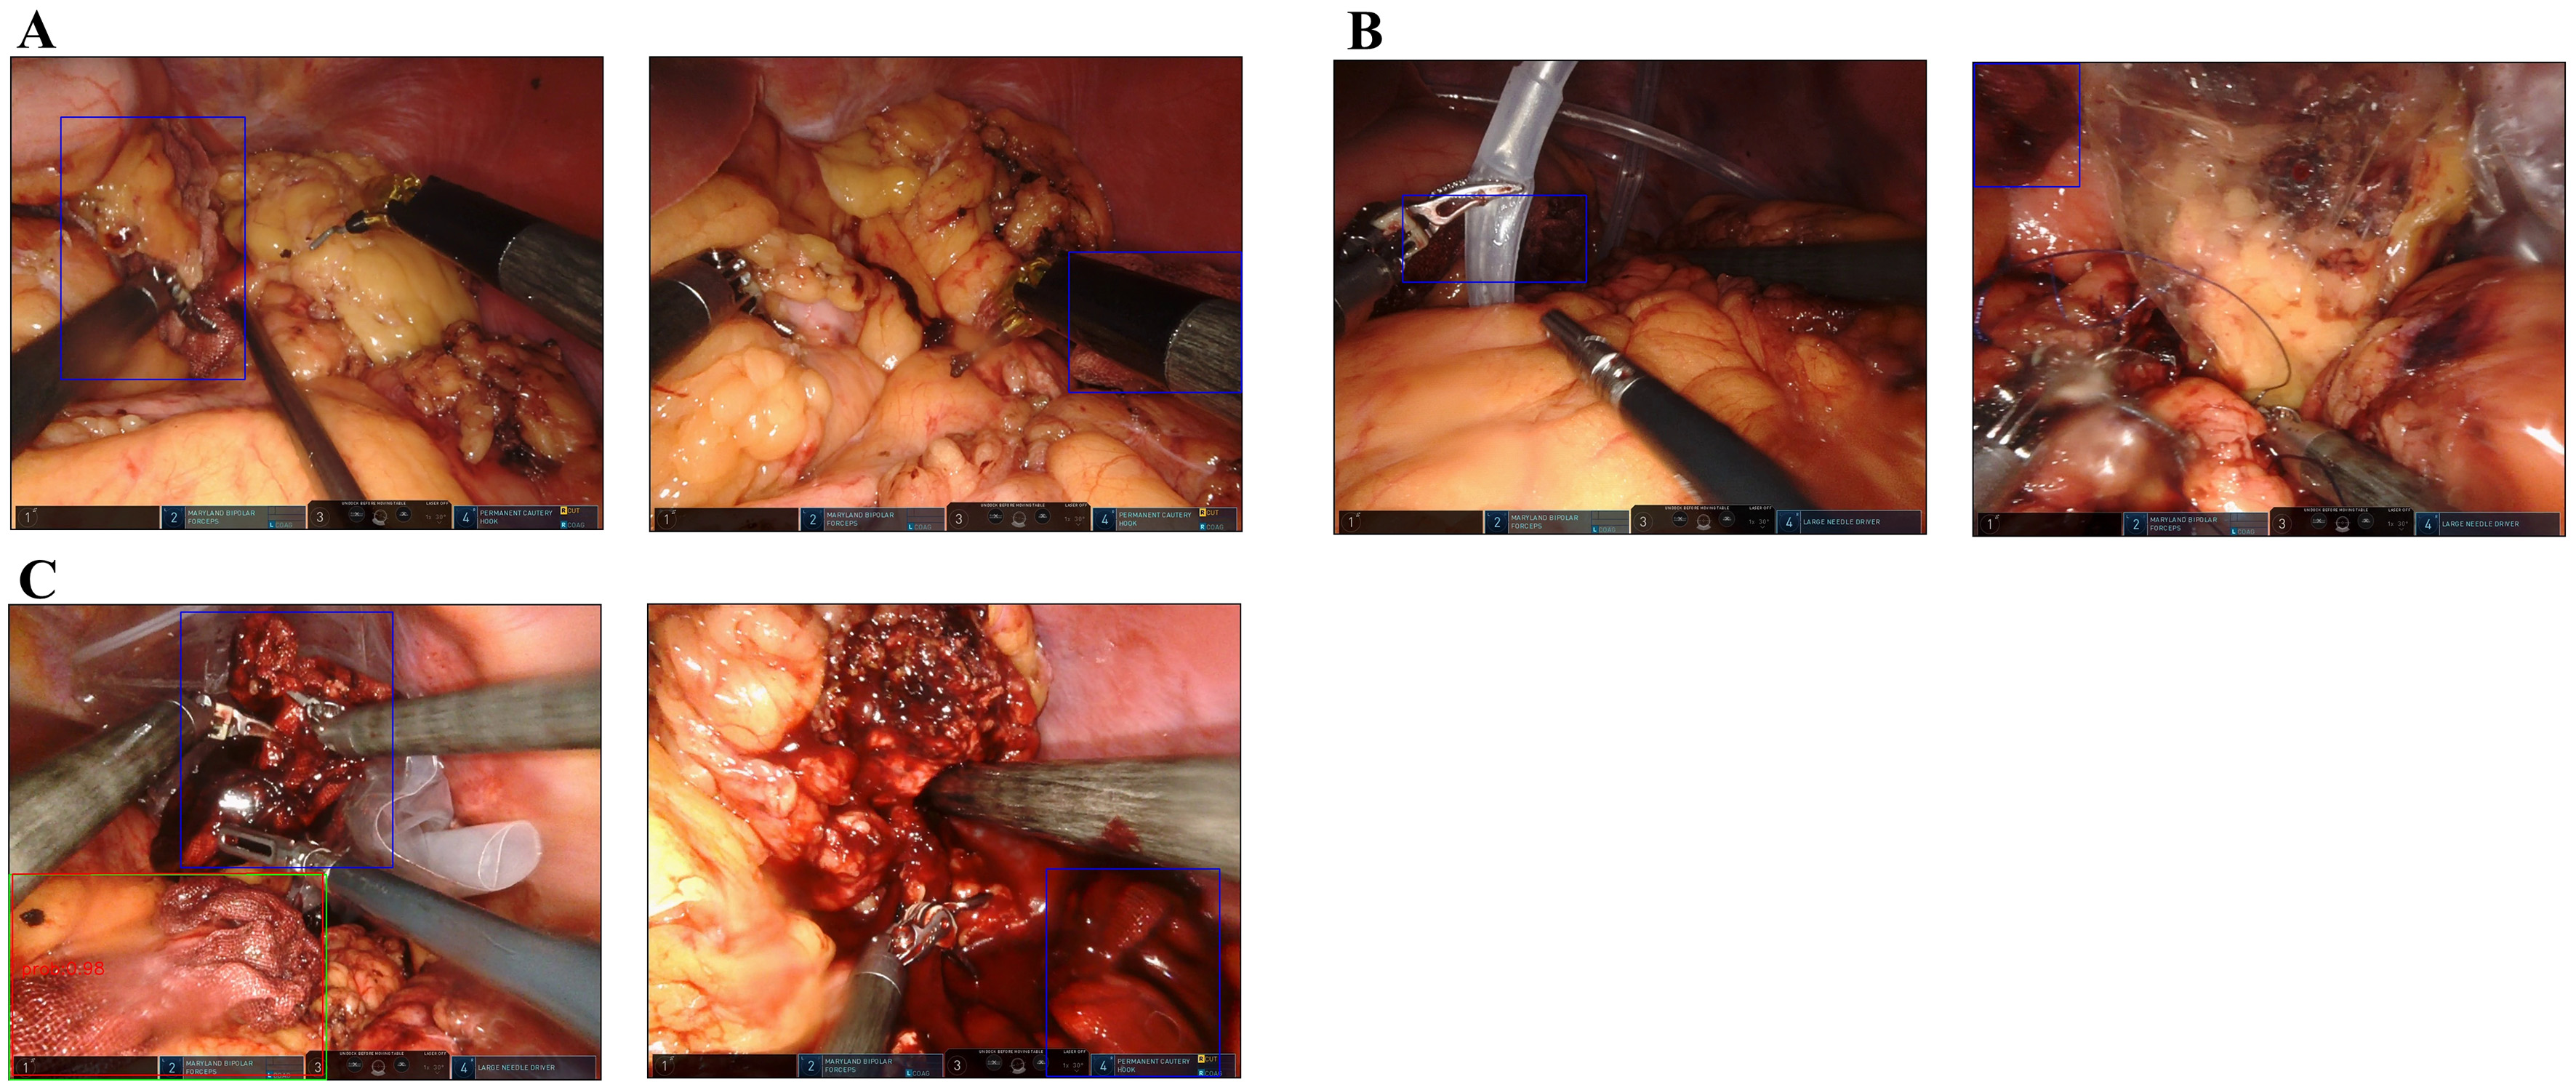
Figure 5. Examples of false negativity. Different situations causing false negativity were demonstrated, including: (A) Gauze sheltered by tissues or tools; (B) Gauze receiving poor illuminance; and (C) Gauze heavily immersed in blood. The green box indicates ground truth and the red box indicates the prediction output. The blue box indicates gauze not detected by the model.
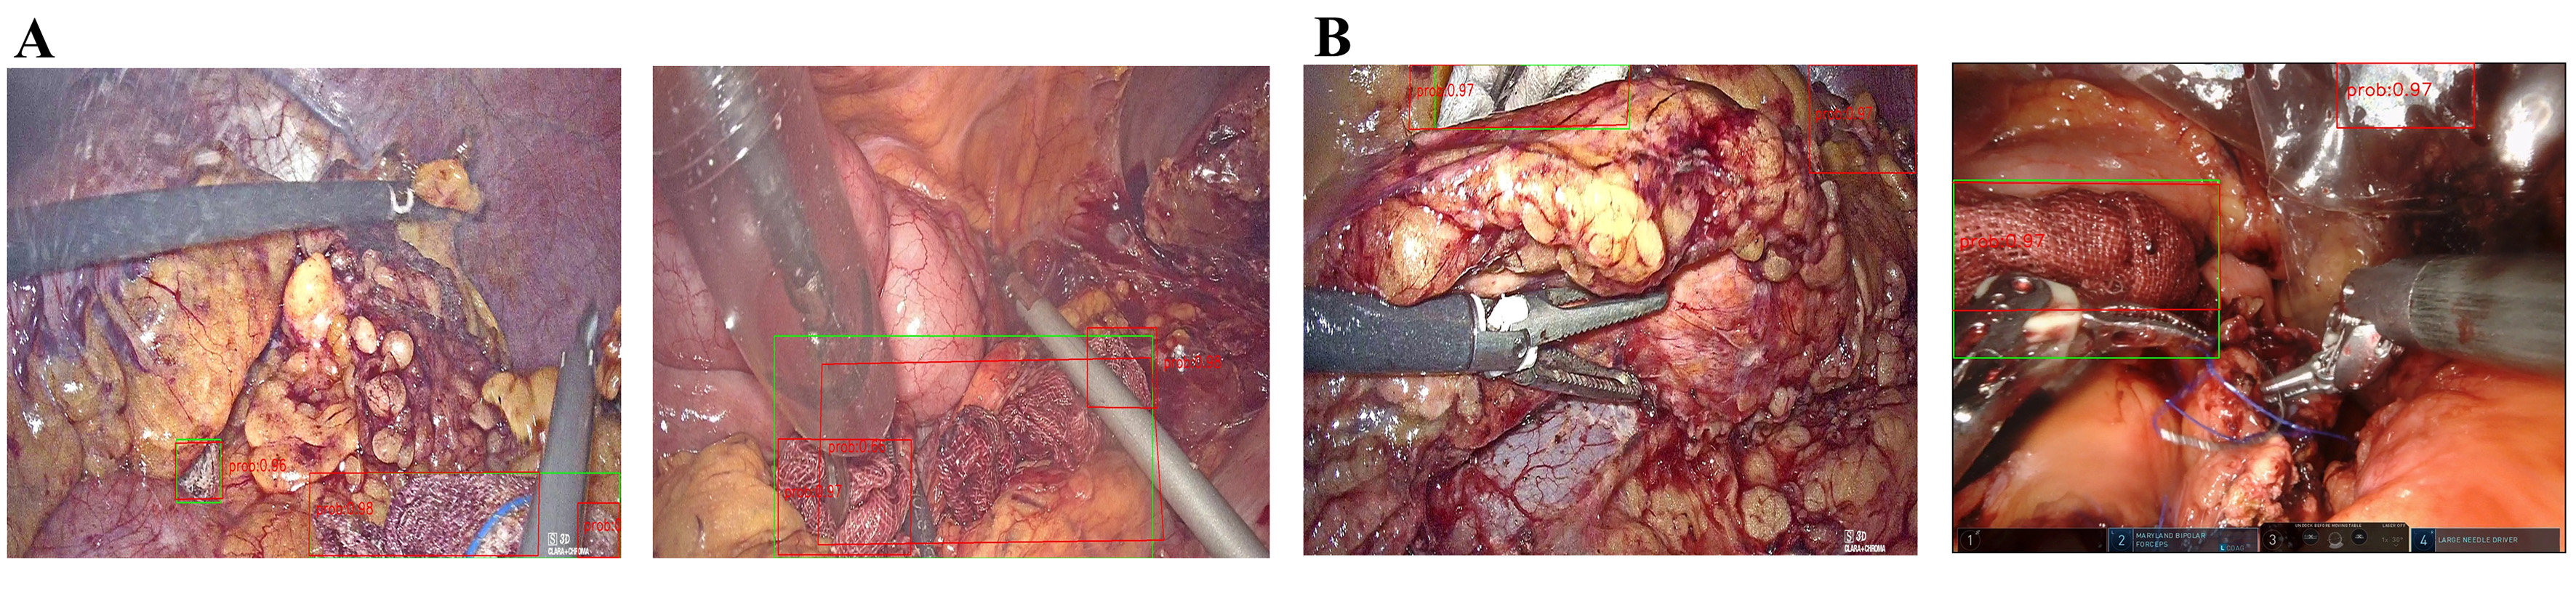
Figure 6. Examples of false positivity. Different situations causing false positivity were demonstrated, including: (A) Multiple predictions for one target and (B) Error detection raised by similar tissues or tools. The green box indicates ground truth and the red box indicates the prediction output.
Situations of false positivity and false negativity
| Situation | False positivity | Situation | False negativity |
| Total targets | 8,934 | Total targets | 26,143 |
| Error targets | 1,727 | Missed targets | 2,396 |
| Segmented targets | 1,174 | Too small | 1,021 |
| Similar tissue or tools | 226 | Hidden in shadow | 741 |
| Unknown reason | 327 | Immersed by blood | 580 |
| Unknown reason | 54 |
DISCUSSION
In this study, we developed and evaluated a modified YOLOv3-based gauze detection model using a multicenter dataset containing diverse laparoscopic and robotic pancreatic surgery scenes. The study provides an exploratory assessment of cross-center performance and preliminary clinical feasibility. Our study included a larger dataset and more complex surgical scenarios than previous studies and demonstrated the potential of a convolutional neural network (CNN) to assist surgical procedures. Regarding detection performance, the baseline model achieved a moderate sensitivity/precision of 84.70%/79.58% on the combined overall test set. After training with the dataset comprising hundreds of thousands of images, these metrics improved to 89.76%/81.03% on the combined overall test set. In terms of real-time performance, the single-frame computation time of our model is approximately 29.04 ms on the Tesla_P40 platform, supporting the feasibility of initial application of object detection algorithms in gauze recognition during clinical endoscopic surgery. Before this study, de La Fuente López et al.[17], Lai et al.[18], Sánchez-Brizuela et al.[19], Ao et al.[20] as well as our research team[16], have conducted related studies on gauze recognition using CNN [Table 5]. These studies have achieved commendable recognition results for gauze, but they have been constrained by a relatively limited amount of data and lack of practical validation. The current study includes a large amount of multicenter data and applied the algorithms in clinical practice, providing a novel insight to the field of intraoperative gauze detection.
Previous research concerning gauze detection
| First author | Data source | Data size | Algorithms | Task type | Evaluation |
| de la Fuente López[17] | Simulated laparoscopic surgery | 4,891 images of background and 1,782 of gauze. | ResNet50 | Detection | Accuracy: 100% Recall: 97% |
| Lai[18] | Laparoscopic surgery | 14 videos, 3,000 images | Yolov5x6 | Detection | Precision: 0.920 Recall: 0.828 mAP: 0.881 |
| Sánchez-Brizuela[19] | Simulated laparoscopic surgery | 42 videos, 4,003 images | Yolov3 and U-Net | Detection and Segmentation | Precision: 0.943 Recall: 0.760 F1 Score: 0.842 for Yolov3, 0.853 for U-Net |
| Ao[20] | Laparoscopic liver surgery | 33 videos, 1,616 images | Yolov8n | Detection and Segmentation | Precision: 0.9034 Recall: 0.8443 |
| Hua[16] | laparoscopic surgery | 80 videos, 26,893 images | Yolov3 | Detection | Recall: 0.784 Precision: 0.698 |
To reduce the computational burden of the integrated detector, we incorporated three architectural modifications: replacing upsampling with deconvolution, modifying part of the downsampling operation, and pruning network channels. The final integrated model had fewer parameters, lower floating-point operations per second (FLOPS), and shorter inference latency than the original YOLOv3 in a descriptive comparison [Supplementary Table 2]. However, because these modifications were introduced simultaneously and no formal ablation study was performed, the independent contribution of each modification to model accuracy, computational complexity, or inference latency cannot be established. The comparison with Single Shot MultiBox Detector (SSD)512, Faster R-CNN, and YOLOX-s showed that the modified YOLOv3 did not achieve the highest value for every individual metric. Faster R-CNN achieved higher sensitivity but produced more false-positive predictions, as reflected by its lower precision. YOLOX-s showed lower inference latency, but its sensitivity was lower than that of the modified YOLOv3. Under the present experimental conditions, the modified YOLOv3 provided a practical balance between sensitivity, precision, and computational efficiency. In simulated runs, our model achieved a commendable real-time performance of 34.44 frames per second (FPS), with no observable latency in clinical applications, thereby attesting to the robust real-time capability of the algorithm.
While certain studies have delved into multicenter computer vision research concerning laparoscopic surgery[21,22], our investigation provides an exploratory assessment of cross-center performance variation and the effect of incremental multicenter training in surgical scenes. The intricacy of surgical environments poses a unique challenge, as many deep learning algorithms that excel in scientific research domains, such as auto-driving, may not demonstrate comparable efficacy in surgical tasks. These experiments provide an exploratory assessment of performance variation across clinical centers and the effect of incorporating center-specific data.
In the data volume experiment, our aim was to determine the threshold at which the addition of images from a single-center dataset stabilized the performance of the model. As the number of training set images increased, we observed a gradual enhancement in performance on the XJH test set. The rate of improvement decreased after approximately 25,000 additional images. Because performance was still changing at 40,000 images, the present experiment does not establish a saturation point or a minimum number of images required for convergence. The number we tested can serve as a reference for determining the training volume of other deep learning medical models, but it should be noted that this conclusion will vary with different algorithms, tasks, and the quality of the training set (based on patient sources, number of surgeons, frame extraction rate, surgical scenes, etc.).
In the generalization experiment, we evaluated the performance of our model on different training and test sets from various centers. Relative to Model 1, the sensitivity improvement ranged from 4.90 to 16.93 percentage points across centers, while precision changes varied by center. Notably, as the scene complexity increased, indicated by the gradual inclusion of more centers in the training set, sensitivity improved incrementally, typically by 1-2 percentage points in the PUH3 test set. Moreover, after training on the PUH3 dataset, sensitivity increased substantially (by approximately 5.4 percentage points). A similar pattern was observed in the other centers. Interestingly, the precision in the XJH test set remained relatively lower around 70%. The lower precision observed in the XJH test set may reflect the greater visual similarity between gauze and certain tissues or surgical instruments in this center, as well as differences in illumination, image quality, camera viewpoint, background appearance, and surgical style. Partially occluded or fragmented gauze may further increase the difficulty of distinguishing true gauze regions from visually similar structures. The results of this experiment indicate that there are substantial differences in scenes between different hospitals, as evidenced by the improvement in performance after training with data from each respective center, and that incorporating multicenter data may improve performance across the clinical centers represented in the present dataset.
In addition to the experiments described above, we conducted a preliminary clinical assessment of the method. The surgeons provided generally positive qualitative feedback. We are currently performing an ongoing analysis to quantify the method’s benefits, using the time spent searching for gauze and the anxiety scores of the surgeon as main parameters. Based on the limited experience, it is expected that the method could have benefits in specific patient subgroups (with high bleeding volume and frequent use of gauze), but further research is needed to provide evidence.
This study presents several limitations. Firstly, although the model achieved relatively high sensitivity, its precision was lower and more variable across centers, particularly in the XJH test set. This means that a proportion of positive predictions may be false-positive alerts. Although prioritizing sensitivity may be reasonable for a safety-oriented gauze surveillance system, excessive false positives could distract surgeons or result in alert fatigue. As for solutions, we plan to further enhance the stability of the algorithms by addressing the identified issues listed in Table 4. Secondly, the use of rectangular boxes may not accurately depict gauze contours, as potential interference from surgical instruments, tissues, etc., can affect the gauze surface [Figure 5A], leading to model misjudgments. Therefore, considering the integration of other algorithms (which may increase computational load) or adopting a segmentation algorithm could be explored to effectively mitigate this issue. Thirdly, the effect of different frame-sampling intervals was not formally quantified because the one-in-24-frame strategy was used only during an early pilot exploration and was discontinued before construction of the final experimental dataset. Therefore, the present study cannot determine whether sparse sampling would improve generalization by reducing redundant frames or impair detection by omitting informative frames. Fourthly, a formal ablation study was not performed, and no separate validation set was used for checkpoint selection. Although the test sets were not used for model training or checkpoint selection, the absence of validation-based model selection may limit the assessment of potential overfitting. In addition, sensitivity and precision for the original YOLOv3 were not available from a controlled evaluation on the same held-out test set. Therefore, the present study cannot determine the independent effects of deconvolution, modified downsampling, and channel pruning on model accuracy, computational complexity, or inference latency. Lastly, while this study has extended into clinical practice, it falls short of providing a quantitative description of the model’s impact on surgical procedures. Future studies may consider quantitative clinical evaluation frameworks similar to that used by Nakanuma et al.[23], who evaluated an intraoperative AI system for anatomical landmark identification using a five-grade rubric and the Dice coefficient.
In summary, the proposed model detected gauze in multicenter laparoscopic and robotic surgical videos with a practical balance between sensitivity, precision, and inference efficiency. The system may serve as an assistive tool for gauze localization during surgery. However, its clinical benefit and effect on surgical safety require validation in prospective studies with predefined clinical endpoints and appropriate comparison groups.
Conclusion
The modified YOLOv3-based model enabled real-time gauze detection in the evaluated multicenter surgical datasets. Incorporating data from multiple centers was associated with improved performance on the corresponding test sets, supporting the feasibility of multicenter training for exploratory cross-center evaluation. Further prospective studies involving completely unseen centers and predefined clinical endpoints are needed to determine its clinical benefit and effect on retained foreign-body prevention.
DECLARATIONS
Acknowledgments
In the current work, algorithm operation was supported by the high-performance computing platform of Peking Union Medical College Hospital. We thank all colleagues for their generous help in providing surgery recordings. We also thank all colleagues and friends for their critical discussions and valuable support of our work.
Authors’ contributions
Conceptualization, data curation, formal analysis, funding acquisition, investigation, writing - original draft: Ping L
Formal analysis, investigation: Ding R, Wang H, Yuan M, Li J
Data curation, funding acquisition, investigation: Gao J
Data curation, investigation: Wang Z
Investigation: Zhou H
Data curation: Shi J
Conceptualization, funding acquisition, project administration, resources, supervision: Wu W
Conceptualization, project administration, resources, supervision: Liu Z, Qin R, Yuan C, Yu X
Conceptualization, funding acquisition, project administration, resources, supervision: Hua S
Availability of data and materials
The data that support the findings of this study are available from the corresponding author upon reasonable request. The source code and configuration files used for model development are available from the corresponding author upon reasonable request.
AI and AI-assisted tools statement
Not applicable.
Financial support and sponsorship
This work was supported by grants to Wu W from the Independent Research Fund of the State Key Laboratory of Complex, Severe, and Rare Diseases (No. 2025-I-ZD-002), from the Noncommunicable Chronic Diseases National Science and Technology Major Project (No. 2024ZD0525500/2024ZD0525502); by grants to Gao J from the National High Level Hospital Clinical Research Funding (No. 2025-PUMCH-H-008); by grants to Hua S from the National High Level Hospital Clinical Research Funding (No. 2022-PUMCH-B-003 and No. 2022-PUMCH-A-052); and by grants to Ping L from 2026 Xingyuan Project of Peking Union Medical College Hospital.
Conflicts of interest
All authors declared that there are no conflicts of interest.
Ethical approval and consent to participate
The study was performed in accordance with the Declaration of Helsinki. The study was approved by the ethics committees of the participating hospitals: I-23PJ253 (the Institutional Review Board of Peking Union Medical College Hospital, which reviewed the conduction of the study in all centers) & I-23PJ343 (the Institutional Review Board of Peking Union Medical College Hospital, which reviewed the conduction of the study at PUMCH); IRB00006761-M2023135 (Peking University Third Hospital Medical Science Research Ethics Committee); KY20232167-F-1 (the Medical Ethics Committee of the First Affiliated Hospital of the Air Force Medical University); 2303272-6 (Shanghai Cancer Center Institutional Review Board); TJ-IRB20230420 (Institutional Review Board, Tongji Hospital, Tongji Medical College, Huazhong University of Science and Technology). At PUH3, FUSCC and WHTH, informed consent was waived as surgical videos were collected only retrospectively with no identifiable information included. At PUMCH and XJH, written informed consent was obtained from each participant before the collection of intraoperative videos, intraoperative photographs, and medical-record data. For the retrospective observational phase, an institutional consent form that authorized the collection and use of these materials for clinical teaching and medical research, with appropriate protection of personal privacy, was used. The consent form was an institutional broad informed consent document and was not specific to the present manuscript. For the interventional phase, an additional informed consent was obtained from all participants to inform them of the details of the study.
Consent for publication
At PUMCH and XJH, where informed consent was not waived, written informed consent was obtained from each participant before the collection of intraoperative videos, intraoperative photographs, and medical-record data. The institutional consent form authorized the collection and use of these materials for clinical teaching and medical research, with appropriate protection of personal privacy. The consent form was an institutional broad informed-consent document and was not specific to the present manuscript. For the identifiable photograph included in Figure 4, separate written consent for publication was obtained from the individual shown.
Copyright
© The Author(s) 2026.
Supplementary Materials
REFERENCES
1. Buia A, Stockhausen F, Hanisch E. Laparoscopic surgery: a qualified systematic review. World J Methodol. 2015;5:238-54.
2. Qian T, Huang K, Chen W, et al. Comparison of outcomes with stapler versus hand-sewn closure of the pancreatic stump following minimally invasive distal pancreatectomy: a retrospective cohort study. J Pancreatol. 2024;7:106-10.
3. Zhou JW, Huang XT, Cai JP, et al. Two-drain versus three-train strategy in robotic-assisted pancreaticoduodenectomy: impact on complications. J Pancreatol. 2025;8:272-8.
4. Serra J, Matias-Gulu X, Calabuig R, Garcia P, Sancho FJ, La Calle JP. Surgical gauze pseudotumor. Am J Surg. 1988;155:235-7.
6. Liu F, Chen D, Wang F, Li Z, Xu F. Deep learning based single sample face recognition: a survey. Artif Intell Rev. 2023;56:2723-48.
7. Grigorescu S, Trasnea B, Cocias T, Macesanu G. A survey of deep learning techniques for autonomous driving. J Field Robot. 2020;37:362-86.
8. Ma J, Wu F, Jiang T, Zhu J, Kong D. Cascade convolutional neural networks for automatic detection of thyroid nodules in ultrasound images. Med Phys. 2017;44:1678-91.
9. Suk HI, Wee CY, Lee SW, Shen D. State-space model with deep learning for functional dynamics estimation in resting-state fMRI. Neuroimage. 2016;129:292-307.
10. Liu F, Jang H, Kijowski R, Bradshaw T, Mcmillan AB. Deep learning MR imaging-based attenuation correction for PET/MR imaging. Radiology. 2018;286:676-84.
11. Wang Y, Sun Q, Sun G, Gu L, Liu Z. Object detection of surgical instruments based on Yolov4. In: 2021 6th IEEE International Conference on Advanced Robotics and Mechatronics (ICARM). IEEE; 2021. pp. 578-81.
12. Wang B, Zheng J, Yu JF, et al. Development of artificial intelligence for parathyroid recognition during endoscopic thyroid surgery. Laryngoscope. 2022;132:2516-23.
13. Takeuchi M, Collins T, Ndagijimana A, et al. Automatic surgical phase recognition in laparoscopic inguinal hernia repair with artificial intelligence. Hernia. 2022;26:1669-78.
14. Shinozuka K, Turuda S, Fujinaga A, et al. Artificial intelligence software available for medical devices: surgical phase recognition in laparoscopic cholecystectomy. Surg Endosc. 2022;36:7444-52.
15. Cheng K, You J, Wu S, et al. Artificial intelligence-based automated laparoscopic cholecystectomy surgical phase recognition and analysis. Surg Endosc. 2022;36:3160-8.
16. Hua S, Wang Z, Wang J, et al. Application value of machine learning algorithms for gauze detection in laparoscopic pancreatic surgery. Chin J Dig Surg. 2021;20:1324-30.
17. de La Fuente López E, Muñoz García Á, Santos Del Blanco L, Fraile Marinero JC, Pérez Turiel J. Automatic gauze tracking in laparoscopic surgery using image texture analysis. Comput Methods Programs Biomed. 2020;190:105378.
18. Lai SL, Chen CS, Lin BR, Chang RF. Intraoperative detection of surgical gauze using deep convolutional neural network. Ann Biomed Eng. 2023;51:352-62.
19. Sánchez-brizuela G, Santos-criado F, Sanz-gobernado D, et al. Gauze detection and segmentation in minimally invasive surgery video using convolutional neural networks. Sensors. 2022;22:5180.
20. Ao X, Leng Y, Gan Y, et al. Gauze detection and segmentation in laparoscopic liver surgery: a multi-center study. Eur J Med Res. 2025;30:905.
21. Mascagni P, Vardazaryan A, Alapatt D, et al. Artificial intelligence for surgical safety: automatic assessment of the critical view of safety in laparoscopic cholecystectomy using deep learning. Ann Surg. 2022;275:955-61.
22. Madani A, Namazi B, Altieri MS, et al. Artificial intelligence for intraoperative guidance: using semantic segmentation to identify surgical anatomy during laparoscopic cholecystectomy. Ann Surg. 2022;276:363-9.
Cite This Article
 Open Access
How to Cite
Ping L, Ding R, Wang H, Yuan M, Li J, Gao J, Wang Z, Zhou H, Shi J, Wu W, Liu Z, Qin R, Yuan C, Yu X, Hua S. Implementation of deep learning-based gauze detection in pancreatic laparoscopic and robotic surgery: an exploratory multicenter evaluation. Art Int Surg. 2026;6:622-37. https://dx.doi.org/10.20517/ais.2026.56
Download Citation
Export Citation File:
Type of Import
Tips on Downloading Citation
Citation Manager File Format
Type of Import
Direct Import: When the Direct Import option is selected (the default state), a dialogue box will give you the option to Save or Open the downloaded citation data. Choosing Open will either launch your citation manager or give you a choice of applications with which to use the metadata. The Save option saves the file locally for later use.
Indirect Import: When the Indirect Import option is selected, the metadata is displayed and may be copied and pasted as needed.
About This Article
Copyright

Data & Comments
Data
0






Comments
Comments must be written in English. Spam, offensive content, impersonation, and private information will not be permitted. If any comment is reported and identified as inappropriate content by OAE staff, the comment will be removed without notice. If you have any queries or need any help, please contact us at support@oaepublish.com.