


fig1
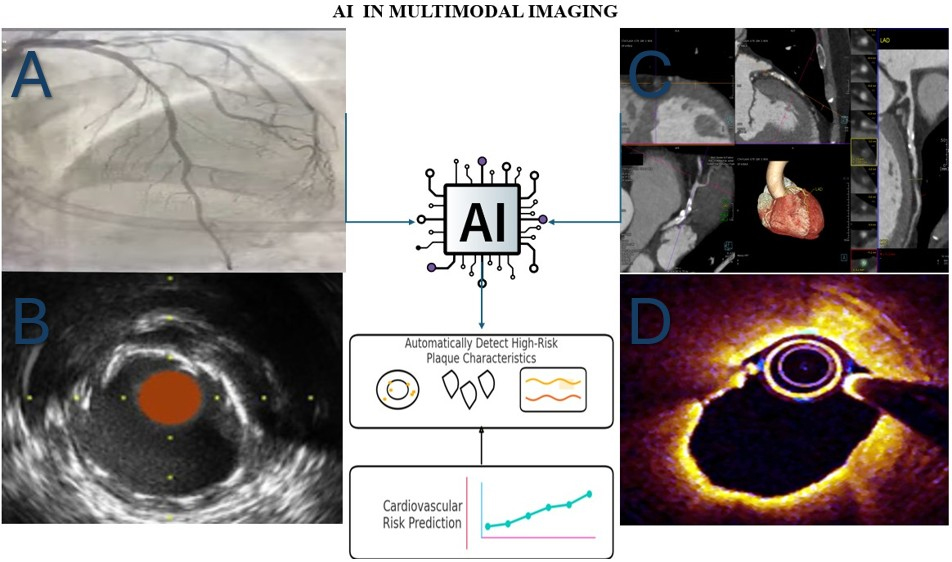
Figure 1. Schematic overview showing how AI integrates data from CCTA, OCT, and IVUS to identify high-risk plaque features, such as thin fibrous caps, lipid cores, and inflammation, for improved coronary risk assessment. (A) Image of coronary angiography from my clinical activity in Santa Maria Goretti Hospital, Latina; (B) Image of IVUS adapted from reference 26[26]. Licensed under CC BY 4.0


