


fig4
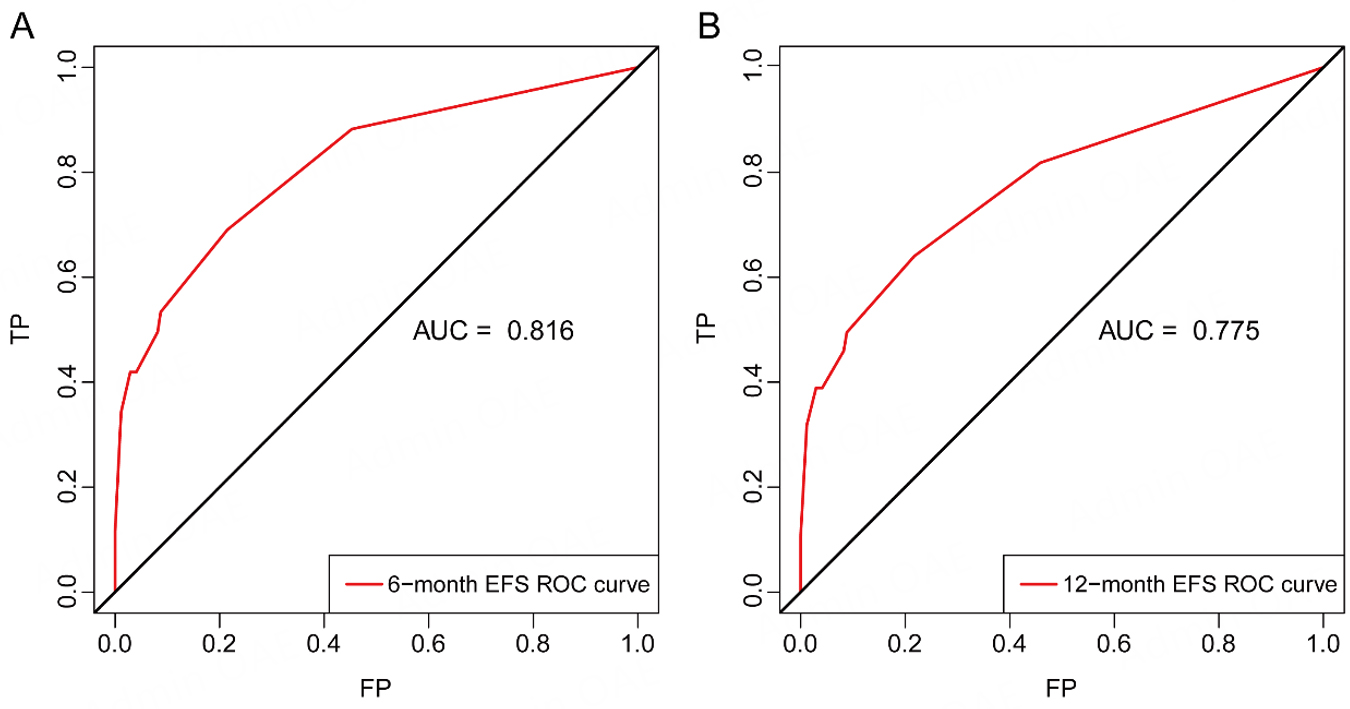
Figure 4. Time-dependent ROC curves of the nomogram for predicting EFS. (A) ROC curve for 6-month EFS; (B) ROC curve for 12-month EFS.
Figure 4. Time-dependent ROC curves of the nomogram for predicting EFS. (A) ROC curve for 6-month EFS; (B) ROC curve for 12-month EFS.

All published articles are preserved here permanently:
https://www.portico.org/publishers/oae/

