


fig5
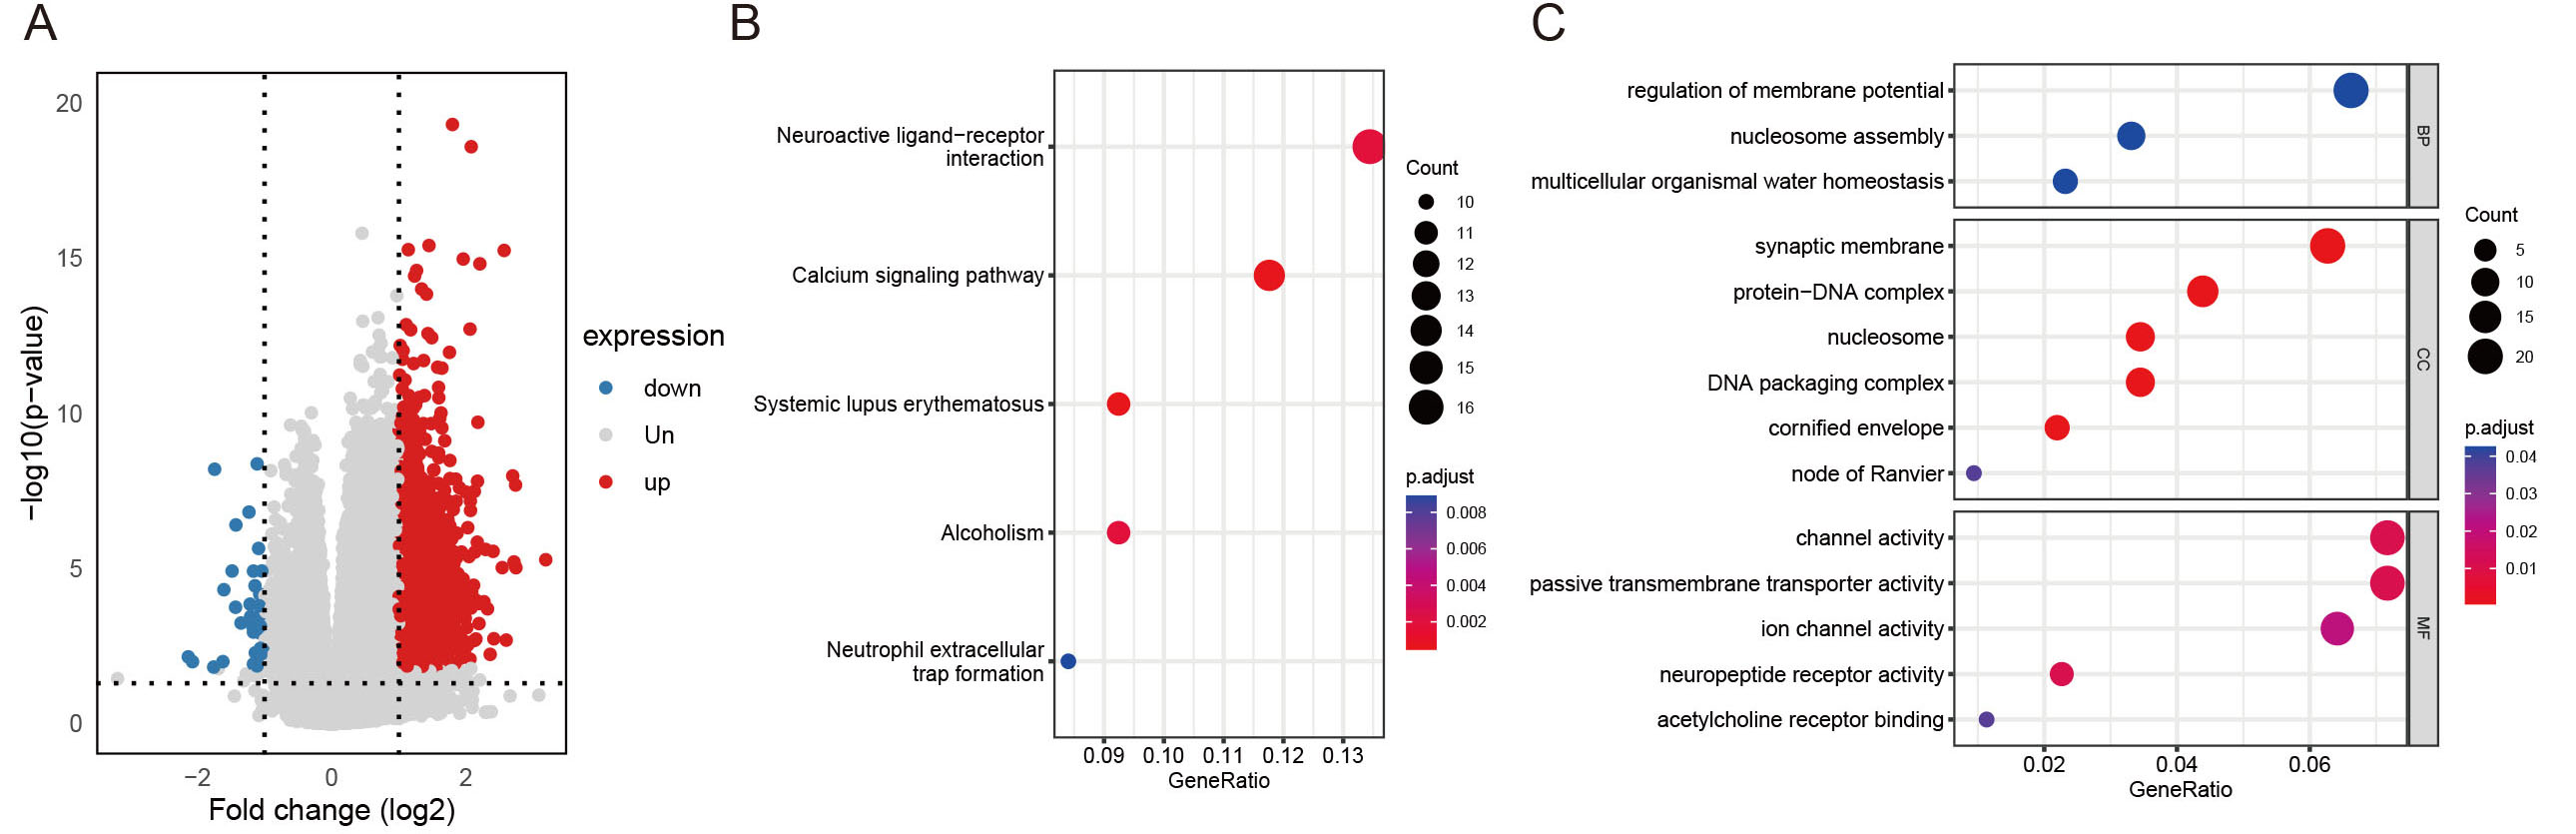
Figure 5. (A) Volcano plot of differentially expressed genes between the FAMscore-high and FAMscore-low groups of TCGA database. (B) KEGG bubble plot. (C) GO bubble plot.
Figure 5. (A) Volcano plot of differentially expressed genes between the FAMscore-high and FAMscore-low groups of TCGA database. (B) KEGG bubble plot. (C) GO bubble plot.


All published articles are preserved here permanently:
https://www.portico.org/publishers/oae/

