


fig1
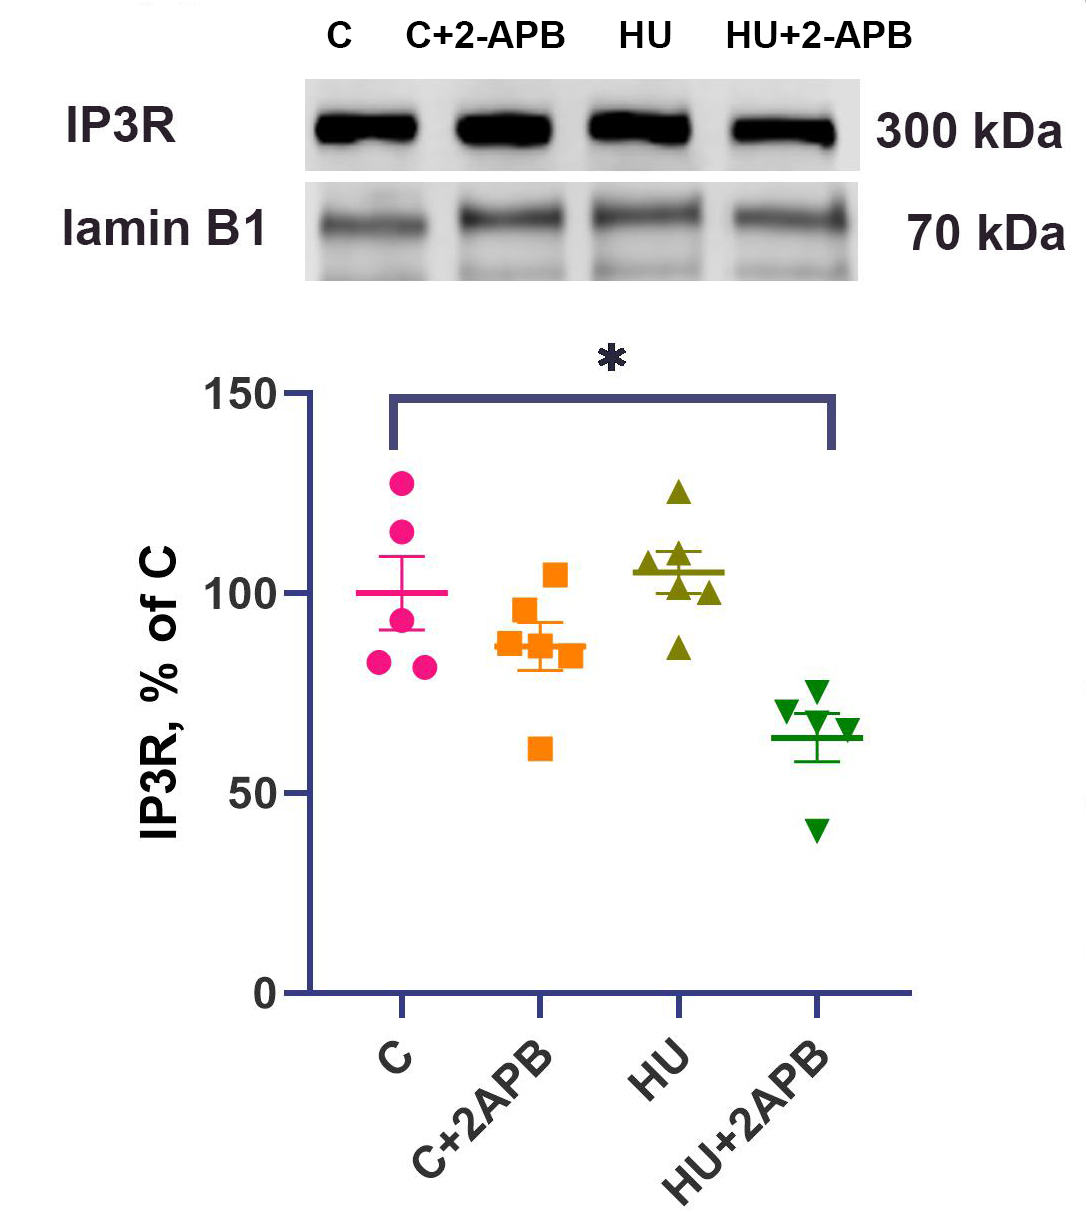
Figure 1. Nuclear IP3R content normalized to lamin B1 content. Data are shown as mean value±SEM. * - significantly different from the C group (P < 0.05). IP3R: Inositol 1,4,5-triphosphate receptors; SEM: standard error of the mean.
Figure 1. Nuclear IP3R content normalized to lamin B1 content. Data are shown as mean value±SEM. * - significantly different from the C group (P < 0.05). IP3R: Inositol 1,4,5-triphosphate receptors; SEM: standard error of the mean.


All published articles are preserved here permanently:
https://www.portico.org/publishers/oae/


