

Employing quantitative microbial risk assessment (QMRA) to derive aquatic thresholds for antibiotic-resistant strains of Escherichia coli, Staphylococcus aureus and Salmonella typhi: a case study in the Yangtze Estuary
 0
0 Abstract
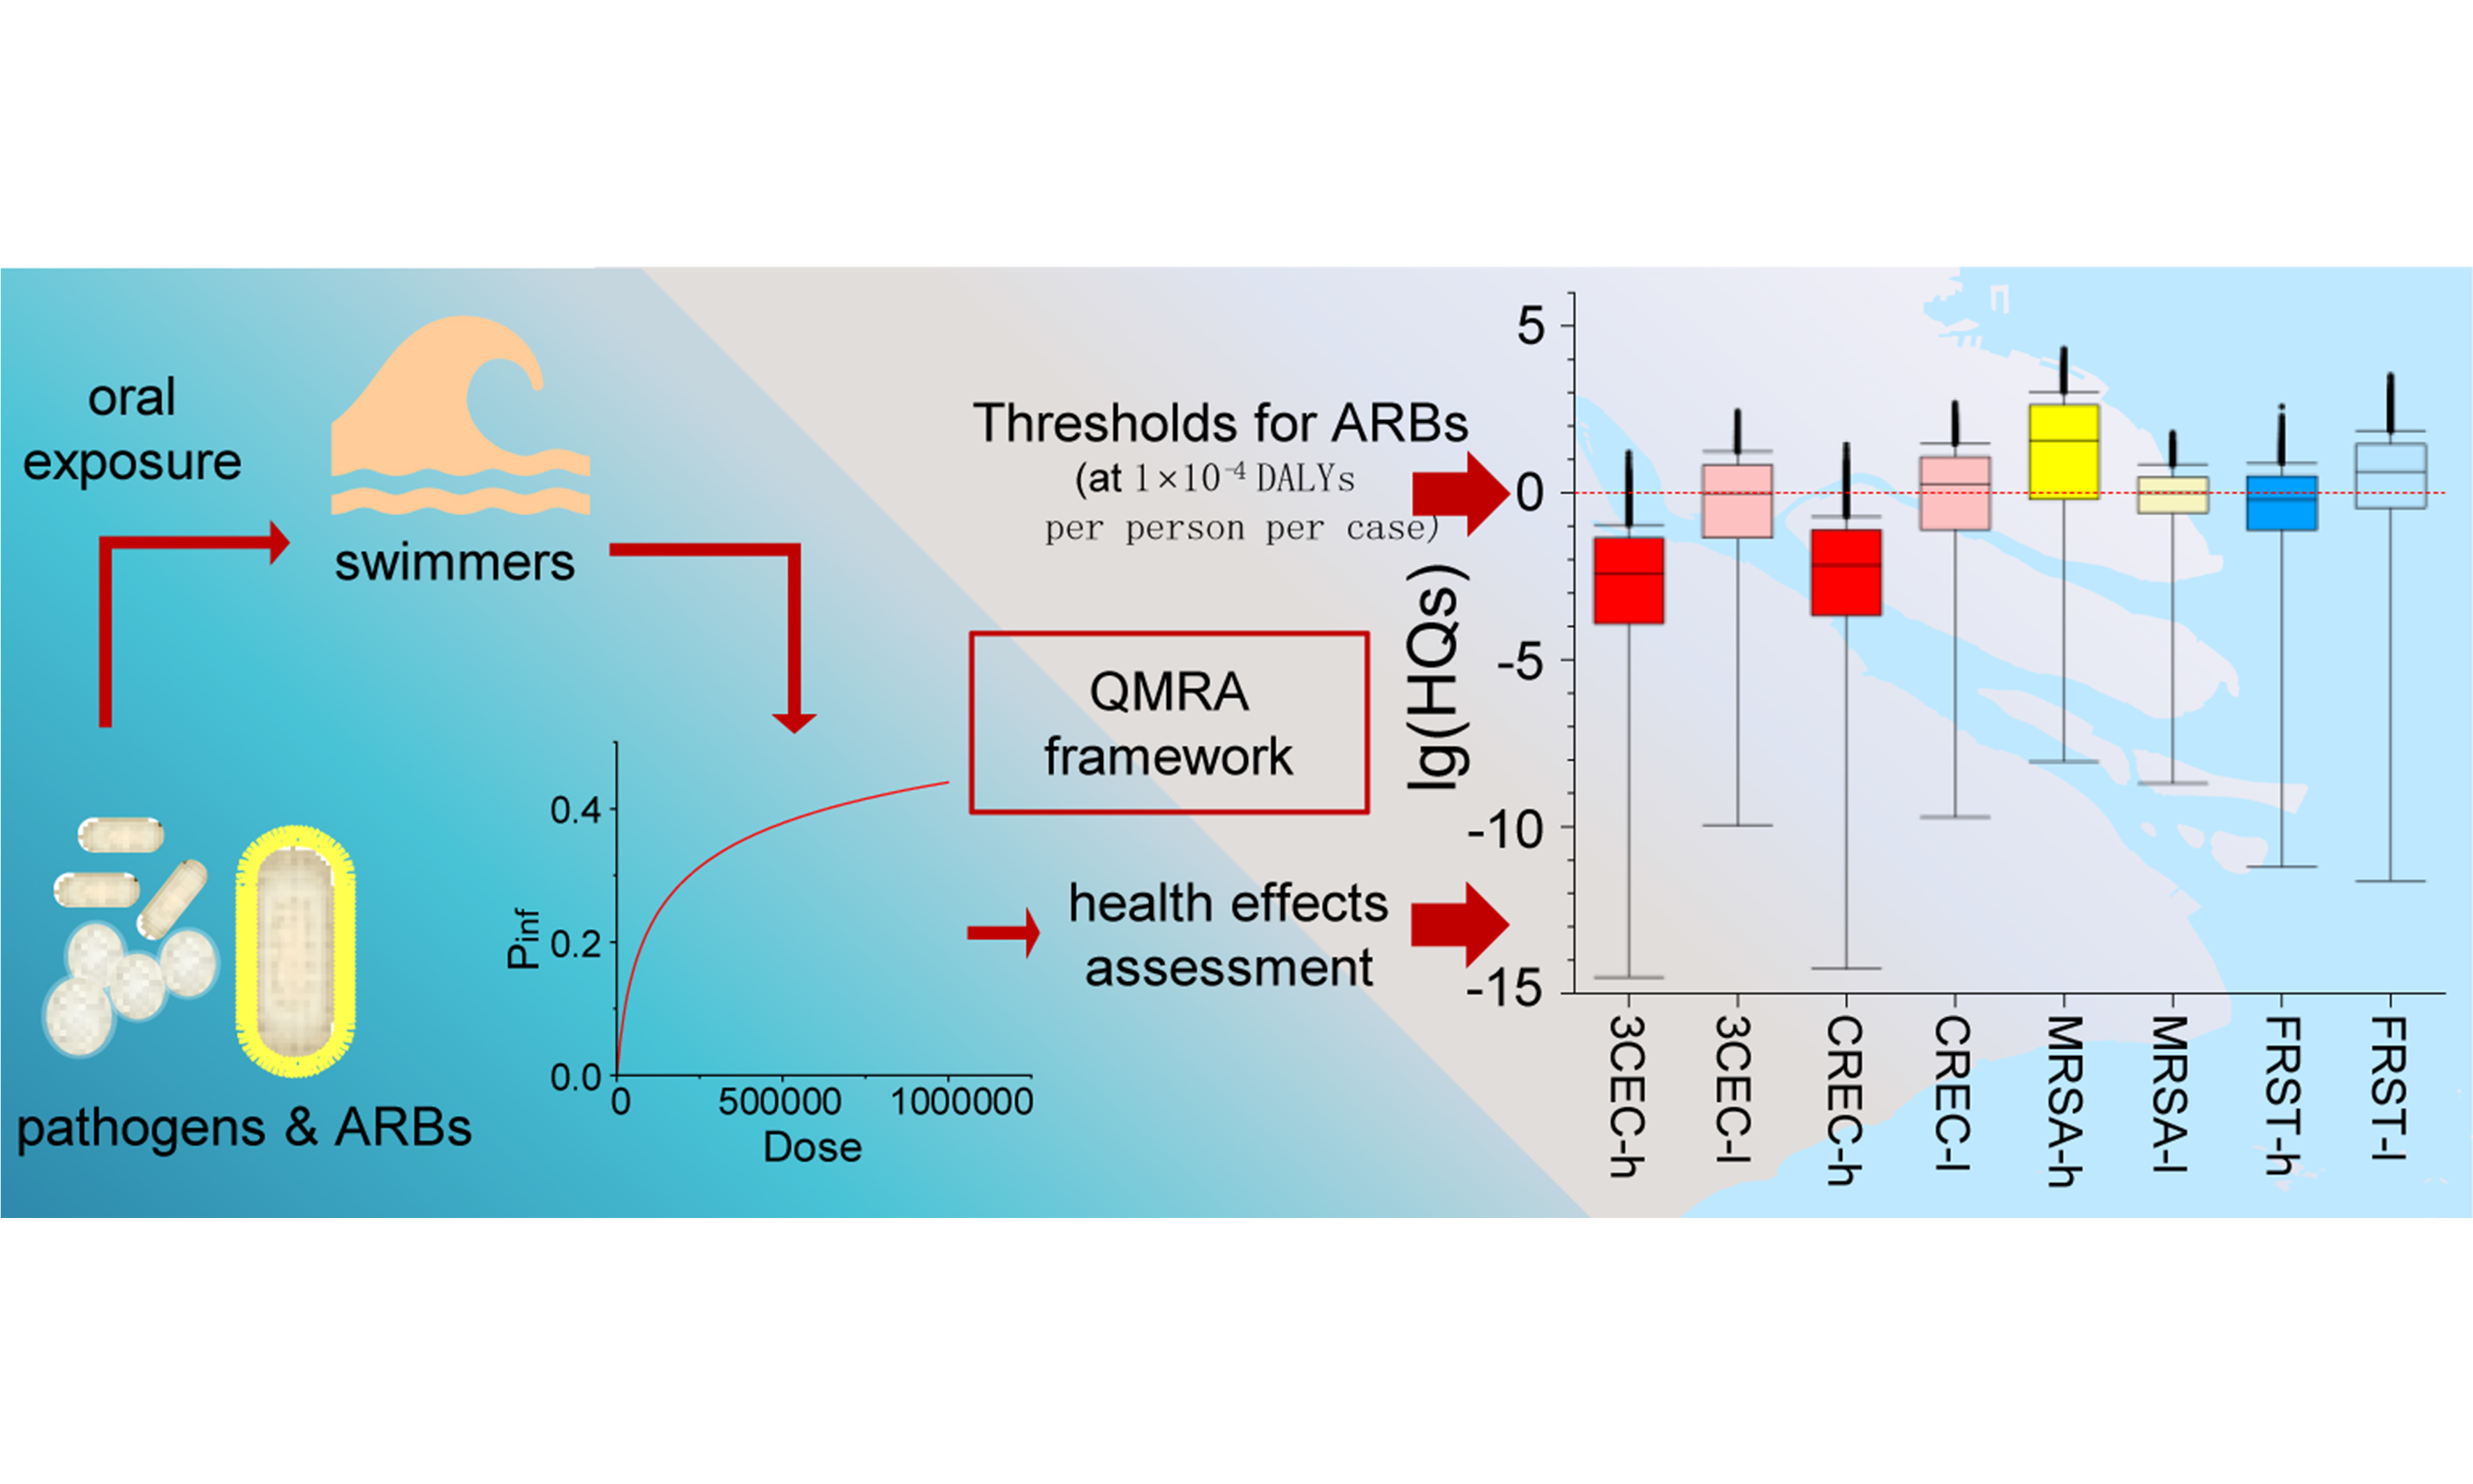
Antimicrobial resistance poses a global public health crisis, yet environmental thresholds for antimicrobial-resistant bacteria remain underdeveloped. In this study, a quantitative microbial risk assessment (QMRA) approach was applied to derive environmental thresholds and evaluate the health risks of (i) third-generation cephalosporin-resistant Escherichia coli (3CEC); (ii) carbapenem-resistant Escherichia coli (CREC); (iii) methicillin-resistant Staphylococcus aureus (MRSA); (iv) fluoroquinolone-resistant Salmonella typhi (FRST), along with the corresponding general pathogens, i.e., Escherichia coli, Staphylococcus aureus and Salmonella typhi, in recreational waters at bathing beaches in the Yangtze Estuary. Using an acceptable disease burden of 1 × 10⁻⁴ disability-adjusted life years (DALYs) per person per case, the derived environmental thresholds for 3CEC, CREC, MRSA and FRST were 6.95 × 10⁻², 3.95 × 10⁻², 4.10 × 10⁻³, and 2.85 × 10⁻¹ copies/mL, respectively. Seasonal variations in health risks were evident: risk levels for 3CEC, CREC and FRST were higher in the low-flow season than in the high-flow season [median hazard quotients (HQs) = 3.80 × 10⁻³, 6.70 × 10⁻³, 0.629 in high-flow season and 1.00, 1.77, 4.38 in low-flow season], whereas the opposite trend was observed for MRSA (median HQ = 37.5 in high-flow season and 1.01 in low-flow season, P < 0.001). These patterns were consistently supported by infection probabilities and disease burden (DALYs). Sensitivity analysis revealed that pathogen abundance was the most influential part in the QMRA models, while other parameters showed low sensitivity. These results validated the thresholds derived and highlighted the necessity of frequent surveillance and accurate detection in practice.
Keywords
INTRODUCTION
Antimicrobial resistance (AMR) has been designated as a global public health crisis by the World Health Organization (WHO), requiring urgent management[1]. Antibiotic resistance genes (ARGs) are the molecular basis of AMR[2]. The burden of ARGs in the environment has a serious impact on human health due to the horizontal gene transfer of ARGs from the environment to the human body, which leads to infections with antibiotic-resistant bacteria (ARBs) and compromises the therapeutic efficacy of clinical antibiotic treatment[3].
Recreational water exposure to pathogenic bacteria has been identified as a significant risk factor for gastrointestinal infections and other diseases[4]. The primary exposure pathway involves fecal-oral transmission of enteric pathogens, with human sewage discharge, agricultural runoff, and wildlife fecal deposition constituting the dominant contamination sources[5]. Global surveillance has documented the presence of multiple waterborne pathogens in recreational settings, including Escherichia coli (EC) O157:H7, Staphylococcus aureus (SA), Salmonella, Campylobacter jejuni, Legionella spp., Pseudomonas aeruginosa, and Shigella sonnei[6,7].
To address this health threat, quantitative microbial risk assessment (QMRA) has emerged as the predominant approach for evaluating health risks of aquatic microbials and ARBs[8,9]. Through its probabilistic modeling framework, QMRA demonstrates superior sensitivity in identifying minor risk factors than traditional epidemiology approaches[10]. This methodology employs disability-adjusted life years (DALYs) as its primary outcome metric, providing a comprehensive measure of disease burden that incorporates both mortality and morbidity impacts[11]. Recognized by the WHO as a key tool for water pollution management[10], QMRA has been implemented worldwide to evaluate health risks associated with various pathogenic bacteria, including EC[11,12], SA[9], Salmonella[13], Listeria[14], Klebsiella pneumoniae[11], and Pseudomonas aeruginosa[12,15], in a variety of environmental media, including water. Moreover, culture-based selection and quantification have recently been incorporated into several QMRA frameworks to identify the additional health risks posed by ARBs compared to antibiotic-sensitive microbes[11,16-18]. Some other studies employed sequencing-based or computational approaches to quantify ARGs and ARBs, which are emerging alternatives that are more efficient and convenient than culture-based methods[19-22]. Given the methodological advancements and distinct advantages, a QMRA-based framework offers a scientifically rigorous, cost-effective, and efficient approach to deriving environmental thresholds for ARGs/ARBs.
Shanghai, a megacity located at the Yangtze Estuary with a population exceeding 24 million and a 211 km mainland coastline, faces unique water environment challenges[23]. The marine economy contributes approximately 30% to the regional gross product, while tourism generates 6% of the city’s gross domestic product (GDP)[23]. These economic drivers have intensified anthropogenic pressures on coastal ecosystems, particularly affecting drinking water reservoirs and recreational beaches, as evidenced by elevated microbial indicator levels and increased pathogen detection rates[12,23]. Consequently, regulatory limits have been established for several pathogens in recreational waters (e.g., coliforms and fecal coliforms)[24]; however, no such regulations currently exist for ARBs in the region, despite their emerging public health relevance.
To bridge the gap between environmental surveillance of ARBs and public health safeguarding, this study aimed to: (1) develop environmental thresholds for ARBs using a QMRA framework; and (2) apply these thresholds and a sequencing-based quantification approach to assess health risks in the Yangtze Estuary. The target pathogens and ARBs were selected from the clinically relevant ARBs identified in the estuary through monitoring. By integrating QMRA with site-specific monitoring data, this work provides a novel framework for establishing science-based ARB thresholds and offers practical management strategies for mitigating AMR risks in aquatic environments.
EXPERIMENTAL
Sampling sites
Surface water samples were collected in triplicates from eight sampling sites along the Yangtze Estuary [Figure 1A and B]: (1) Xupu (XP, a tidal flat); (2) Qiyakou (QYK, the junction of Qipu River and the Yangtze River); (3) Liuhekou (LHK, the junction of Liu River and the Yangtze River); (4) Wusongkou (WSK, the junction of the Huangpu River and the Yangtze River); (5) Shidongkou (SDK, Shidong Harbor, near a wastewater treatment plant outfall); (6) Sanchakou (SCK, a tidal flat); (7) Dazhihe (DZH, the junction of Dazhi River and the Yangtze River); and (8) Luchaogang (LCG, Luchao Harbor). Sampling was conducted in two seasons in 2024: the high-flow season (April) and the low-flow season (November). All samples were stored on ice in sterile containers. Once transported to the laboratory, water samples were filter-concentrated onto 0.22 μm pore-size filters [Water-phase, SCBB-207, ANPEL Laboratory Technologies (Shanghai) Inc., China], which were used to extract DNA for target genes analysis and metagenomic sequencing.
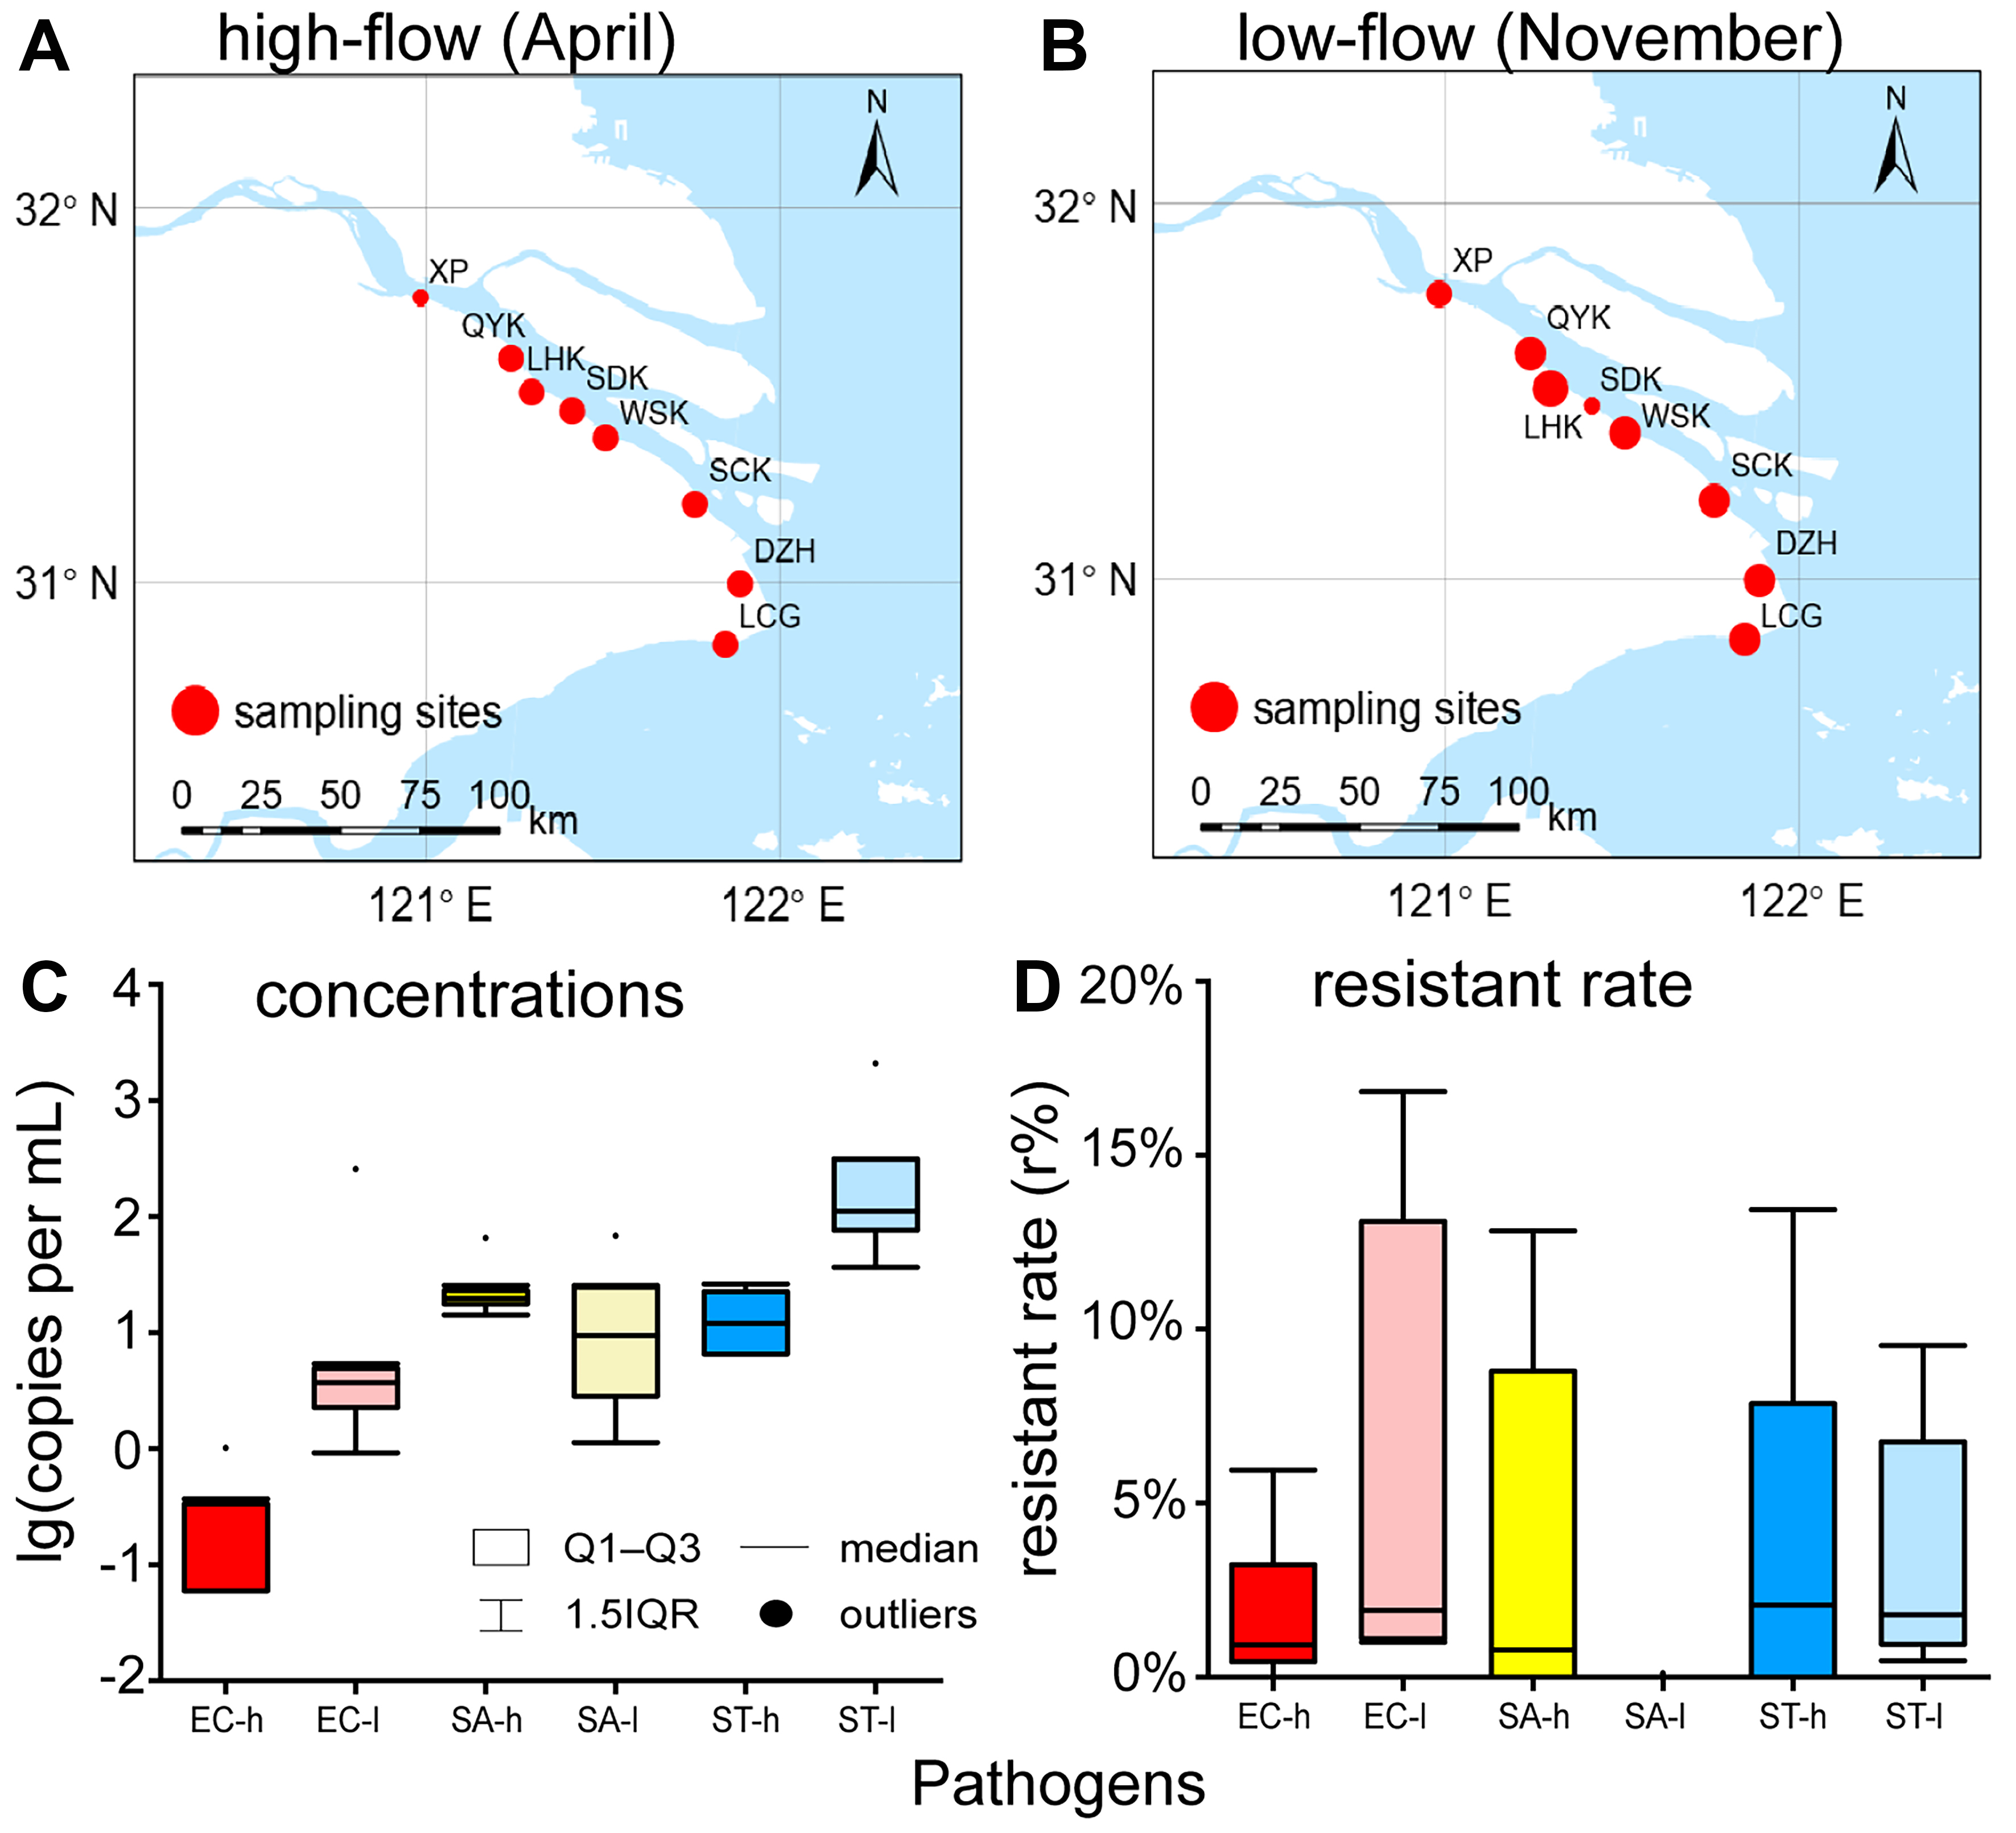
Figure 1. Sampling sites in (A) high-flow season and (B) low-flow season in the Yangtze Estuary of this study, with size of points representing combined concentration of EC, SA and ST; and quantification of (C) general pathogens and (D) resistant ratios. The base map used in this figure was obtained from National Catalogue Service For Geographic Information[25] (https://www.webmap.cn). EC: Escherichia coli; SA: Staphylococcus aureus; ST: Salmonella typhi; h: high-flow season; l: low-flow season; XP: Xupu; QYK: Qiyakou; LHK: Liuhekou; SDK: Shidongkou; WSK: Wusongkou; SCK: Sanchakou; DZH: Dazhihe; LCG: Luchaogang; IQR: interquartile range.
Selection and quantification of target pathogens
According to the manufacturer’s protocols, the total genomic DNA of the water samples was extracted from the membranes using the Ezup Column Soil DNA Purification Kit (Sangon Biotech, Shanghai). The concentration and purity of the extracted DNA were determined using an ultraviolet-visible (UV-Vis) Spectrophotometer (SMA4000, Merinton, Beijing, China), and then the DNA solution was stored at -20 °C until undergoing metagenomic analysis and quantitative polymerase chain reaction (qPCR). Target pathogens and their resistant ratios (r) were determined through metagenomic analysis, as described in our previous work[26]. The resistant ratio (r) was defined as the quotient of CARD (Comprehensive Antibiotic Resistance Database, https://card.mcmaster.ca/)-identified abundance divided by Kaiju (http://kaiju.binf.ku.dk/)-identified abundance for each pathogen. In brief, the microbial taxon was annotated by using the Kaiju, and three WHO priority pathogens - EC, SA and Salmonella typhi (ST)[27] - were detected and then selected as the target pathogens in this study. The ARGs were predicted by mapping sequences to the CARD.
EC (ATCC 700728, Testobio, Zhejiang) was cultured in Nutrient broth, whereas SA [CMCC(B) 26003, Biaomai Biotechnology, Zhejiang] and Salmonella paratyphi B [CMCC(B) 50094, Biaomai Biotechnology, Zhejiang] were cultured in LB broth. All strains were incubated at 37 °C, 200 rpm for 48 h, and DNA was extracted using the Rapid Bacterial Genomic DNA Isolation Kit (Sangon Biotech, Shanghai)[28]. Functional genes of the target pathogens, i.e., rfbE (NCBI GenBank: AF163332.1) of EC, rpoB (NCBI GenBank: KY086782.1) of SA, and invA (NCBI GenBank: M90846.1) of ST, were amplified and verified by polymerase chain reaction (PCR) [Supplementary Tables 1-3][29], and the reaction production was sent to Map Biotech (Shanghai) for plasmid construction. The plasmid solution was stored at -20 °C until standard curves for qPCR were established [Supplementary Figure 1, Supplementary Tables 4 and 5], which were used to determine the absolute quantities of the functional genes of the target pathogens in the water samples. A gamma distribution was applied to simulate pathogen abundance[30].
QMRA
Swimming in contaminated water primarily leads to infections of the gastrointestinal tract, ears, and eyes[31]. This study focused on gastrointestinal infections caused by EC and SA, while infections caused by ST were classified by disease severity for further analysis. As recommended by the WHO[27], infections with third-generation cephalosporin-resistant Escherichia coli (3CEC), carbapenem-resistant Escherichia coli (CREC), methicillin-resistant Staphylococcus aureus (MRSA) and fluoroquinolone-resistant Salmonella typhimurium (FRST) were given particular consideration.
The assumed exposure scenario in this study was oral exposure to pathogens when swimming in inshore water. The exposure dose (D) of pathogens was calculated as[11]:
where I represents the unintentional water intake (mL) per person per case (minimum = 0.00 mL, most probable value = 16.0 mL, maximum = 154 mL)[32]; conc indicates the concentration of functional genes (copies/mL); r is the resistant ratio (%); k signifies the copy number of functional genes in each cell. For the definition of k, the “Number of Matches” parameter of each target gene was extracted using NCBI’s Nucleotide BLAST and assumed to correspond to our k value[21,33,34].
The probability of infection (Pinf) was determined using D[30]:
where α and β are constants for each pathogen. The β value for ST and the α values for all three pathogens were obtained from references[11,35,36], while β for EC and SA was calculated using the median infection dose
All infections were conservatively assumed to develop symptomatic diseases as:
where Pill represents the probability of illness. The outcome metric, DALYs, was used to characterize disease burden[37]:
where YLLs denotes years of life lost and YLDs is years lived with disability. YLLs was calculated as[11]:
where Plethal represents patients’ probability of death, and LYLL indicates the length of years lost, determined by the difference between life expectancy and the age at infection. YLDs of EC and SA was calculated as[11]:
where DW represents disability weight, LC indicates the course of disease, and LD stands for the course from onset to death, which was estimated by the maximum LC. YLDs of ST was calculated as[38]:
where ratio represents the ratio of each degree of severity. All parameters above are shown in Supplementary Table 6.
Derivation and application of environmental thresholds of ARBs
Environmental thresholds (T) of ARBs were derived by employing the QMRA framework, based on an acceptable health burden of 1 × 10⁻⁴ DALYs per person per case, as recommended by the WHO and previous studies[39,40].
DALYs per case was calculated in the same way with Equations (5-8) based on a given Pill = 1. Then, the acceptable Pinf (Pinf-a) and Pill (Pill-a) were calculated using DALYs per case as[11,37,38]:
Finally, the acceptable dose (D-a) and the threshold (T) were calculated as[11,30]:
Hazard quote (HQ) was applied for risk characterization as[41]:
An HQ ≤ 1 indicates an acceptable health risk level, whereas HQ > 1 signifies an unacceptable risk requiring precautionary measures and intervention[41]. Parameters above were set as Table 1.
Parameters in the derivation of environmental thresholds (in aquatic matrices) for four target ARBs
| Parameters | Value | Unit | Ref. |
| k | 1 | / | [33] |
| I | 154 | mL | [32] |
| Life expectancy | 77.9 | Year | [42] |
| Age infected | 30.0 | Year | [11] |
| Dose-response relationship | |||
| EC | |||
| α | 0.155 | / | [11] |
| β | 2.44 × 10⁴ | / | [11] |
| SA | |||
| α | 0.400 | / | [35] |
| β | 5.72 × 10³ | / | [35] |
| ST | |||
| α | 0.890 | / | [36] |
| β | 4.40 × 10⁵ | / | [36] |
| DW | |||
| EC | 0.152 | / | [43] |
| SA | 0.152 | / | [43] |
| ST | |||
| Moderate typhoid fever | 5.10 × 10⁻² | / | [38] |
| Severe typhoid fever | 0.190 | / | [38] |
| Severe typhoid fever with gastrointestinal bleeding-bleeding | 0.462 | / | [38] |
| Severe typhoid fever with gastrointestinal bleeding-fever | 0.190 | / | [38] |
| Typhoid fever with other abdominal complications | 0.442 | / | [38] |
| Plethal | |||
| 3CEC | 3.05 | % | [43] |
| CREC | 5.38 | % | [43] |
| MRSA | 4.74 | % | [43] |
| FRST | 2.30 | % | [38] |
| LC | |||
| 3CEC | 0.0575 | Year | [43] |
| CREC | 0.0740 | Year | [43] |
| MRSA | 0.0521 | Year | [43] |
| FRST | |||
| Moderate typhoid fever | 0.058 | Year | [38,44] |
| Severe typhoid fever | 0.134 | Year | [38,44] |
| Severe typhoid fever with gastrointestinal bleeding-bleeding | 1.00 × 10⁻² | Year | [38,44] |
| Severe typhoid fever with gastrointestinal bleeding-fever | 0.125 | Year | [38,44] |
| Typhoid fever with other abdominal complications | 0.134 | Year | [38,44] |
| LD | |||
| 3CEC | 0.0575 | Year | [43] |
| CREC | 0.0740 | Year | [43] |
| MRSA | 0.0521 | Year | [43] |
| Ratio | |||
| Moderate typhoid fever | 0.350 | / | [38] |
| Severe typhoid fever | 0.430 | / | [38] |
| Severe typhoid fever with gastrointestinal bleeding | 5.00 × 10⁻² | / | [38] |
| Typhoid fever with other abdominal complications | 0.170 | / | [38] |
Sensitivity and statistical analysis
Monte Carlo simulations (n = 10,000) were applied to simulate the probability distributions of the parameters related to exposure levels and health effects. The contribution to variance was used to quantify the influence of each parameter on the overall uncertainty in the QMRA model, thereby identifying the most sensitive variables affecting risk outcomes.
Differences between groups were evaluated using the Mann-Whitney U test (two samples) and the Kruskal-Wallis test (three or more samples). Rank correlation was analyzed by Spearman correlation. All tests were two-sided with a type-I error rate of 0.05, and Bonferroni adjustment was applied for multiple comparisons. Analyses were conducted using SPSS Statistics 27 (IBM Corp., Armonk, NY, USA) and R version 4.4.0.
RESULTS
Concentrations and resistance of target pathogens in the Yangtze Estuary
In the study region, the median (Q1-Q3) concentrations (conc) of EC, SA, and ST were 6.00 × 10⁻² (0.000-0.330), 19.6 (17.6-23.0), and 12.0 (6.53-22.5) copies/mL in high-flow season, and 3.70 (2.25-4.90), 9.40 (2.82-24.6), and 111 (76.0-310) copies/mL in low-flow season [Figure 1C and Supplementary Table 7]. Resistant ratios (r) of EC, SA, and ST were 0.930% (0.450%-3.23%), 0.780% (0.00%-8.79%) in high-flow season, and 0.00% (2.07%-7.86%), and 1.91% (1.11%-13.1%), 0.00% (0.00%-0.00%), and 1.80% (0.950%-6.76%) in low-flow season [Figure 1D and Supplementary Table 7].
Pathogen concentrations and resistant ratios exhibited minimal correlation with spatial or geographical variables, as illustrated in Figure 1. Among the eight sampling sites, LHK exhibited a marked low-flow season prevalence, with a pathogen concentration (ST) of 2.07 × 10³ copies/mL, whereas WSK displayed high-flow season dominance, registering a pathogen concentration (SA) of 65.1 copies/mL. Conversely, SDK, located right between LHK and WSK, and in proximity to a wastewater treatment plant outfall, did not manifest notably elevated contamination levels. Furthermore, no discernible pattern of contamination was observed with respect to upstream or downstream positioning.
Seasonal dynamics of pathogen concentrations exhibited significant interspecies variability in the Yangtze Estuary [Figure 1 and Supplementary Table 7]. EC and ST demonstrated pronounced low-flow season predominance, with median concentrations of 3.70 and 111 copies/mL, compared to high-flow season levels (median = 6.00 × 10⁻² and 12.0 copies/mL, respectively; Mann-Whitney, P < 0.001). In contrast, concentrations of SA showed no seasonal difference (median = 19.6 in high-flow season and 9.40 copies/mL in low-flow season). The concentration of EC was lower than that of SA and ST in high-flow season (Kruskal-Wallis, P = 0.001), and the concentrations of EC and SA were lower than that of ST in low-flow season (Kruskal-Wallis, P = 0.002).
In contrast, the resistant ratios showed no seasonal difference [Figure 1D and Supplementary Table 7]. Similarly, no statistical difference was observed among the resistant ratios of EC, SA, and ST during the high-flow season, with medians ranging from 0.000% to 0.930%. In low-flow season, however, the resistant ratio of SA (median = 0.00%) was significantly lower than those of EC (median = 1.91%) and ST (median = 1.80%; Kruskal-Wallis, P < 0.001).
Environmental thresholds of ARBs and application in risk assessment
Environmental thresholds of the four target ARBs were derived based on an acceptable disease burden at 1 × 10⁻⁴ DALYs per person per case [Table 2]. The magnitude of FRST’s threshold (0.285 copies/mL) was one order higher than that of 3CEC and CREC (6.95 × 10⁻² and 3.95 × 10⁻² copies/mL), and two orders higher than that of MRSA (4.10 × 10⁻³ copies/mL), revealing significant variations of the disease burden per case among the pathogens.
Environmental thresholds of ARBs based on an acceptable disease burden of 1 × 10⁻⁴ DALYs per person per case
| ARBs | Threshold (copies/mL) |
| 3CEC | 6.95 × 10⁻² |
| CREC | 3.95 × 10⁻² |
| MRSA | 4.10 × 10⁻³ |
| FRST | 0.285 |
The environmental thresholds derived were further applied for risk assessment in the study region by Monte Carlo simulations (n = 10,000). Risk levels differed substantially among the four ARBs, especially in high-flow season, with median HQs ranging from 3.80 × 10⁻³ for 3CEC to 37.5 for MRSA. Notably elevated risks were observed for MRSA in high-flow season (median HQ = 37.5) and for all four ARBs in low-flow season (median HQs ranging from 1.00 to 4.38), indicating significant potential health risks [Figure 2].
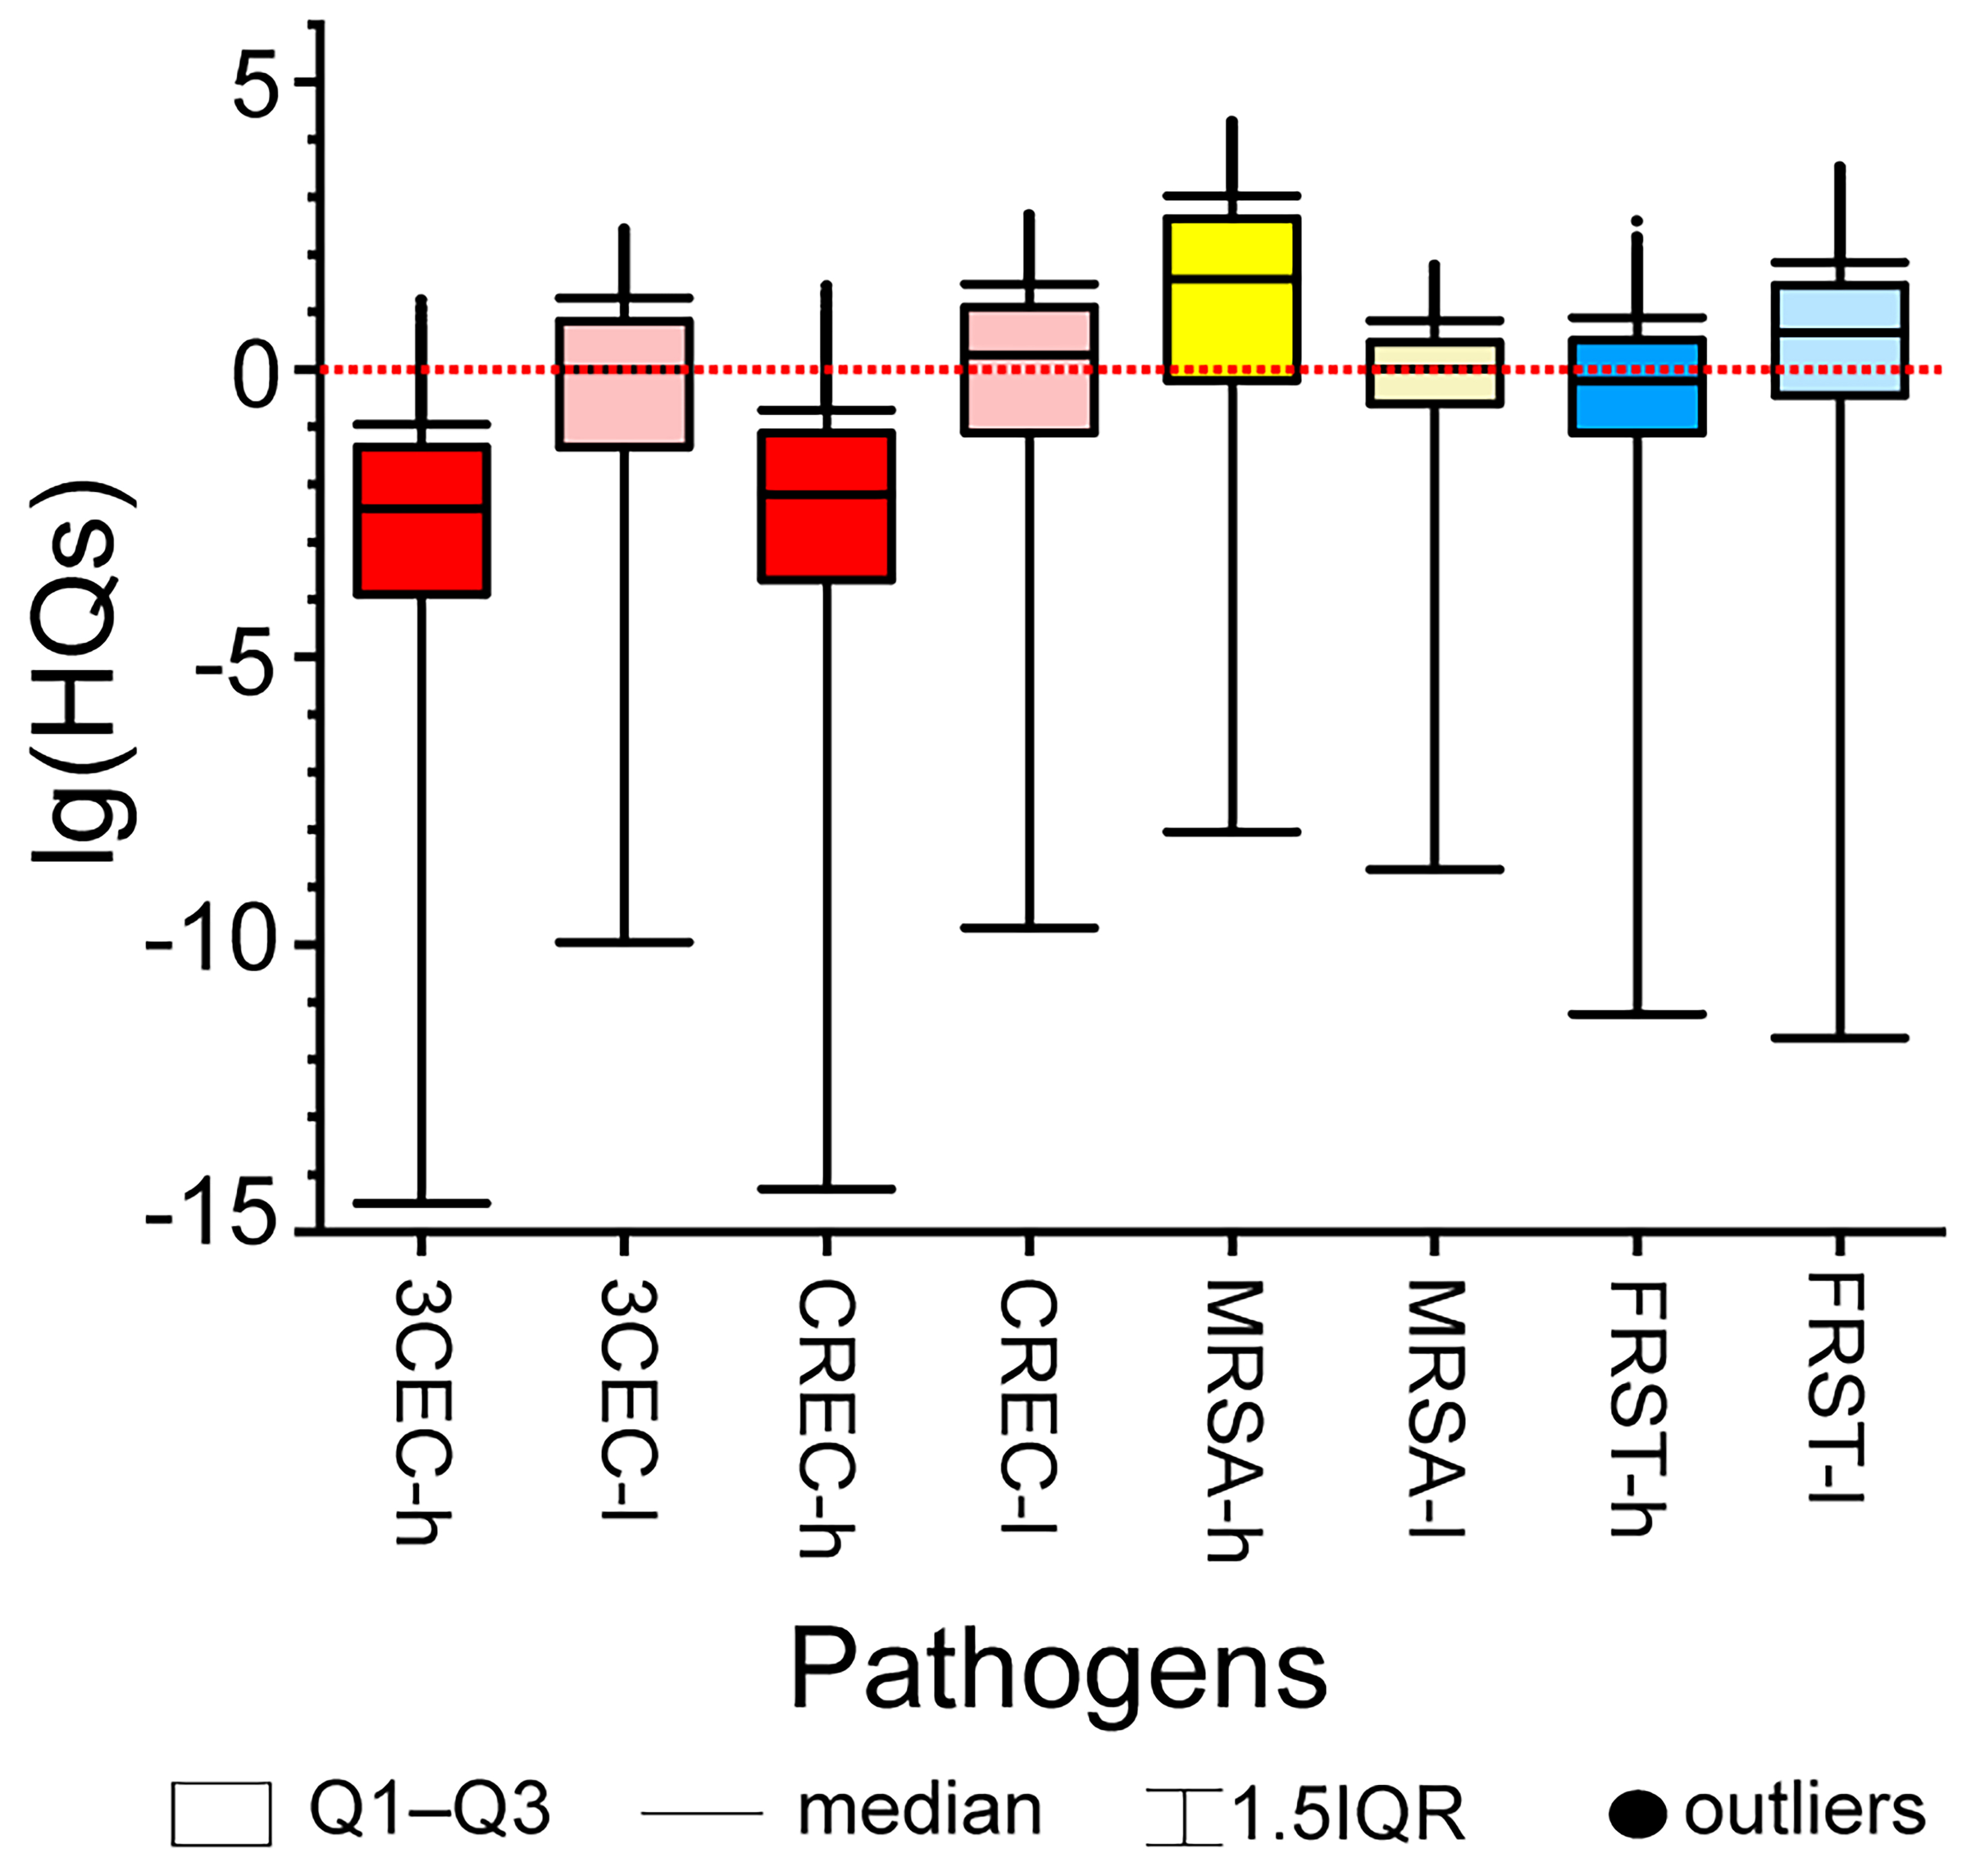
Figure 2. HQs of ARBs in high-flow season and low-flow season. HQs: Hazard quotes; ARBs: antibiotic-resistant bacteria; 3CEC: third-generation cephalosporin-resistant Escherichia coli; CREC: carbapenem-resistant Escherichia coli; MRSA: methicillin-resistant Staphylococcus aureus; FRST: fluoroquinolone-resistant Salmonella typhi; h: high-flow season; l: low-flow season; IQR: interquartile range.
Microbial risks assessment and their temporal trends in the Yangtze Estuary
Herein, we employed QMRA to evaluate risks of general pathogen and ARBs in the Yangtze Estuary and assessed the consistency of the results with the previously calculated HQs based on the environmental thresholds established in this study.
Notable disease burden was observed, as indicated by the Pinfs and DALYs [Figure 3]. The Pinfs values of SA (median = 2.71 × 10⁻² in high-flow season and 1.12 × 10⁻² in low-flow season), low-flow season Pinfs of ST (median = 3.91 × 10⁻³, Q3 = 1.27 × 10⁻²), high-flow season DALYs of ST (median = 2.05 × 10⁻⁴) and MRSA (median = 1.47 × 10⁻⁴), and low-flow season DALYs of ST (median = 1.77 × 10⁻³) and FRST (median = 3.19 × 10⁻⁵, Q3 = 2.42 × 10⁻⁴) were relatively high (Pinf > 0.01, DALY > 1 × 10⁻⁴[39,45]). The disease burden of 3CEC, CREC, and MRSA was not considered concerning based on Pinfs or DALYs in low-flow season, whereas their HQs exceeded notable levels because the thresholds were derived under a worst-case assessment of exposure and health effects.
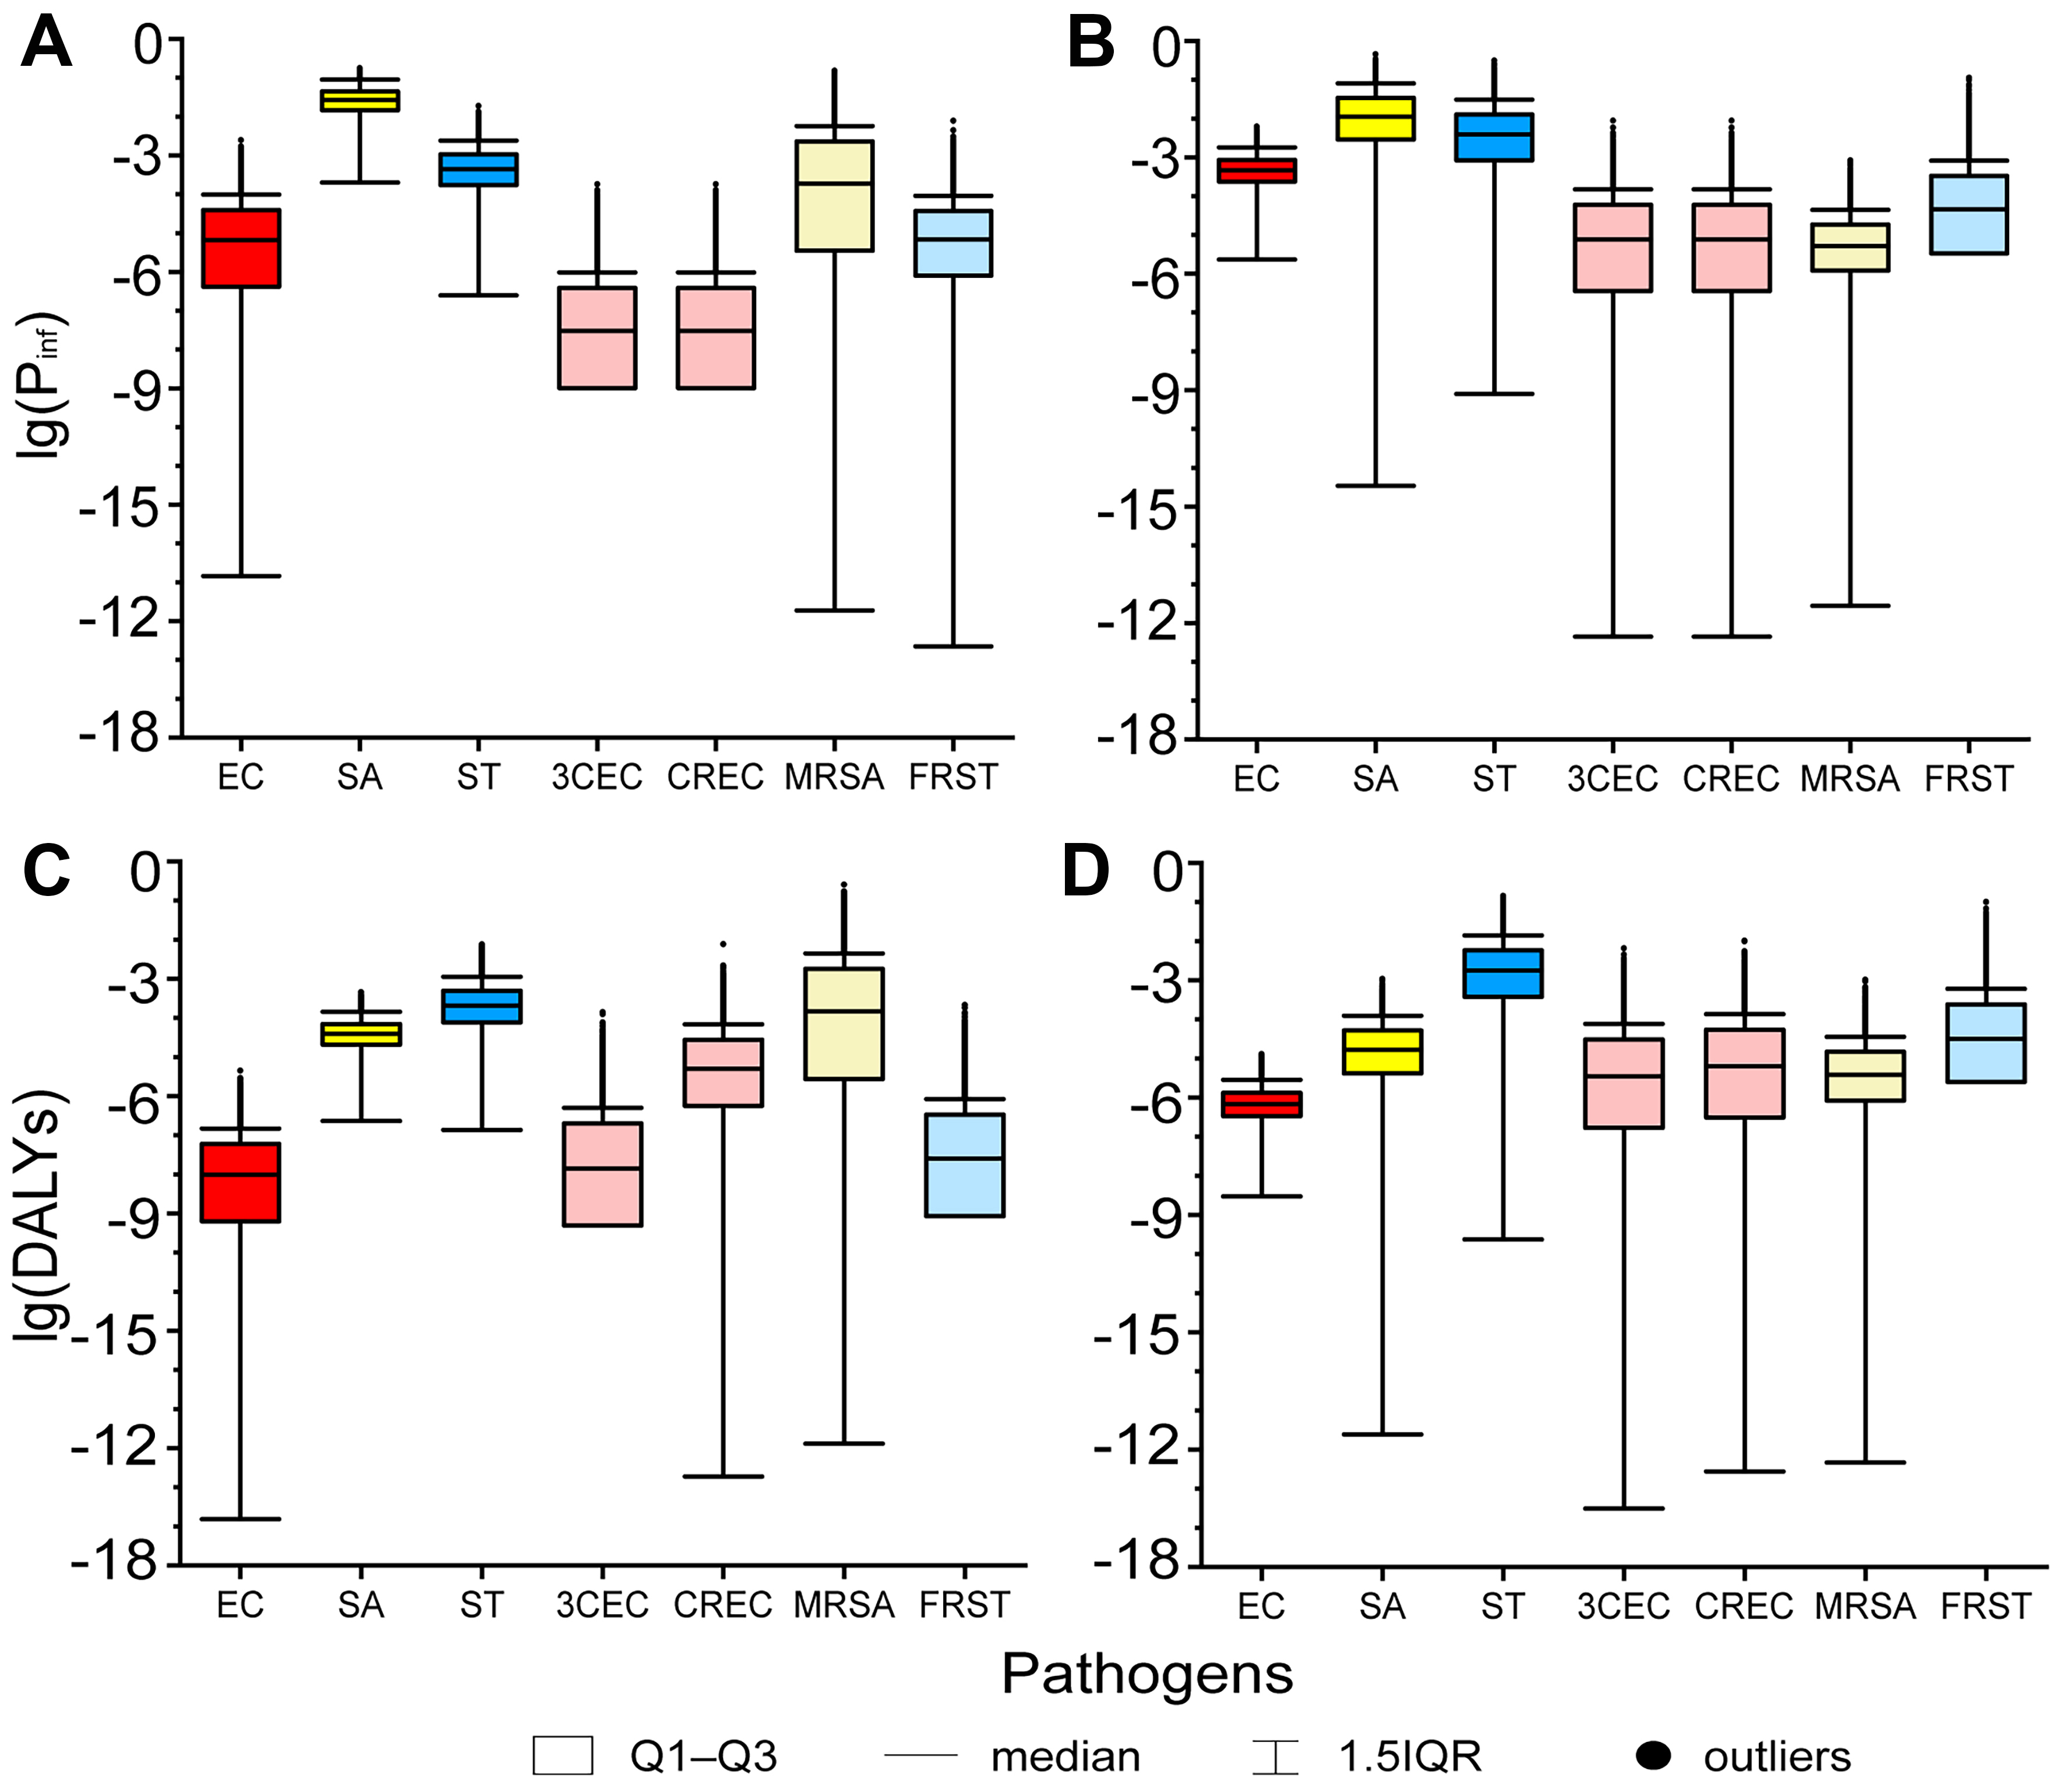
Figure 3. Pinfs and DALYs of general pathogens and ARBs in (A and C) high-flow season and (B and D) low-flow season. Pinfs: The probabilities of infection; DALYs: disability-adjusted life years; ARBs: antibiotic-resistant bacteria; EC: Escherichia coli; SA: Staphylococcus aureus; ST: Salmonella typhi; 3CEC: third-generation cephalosporin-resistant Escherichia coli; CREC: carbapenem-resistant Escherichia coli; MRSA: methicillin-resistant Staphylococcus aureus; FRST: fluoroquinolone-resistant Salmonella typhi; IQR: interquartile range.
The Pinfs and DALYs of EC and ST were significantly higher in low-flow season (median Pinfs = 4.68 × 10⁻⁴ and 3.91 × 10⁻³, median DALYs = 6.82 × 10⁻⁷ and 1.77 × 10⁻³, respectively) than in high-flow season (median Pinfs = 6.62 × 10⁻⁶ and 4.45 × 10⁻⁴, median DALYs = 9.68 × 10⁻⁹ and 2.05 × 10⁻⁴, respectively; Mann-Whitney, P < 0.001). In contrast, Pinfs and DALYs of SA were significantly higher in high-flow season (median Pinf = 2.71 × 10⁻², median DALYs = 3.93 × 10⁻⁵) than in low-flow season (median Pinf = 1.12 × 10⁻², median DALYs = 1.68 × 10⁻⁵; Mann-Whitney, P < 0.001). The seasonal trends of ARBs’ disease burden were consistent with those of the corresponding general pathogens. The Pinfs and DALYs of 3CEC, CREC, and FRST were significantly higher in low-flow season than in high-flow season (median Pinfs = 3.01 × 10⁻⁸, 3.01 × 10⁻⁸, 6.82 × 10⁻⁶ in high-flow season and 7.61 × 10⁻⁶, 7.61 × 10⁻⁶, 4.56 × 10⁻⁵ in low-flow season; median DALYs = 1.42 × 10⁻⁸, 5.00 × 10⁻⁶, 2.56 × 10⁻⁸ in high-flow season and 3.50 × 10⁻⁶, 6.38 × 10⁻⁶, 3.19 × 10⁻⁵ in low-flow season), while those of MRSA were quite the contrary (median Pinfs = 1.90 × 10⁻⁴ in high-flow season and 5.14 × 10⁻⁶ in low-flow season; median DALYs = 1.47 × 10⁻⁴ in high-flow season and 3.85 × 10⁻⁶ in low-flow season; Mann-Whitney, P < 0.001). The observed seasonal fluctuations in disease burden exhibited strong concordance with the aforementioned HQs, where 3CEC, CREC, and FRST demonstrated significantly elevated risk profiles during low-flow season compared to high-flow season, while MRSA exhibited a pronounced seasonal inversion (Mann-Whitney, P < 0.001).
Sensitivity analysis
Sensitivity analysis was performed for a total of 14 QMRA models, including those for three general pathogens and four ARBs in both seasons [Figure 4]. Exposure level, characterized by parameters such as pathogen concentration (conc), resistant ratio (r), and water intake (I), was the main source of variation. The conc parameter was the most influential factor for EC and ST models in high-flow season (contribution to variance = 0.920 and 0.610), and for SA and ST models in low-flow season (contribution to variance = 0.770 and 0.810). In contrast, water intake (I) was the most influential factor for the SA model in the high-flow season and the EC model in the low-flow season (contribution to variance = 0.630 and 0.530). Among the four ARBs, either pathogen abundance (conc) or the resistance ratio (r) emerged as the dominant explanatory variables, collectively accounting for 75.9%-94.5% of the total variance observed. Contrary to the exposure level, parameters related to health effects, such as probability of death (Plethal), disability weight
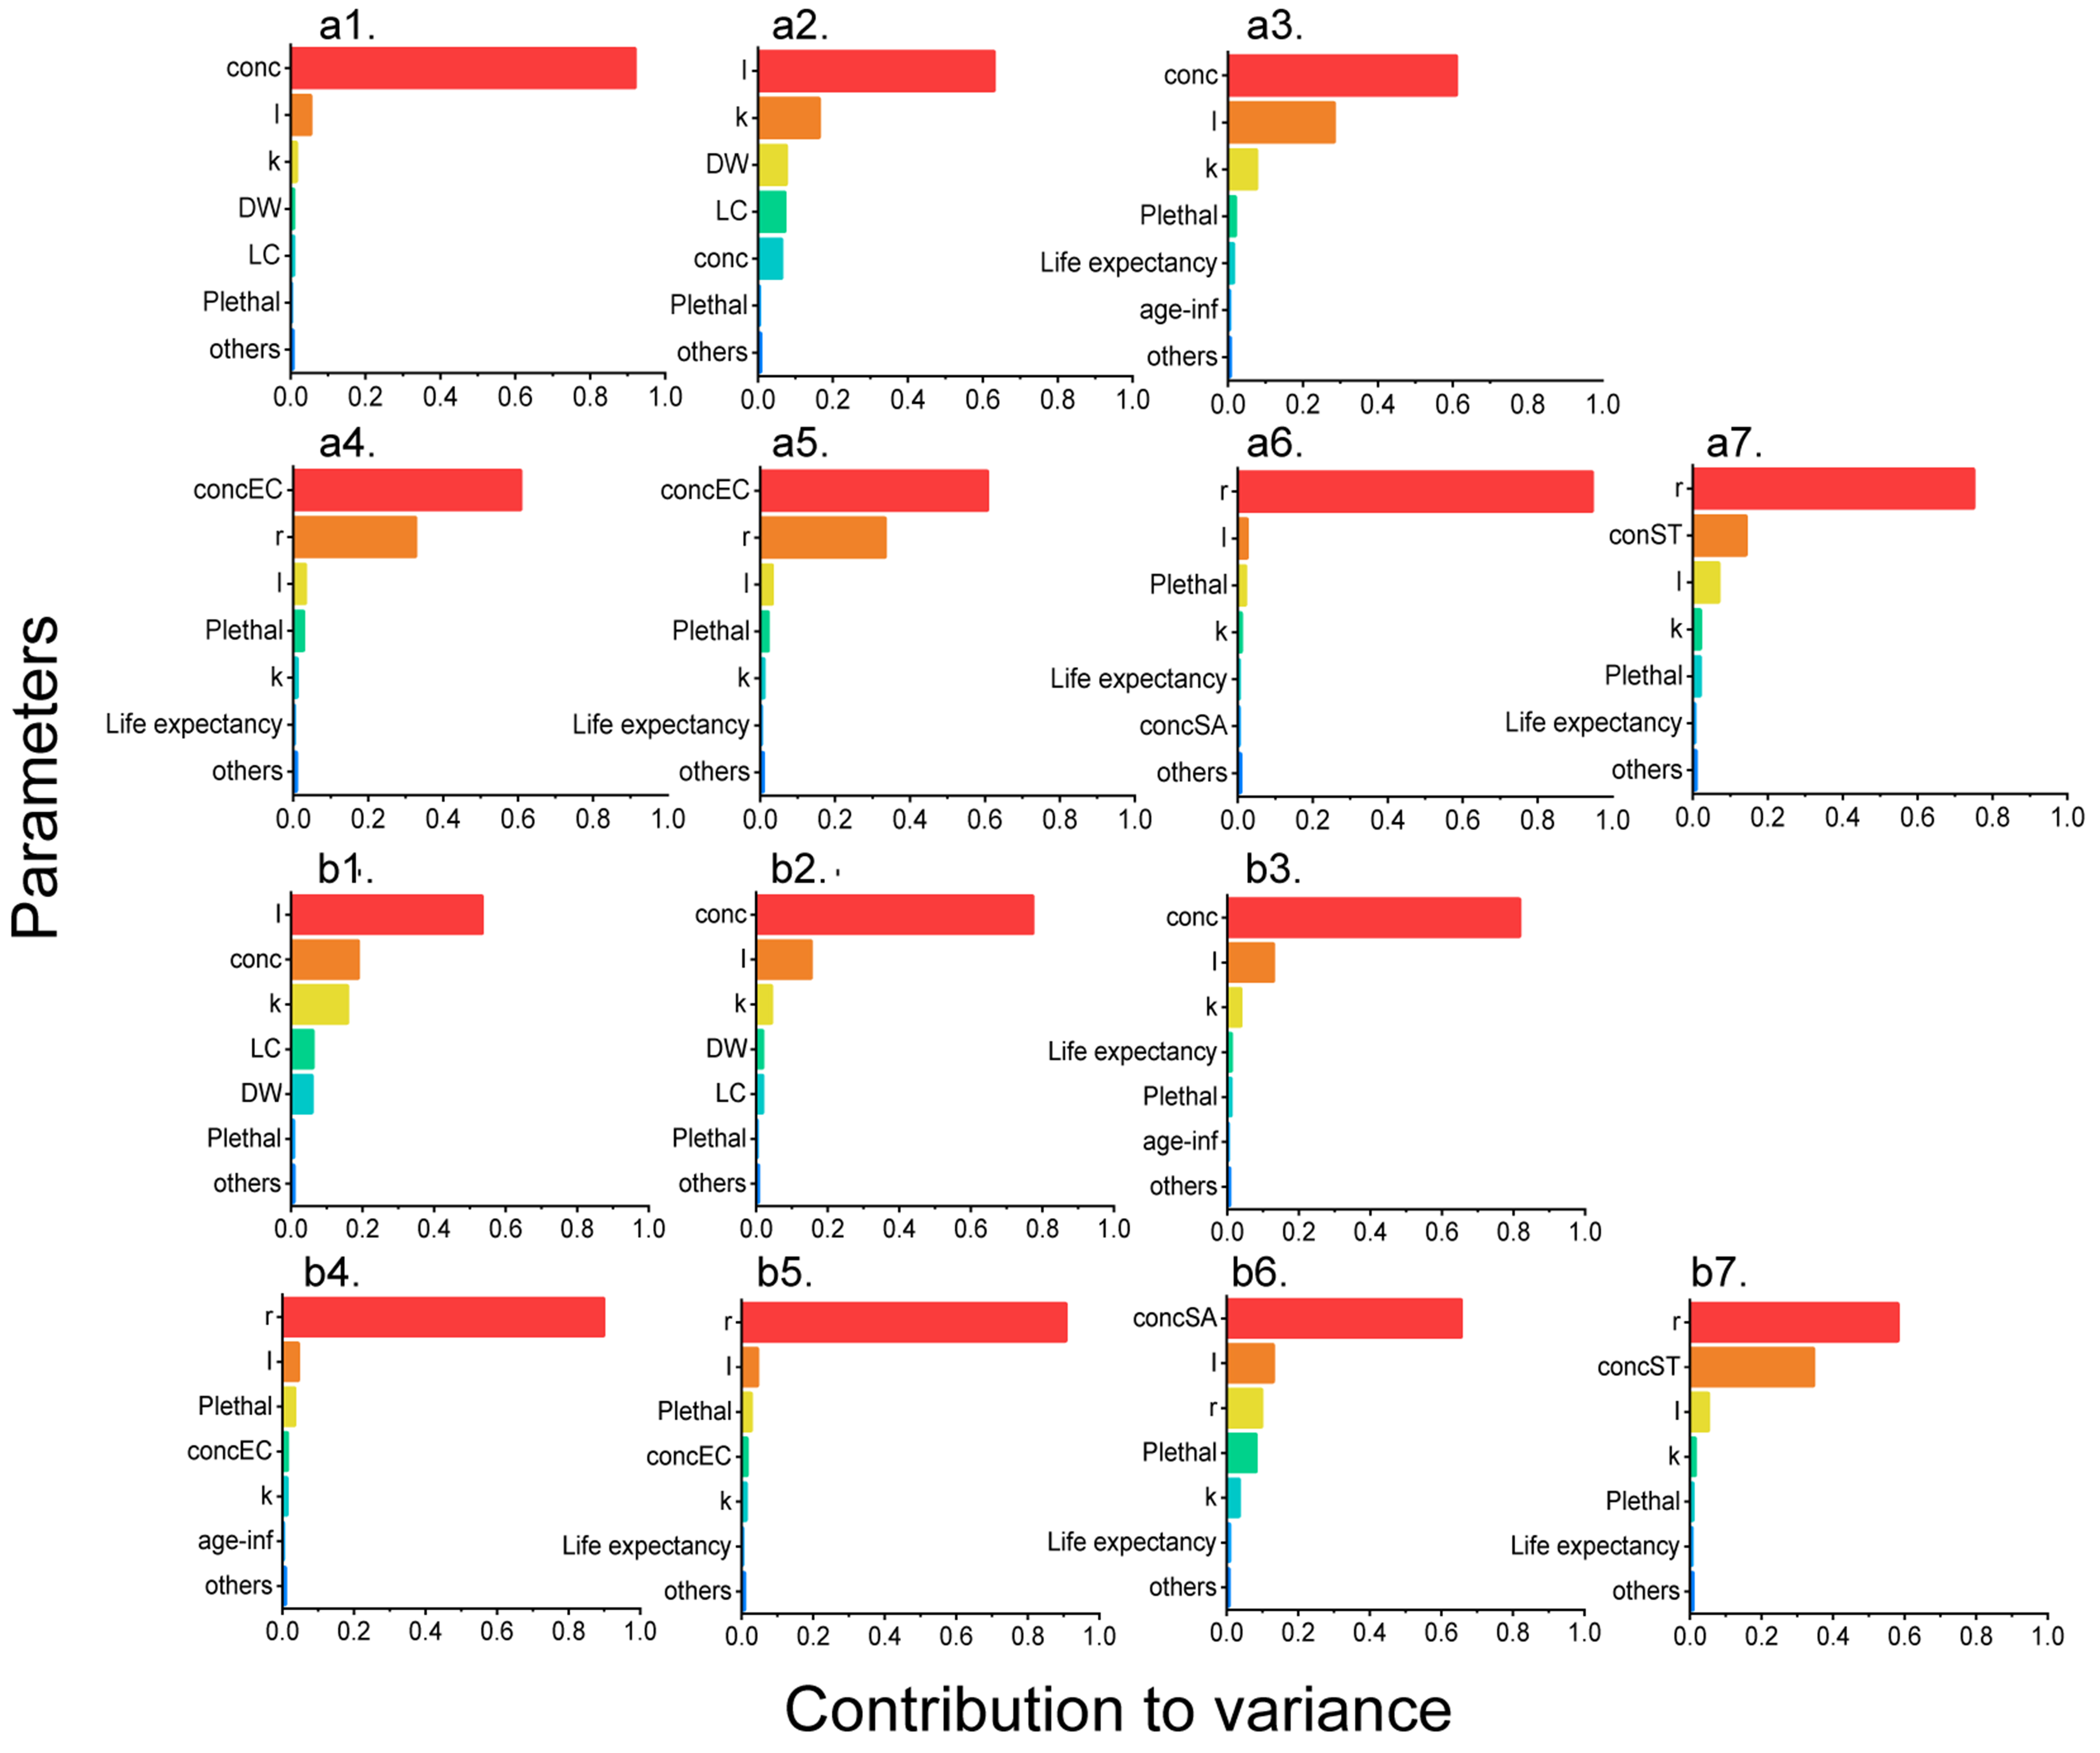
Figure 4. Sensitivity analysis of QMRA models of EC, SA, ST, 3CEC, CREC, MRSA, and FRST in (a1-a7) high-flow season and (b1-b7) low-flow season. QMRA: Quantitative microbial risk assessment; EC: Escherichia coli; SA: Staphylococcus aureus; ST: Salmonella typhi; 3CEC: third-generation cephalosporin-resistant Escherichia coli; CREC: carbapenem-resistant Escherichia coli; MRSA: methicillin-resistant Staphylococcus aureus; FRST: fluoroquinolone-resistant Salmonella typhi; conc: concentration of target pathogen; I: water intake; k: the copy number of functional genes in each cell; DW: disability weight; LC: course of disease; Plethal: probability of death; age-inf: age infected; r: resistant ratio.
DISCUSSION
This study employed QMRA to derive environmental thresholds, quantify health risks, and estimate disease burden associated with 3CEC, CREC, MRSA, and FRST. The health risk metrics (HQs) demonstrated strong concordance with disease burden indicators (Pinfs and DALYs), although the HQs-based assessment yielded more stringent evaluations compared to burden-based approaches. Seasonal monitoring in the Yangtze Estuary revealed that the general EC and ST concentrations were significantly higher in low-flow season than in high-flow season. Pathogen-specific seasonal patterns emerged: MRSA exhibited high-flow season dominance across all three metrics (HQs, Pinfs, and DALYs), whereas the other three ARBs showed low-flow season dominance. Notably, high-flow season DALYs for MRSA and low-flow season DALYs for FRST exceeded the threshold of 1 × 10⁻⁴ DALYs per person per case, while the HQ-based framework identified significant health risks (HQs > 1) for MRSA in high-flow season and for all four ARBs in low-flow season.
Quantification of the pathogens and ARBs in the literature
In our results, the abundance of the general EC, SA and ST ranged from 6.00 × 10⁻² to 111 copies/mL. Relatively high health risks from both ARBs and general pathogens were detected in the Yangtze Estuary
Spatial-temporal trends of aquatic pathogens and ARBs in the Yangtze Estuary
In this study, contamination by target pathogens and ARBs was jointly characterized using general pathogen concentrations (conc) and resistant ratios (r). As detailed in Section “Concentrations and resistance of target pathogens in the Yangtze Estuary”, WSK and LHK exhibited pronounced high-flow season dominance in pathogen concentrations, whereas WSK and LHK displayed elevated resistant ratios in high-flow season, with WSK, SDK, and QYK showing higher low-flow season prevalence of resistance [Figure 1]. Notably, these high-contamination sites, all located on the northern coasts of Taicang and Shanghai, are spatially associated with agricultural lands (QYK and LHK) and major ports (SDK and WSK), either at river-estuary confluences (WSK, LHK, QYK) or adjacent to wastewater treatment plant outfalls (SDK). These findings strongly suggest that anthropogenic activities serve as the primary contamination source, with land-use patterns and hydrological connectivity jointly modulating seasonal contamination dynamics[48,49].
A slight seasonal variation of pathogen abundance was found in this study, with concentrations of EC and ST significantly higher in low-flow season (median = 3.70 and 111 copies/mL, respectively) than in high-flow season (median = 6.00 × 10⁻² and 12.0 copies/mL, respectively; Mann-Whitney, P < 0.001), whereas SA concentrations did not vary seasonally. According to previous literature, the abundance of various aquatic pollutants, including bacteria[48], antibiotics[50], ARGs[51], and heavy metals[52], was generally higher in low-flow season than in high-flow season. The seasonal discrepancy might be attributed to the reduction in river water volume and the presence of unique pollution sources specific to the low-flow season (winter)[52]. For example, studies on sewage indicated that the abundance of ARGs discharged in winter (low-flow season) was relatively high[53], while the discharge level of antibiotics was comparatively low in summer (high-flow season)[54]. Our results for EC and ST were consistent with these seasonal trends, whereas SA suggested that the inherent characteristics of pathogens also played an important role in determining their abundance. SA, which belonged to the phylum Firmicutes and could adapt to high-salinity environments, was widely distributed in seawater and had been reported to increase sharply in a tidal estuary during summer (high-flow season), while Proteobacteria bacteria such as EC and ST did not[48]. Hence, it could be postulated that these opposing effects together resulted in the present observation that there was no significant difference in the abundance of SA between high- and low-flow seasons. However, inconsistent findings have been documented across studies including the present investigation regarding surface water contamination[51,55] and sediment contamination[51,56], with temporal patterns of antibiotic resistance remaining insufficiently characterized and warranting further systematic investigation.
Health risks of aquatic pathogens and ARBs in the literature
In this study, QMRA was employed to evaluate severe health risks associated with recreational water use, a method that has been predominantly utilized for assessing pathogen-mediated health risks across diverse aquatic environments. A study by Pan revealed that under a 5-log removal efficiency, the maximum Pinf of EC for direct drinking in the Yangtze Estuary’s water sources was 3.41 × 10⁻⁵, whereas Pseudomonas aeruginosa under a 4-log removal efficiency had a maximum Pinf of 8.01 × 10⁻⁵[12]. Schoen et al. applied QMRA to model the risk and disease burden for healthy adults exposed to MRSA or antibiotic-susceptible SA through residential and municipal non-potable and potable uses of reclaimed water, highlighting the influence of pathogen removal efficiency, as also reported by Pan[9]. Chen et al. evaluated the health risks to workers exposed to EC and SA bioaerosols in wastewater treatment plants and concluded that personal protective equipment could significantly reduce these risks to acceptable levels[57]. These studies collectively warned of the specific risks in recreational water use, when pathogenic elimination and personal protection were usually absent.
As a matter of fact, our assessment was based on specimens collected from eight junctions of tributaries or ports along the Yangtze Estuary, at least one of which (SDK) was near a wastewater treatment plant outfall. The median Pinfs of general pathogens in this study were estimated to range from 6.62 × 10⁻⁶ to 2.71 × 10⁻². For EC, Pinfs were 6.62 × 10⁻⁶ in high-flow season and 4.68 × 10⁻⁴ in low-flow season, close to values reported for Brazilian beaches (Pinfs of diarrheagenic EC ranged 2.83 × 10⁻⁵-3.43 × 10⁻⁴ during 2005-2007)[46]. Pinfs attributable to wildlife (gull) feces and sewer discharge at bathing beaches were estimated at 1.00 × 10⁻⁶-1.00 × 10⁻⁴ and 1.00 × 10⁻⁴-1.00 × 10⁻², respectively[58]. Moreover, epidemiological evidence revealed that swimming in unhygienic water led to eye infection, skin infection and gastrointestinal diseases including diarrhea[59-61]. These results revealed the notable health risks and outcomes in recreational water use, and risk assessment for recreational water held particular significance.
Challenges in ARB’s QMRA and the deviation of thresholds
In this study, sensitivity analysis demonstrated that the parameters conc and r were the primary contributors to output variability, indicating robust model performance in other components and supporting the validity of QMRA-derived thresholds for recreational water safety management. Besides, the influential role of conc and r also suggested the necessity of frequent surveillance and accurate detection in practice. It is important to acknowledge that, unlike culture-based QMRA studies which rely on CFU counts for dose-response assessment, our molecular approach (qPCR and metagenomic sequencing) does not directly generate this established metric[11,16,17]. This distinction, however, reflects an ongoing methodological evolution in exposure assessment, wherein genetic markers from qPCR and metagenomics are increasingly employed as validated surrogates for traditional culture-based quantification[21,22]. Given this constraint inherent to molecular quantification, we sought to strengthen the external comparability of our results through cross-validation with an independent study from a geographically analogous region, thereby bolstering confidence in the robustness of our findings[12]. Moreover, the methodological advantages are evident: it enables high-throughput processing, operational efficiency, and rapid turnaround times, thereby offering a superior alternative to culture-based approaches for frequent surveillance due to its capacity to meet time-sensitive demands. Furthermore, its compatibility with archived specimens facilitates retrospective risk assessment, allowing for the integration of longitudinal data to enhance the granularity and predictive power of epidemiological models.
Despite the exposure assessment, another challenge lies in the dose-response relationship. Most QMRA studies of ARBs to date have assumed that the dose-response parameters of ARBs and antibiotic-susceptible strains are identical.[9,11,12,62]. It has been suggested that the pathogenicity of ARBs may exceed that of antibiotic-susceptible strains[63]. However, a previous study suggested that antibiotic resistance and virulence were not independent traits but could be negatively or positively correlated[64]. Nevertheless, the direction and strength of these correlations remain poorly understood, and empirical data on the dose-response relationship in humans are still lacking. Thus, the dose-response modeling framework for ARBs in aquatic environments remains subject to critical methodological uncertainties. Specifically, two unresolved issues significantly affect the accuracy of risk estimation: (1) dose metric selection: whether to use ARBs-specific concentrations (as implemented in this study) or general pathogen loads (including susceptible strains) as the exposure input[9,11]; and (2) resistance ratio integration: the extent to which the population-level r modifies the dose-response relationship of the general pathogen consortium remains poorly quantified. These methodological ambiguities create a risk estimation paradox of ARBs: while ARBs-specific models may underestimate true infection risks by excluding susceptible strains that could acquire resistance in situ, general pathogen models risk overestimation by assuming uniform virulence across strains [Figure 3]. Moreover, meticulous hazard identification is imperative when conducting QMRA to establish scientifically robust thresholds for ARBs. In this study, we supposed gastrointestinal infections to be the main source of disease burden in bathing beaches, as a previous study did[46].
However, alternative infections including bloodstream infections, respiratory infections, and urinary tract infections may be more relevant for hazard identification under specific exposure scenarios, such as surfing (where cutaneous exposure to marine pathogens is elevated) or occupational exposure in wastewater treatment plants (where aerosolized pathogens pose inhalation risks)[11,57]. This context-dependent prioritization aligns with the overarching principle of “fit-for-purpose” QMRA, which emphasizes tailoring analytical frameworks to exposure-pathway-specific risks[10].
Study strengths and limitations
In this study, QMRA was conducted for risk assessment, and we applied a qPCR-metagenomics approach to quantify general pathogens and ARBs. This method is high-throughput, efficient, and rapid, making it suitable for frequent surveillance and applicable to archived specimens, thereby enabling a more comprehensive risk assessment. We characterize risks using threshold-based HQs, as well as Pinfs and DALYs. Comparison of these results demonstrated that the HQs approach was consistent with the Pinfs-DALYs approach, while being slightly more conservative. To enhance the spatial-temporal representativeness of the case study and provide robust empirical support for the derived exposure thresholds, longitudinal sampling was conducted across high- and low-flow seasons in the Yangtze Estuary. This design enabled the capture of seasonal variations in the target pathogens’ prevalence. Our results indicated that current MRSA exposure levels in the estuarine environment pose an urgent public health threat, necessitating immediate implementation of evidence-based risk mitigation strategies.
This study also identifies several limitations. First, exposure assessment via qPCR-metagenome may be less reliable than culture-based quantification. We addressed this by validating our results through comparison with studies using identical methods in similar spatiotemporal contexts. Second, the dose-response relationship might not fully account for virulence differences between ARBs and susceptible strains. We conducted sensitivity analysis using worst-case virulence assumptions and explicitly highlighted this uncertainty in our risk interpretations. Finally, due to limited China-specific data, we had to extrapolate health effects from European Union (EU) populations. We minimized this limitation by restricting our study population to the Yangtze River Delta where socioeconomic conditions and healthcare infrastructure are comparable to those in the EU reference populations. Despite these limitations, our study establishes a novel framework for deriving ARB thresholds and provides critical insights for diverse stakeholders, including policy-makers, risk assessment professionals, public health researchers, and environmental scientists, offering a science-based foundation for AMR management and public health decision-making.
CONCLUSIONS
Environmental thresholds of ARBs were derived based on an acceptable burden of 1 × 10⁻⁴ DALYs per person per case in the framework of QMRA, and HQs were employed to characterize the risks. Health risks and disease burden of ARBs were noteworthy in the Yangtze Estuary, especially MRSA. Sensitivity analysis revealed that the abundance of pathogens was the most influential factor on QMRA models, highlighting the necessity of frequent surveillance and accurate detection in practice.
DECLARATIONS
Authors’ contributions
Conceptualization: Zhang, X.; Guo, X.; Huang, Y.; Lin, N.
Methodology, data analysis, and draft preparation: Zhang, X.; Guo, X.; Lin, N.
Sampling: Guo, X.; Lin, N.
Investigation: Zhang, X.; Guo, X.
Resources, supervision, administration, and funding acquisition: Lin, N.; Huang, Y.
Review and editing: Zhang, X.; Guo, X.; Huang, Y.; Lin, N.
Availability of data and materials
Information related to this article can be found in the Supplementary Materials. Further data are available from the corresponding author upon reasonable request.
Financial support and sponsorship
This work was supported by the National Key Research and Development Program of China (grant 2022YFC3105800) and the National Natural Science Foundation of China (grant 42307545).
Conflicts of interest
Lin, N. is the Editorial Board Member of Journal of Environmental Exposure Assessment. Lin, N. had no involvement in the review or editorial process of this manuscript, including but not limited to reviewer selection, evaluation, or the final decision. The other authors declare that there are no conflicts of interest.
Ethical approval and consent to participate
Not applicable.
Consent for publication
Not applicable.
Copyright
© The Author(s) 2025.
Supplementary Materials
REFERENCES
1.
2. Jian, Z.; Zeng, L.; Xu, T.; et al. Antibiotic resistance genes in bacteria: occurrence, spread, and control. J. Basic. Microbiol. 2021, 61, 1049-70.
3. Resistance Collaborators. Global burden of bacterial antimicrobial resistance in 2019: a systematic analysis. Lancet 2022, 399, 629-55.
4. Kozak, S.; Roiko, A.; Gutjahr-Holland, K.; et al. The use of faecal indicator organisms to manage microbial health risks in recreational waterways not impacted by point sources of sewage: a systematic review of the epidemiological evidence. J. Water. Health. 2025, 23, 563-86.
5. Fewtrell, L.; Kay, D. Recreational water and infection: a review of recent findings. Curr. Environ. Health. Rep. 2015, 2, 85-94.
6. Lowry, S. A.; Steele, J. A.; Griffith, J. F.; Schiff, K. C.; Boehm, A. B. Simulated gastrointestinal risk from recreational exposure to Southern California stormwater and relationship to human-associated Bacteroidales marker HF183. Environ. Sci. Process. Impacts. 2025, 27, 718-28.
7.
8. Dong, Q. L.; Barker, G. C.; Gorris, L. G.; Tian, M. S.; Song, X. Y.; Malakar, P. K. Status and future of quantitative microbiological risk assessment in China. Trends. Food. Sci. Technol. 2015, 42, 70-80.
9. Schoen, M. E.; Jahne, M. A.; Garland, J.; Ramirez, L.; Lopatkin, A. J.; Hamilton, K. A. Quantitative microbial risk assessment of antimicrobial resistant and susceptible Staphylococcus aureus in reclaimed wastewaters. Environ. Sci. Technol. 2021, 55, 15246-55.
10.
11. Goh, S. G.; Haller, L.; Ng, C.; et al. Assessing the additional health burden of antibiotic resistant Enterobacteriaceae in surface waters through an integrated QMRA and DALY approach. J. Hazard. Mater. 2023, 458, 132058.
12. Pan, H. C. Characterization and potential health risk of typical culturable bacteria in drinking water sources in Shanghai. Ph.D. Dissertation, East China University of Science and Technology, Shanghai, China, 2024. https://xueshu.baidu.com/ndscholar/browse/detail?paperid=16060mp08n1y00f05m3b0eh0vh094500 (accessed 2025-12-01).
13. Chen, J.; Karanth, S.; Pradhan, A. K. Quantitative microbial risk assessment for Salmonella: inclusion of whole genome sequencing and genomic epidemiological studies, and advances in the bioinformatics pipeline. J. Agric. Food. Res. 2020, 2, 100045.
14. Njage, P. M. K.; Leekitcharoenphon, P.; Hansen, L. T.; et al. Quantitative microbial risk assessment based on whole genome sequencing data: case of Listeria monocytogenes. Microorganisms 2020, 8, 1772.
15. Dean, K.; Mitchell, J. Reverse QMRA for Pseudomonas aeruginosa in premise plumbing to inform risk management. J. Environ. Eng. 2020, 146, 04019120.
16. Delair, Z.; Schoeman, M.; Reyneke, B.; Singh, A.; Barnard, T. G. Assessing the impact of Escherichia coli on recreational water safety using quantitative microbial risk assessment. J. Water. Health. 2024, 22, 1781-93.
17. Denpetkul, T.; Srathongneam, T.; Sittipunsakda, O.; et al. Protective masks reduced gastrointestinal risks of antibiotic-resistant E. coli for hospital wastewater treatment plant workers: a quantitative microbial risk assessment. Environ. Pollut. 2025, 374, 126180.
18. Prasad, D. K.; Shukla, R.; Ahammad, S. Z. Antibiotic resistance in the Ganga river: investigation of antibiotic resistant bacteria and antibiotic resistance genes, and public health risk assessment. J. Environ. Chem. Eng. 2024, 12, 114931.
19. Heida, A.; Hamilton, M. T.; Gambino, J.; et al. Population ecology-quantitative microbial risk assessment (QMRA) model for antibiotic-resistant and Susceptible E. coli in recreational water. Environ. Sci. Technol. 2025, 59, 4266-81.
20. Burch, T. R.; Stokdyk, J. P.; Durso, L. M.; Borchardt, M. A. Quantitative microbial risk assessment for ingestion of antibiotic resistance genes from private wells contaminated by human and livestock fecal sources. Appl. Environ. Microbiol. 2024, 90, e0162923.
21. Denissen, J.; Reyneke, B.; Barnard, T.; Khan, S.; Khan, W. Risk assessment of Enterococcus faecium, Klebsiella pneumoniae, and Pseudomonas aeruginosa in environmental water sources: development of surrogate models for antibiotic resistance genes. Sci. Total. Environ. 2023, 901, 166217.
22. Zhang, Z.; Teng, M.; Zhao, L.; et al. Metagenome-informed QMRA and resistome profiling reveal hidden health risks in Yongding River wastewater. Water. Research. X. 2025, 29, 100403.
23. Wu, Z.; Chen, R.; Meadows, M. E.; Liu, X. Application of the Ocean Health Index to assess ecosystem health for the coastal areas of Shanghai, China. Ecological. Indicators. 2021, 126, 107650.
24.
25. National Catalogue Service For Geographic Information. 1:1 Million Public Version Fundamental Geographic Information Data (2021). https://www.webmap.cn/commres.do?method=result100W (accessed 2025-12-01).
26. Guo, X.; Sha, R.; Wang, Y.; et al. ZnO nanorod coatings attenuate antibiotic resistance genes (ARGs) on their surface biofilms in estuarine environment. J. Environ. Chem. Eng. 2024, 12, 112877.
27.
28. Chen, F.; Hu, X.; Hong, Z.; et al. Screening, identification, and fermentation optimization of the antagonistic actinomycete strain TCS21-117 against Botrytis cinerea. Microorganisms 2025, 13, 379.
29. Wang, H.; Zuo, J. W.; Yang, X. J.; Wang, S. Detection of salmonella, staphylococcus aureus and Escherichia coli O157: H7 by triple fluorescent PCR. Journal of Food Safety & Quality 2021;12:9. https://xueshu.baidu.com/ndscholar/browse/detail?paperid=1t0f0th0as7m04e0fw0g04c0n3672066 (accessed 2025-12-01).
30. Haas, C. N.; Rose, J. B.; Gerba, C. P. Quantitative microbial risk assessment. https://onlinelibrary.wiley.com/doi/book/10.1002/9781118910030 (accessed 2025-12-01).
31. Luo, Q.; Yang, H.; Qian, H.; Li, L.; Wei, H. Status and influential factors of water-borne diseases in bathing beaches in three cities of China from 2019 to 2020. Wei. Sheng. Yan. Jiu. 2021, 50, 472-5.
32. Dufour, A. P.; Evans, O.; Behymer, T. D.; Cantú, R. Water ingestion during swimming activities in a pool: a pilot study. J. Water. Health. 2006, 4, 425-30.
33. Zhu, Y. G.; Zhao, Y.; Li, B.; et al. Continental-scale pollution of estuaries with antibiotic resistance genes. Nat. Microbiol. 2017, 2, 16270.
34. Klappenbach, J. A.; Saxman, P. R.; Cole, J. R.; Schmidt, T. M. rrndb: the ribosomal RNA operon copy number database. Nucleic. Acids. Res. 2001, 29, 181-4.
35. Schoen, M. E.; Peckham, T. K.; Shirai, J. H.; et al. Risk of nasal colonization of methicillin-resistant Staphylococcus aureus during preparation of contaminated retail pork meat. Microb. Risk. Anal. 2020, 16, 100136.
36. Teunis, P. F.; Nagelkerke, N. J.; Haas, C. N. Dose response models for infectious gastroenteritis. Risk. Anal. 1999, 19, 1251-60.
37.
38. 2017 Typhoid and Paratyphoid Collaborators. The global burden of typhoid and paratyphoid fevers: a systematic analysis for the Global Burden of Disease Study 2017. Lancet. Infect. Dis. 2019, 19, 369-81.
39. Mara, D. Water- and wastewater-related disease and infection risks: what is an appropriate value for the maximum tolerable additional burden of disease? J. Water. Health. 2011, 9, 217-24.
40. Azuma, T.; Murakami, M.; Sonoda, Y.; Ozaki, A.; Hayashi, T. Occurrence and quantitative microbial risk assessment of methicillin-resistant Staphylococcus aureus (MRSA) in a sub-catchment of the Yodo River Basin, Japan. Antibiotics 2022, 11, 1355.
41.
42.
43. Cassini A, Högberg LD, Plachouras D, et al; Burden of AMR Collaborative Group. Attributable deaths and disability-adjusted life-years caused by infections with antibiotic-resistant bacteria in the EU and the European Economic Area in 2015: a population-level modelling analysis. Lancet Infect Dis. 2019;19:56-66.
44. Bhutta, Z. A. Impact of age and drug resistance on mortality in typhoid fever. Arch. Dis. Child. 1996, 75, 214-7.
45. USEPA. Ambient water quality criteria for bacteria - 1986. https://19january2021snapshot.epa.gov/sites/static/files/2019-03/documents/ambient-wqc-bacteria-1986.pdf (accessed 2025-12-01).
46. Rodrigues, V. F. V.; Rivera, I. N. G.; Lim, K. Y.; Jiang, S. C. Detection and risk assessment of diarrheagenic E. coli in recreational beaches of Brazil. Mar. Pollut. Bull. 2016, 109, 163-70.
47. Regnier, A. P.; Park, R. W. Faecal pollution of our beaches--how serious is the situation? Nature 1972, 239, 408-10.
48. Zhang, Y.; Liu, L.; Liu, Y.; et al. Deciphering the natural and anthropogenic drivers on the fate and risk of antibiotics and antibiotic resistance genes (ARGs) in a typical river-estuary system, China. J. Hazard. Mater. 2024, 480, 136006.
49. Gao, F. Z.; He, L. Y.; Hu, L. X.; et al. The variations of antibiotics and antibiotic resistance genes in two subtropical large river basins of south China: anthropogenic impacts and environmental risks. Environ. Pollut. 2022, 312, 119978.
50. Cheng, D.; Xie, Y.; Yu, Y.; et al. Occurrence and partitioning of antibiotics in the water column and bottom sediments from the intertidal zone in the bohai bay, China. Wetlands 2016, 36, 167-79.
51. Guo, X. M.; Lu, X. M.; Jia, J. W.; et al. Comprehensive assessment of 45 antibiotics in ten urban wastewater treatment plants in Northeastern China: terminal treatment is not a reliable guard. J. Hazard. Mater. 2025, 489, 137755.
52. Maphanga, T.; Chidi, B. S.; Phungela, T. T.; et al. The interplay between temporal and seasonal distribution of heavy metals and physiochemical properties in Kaap River. Int. J. Environ. Sci. Technol. 2024, 21, 6053-64.
53. Dong, Q.; Sun, B.; Liu, Y.; Huang, X. Sewerage surveillance tracking characteristics of human antibiotic resistance genes in sewer system. Sci. Total. Environ. 2024, 952, 175850.
54. Zhang, L.; Zhu, Z.; Zhao, M.; et al. Occurrence, removal, emission and environment risk of 32 antibiotics and metabolites in wastewater treatment plants in Wuhu, China. Sci. Total. Environ. 2023, 899, 165681.
55. Zhang, K.; Xin, R.; Li, K. J.; et al. Seasonal variation and influencing factor analysis of antibiotic resistance genes in water supply reservoirs of central China. Huan Jing Ke Xue 2021;42:4753-60. https://xueshu.baidu.com/ndscholar/browse/detail?paperid=1m1b0rb021170ef0rp3502u0dg732084 (accessed 2025-12-01).
56. Guo, X. P.; Liu, X.; Niu, Z. S.; et al. Seasonal and spatial distribution of antibiotic resistance genes in the sediments along the Yangtze Estuary, China. Environ. Pollut. 2018, 242, 576-84.
57. Chen, Y. H.; Yan, C.; Yang, Y. F.; Ma, J. X. Quantitative microbial risk assessment and sensitivity analysis for workers exposed to pathogenic bacterial bioaerosols under various aeration modes in two wastewater treatment plants. Sci. Total. Environ. 2021, 755, 142615.
58. Schoen, M. E.; Ashbolt, N. J. Assessing pathogen risk to swimmers at non-sewage impacted recreational beaches. Environ. Sci. Technol. 2010, 44, 2286-91.
59. Zhong, Y.; Du, L.; Guo, C. S.; et al. Influencing factors for health of swimmer swimming in river. J Environ Health 2008;25:702-5. https://kns.cnki.net/kcms2/article/abstract?v=UsPV4INcYzgBMMeEDxHmPG-ftuIRyn2Aa96JpFMFf1yUGM0xCpaZSdL3lAeZRPMVVhAolgv_gGv50BvDt3N8SEmQnek-5k6vYGYbLJ78Kz4d2mF1ZC0LcLzcxIYS8HI8XI-6B4QM-dAPSGQzE-VlaIGJ9zmzaKFvKZT0g3wM3oo=&uniplatform=NZKPT&language=CHS (accessed 2025-12-01).
60. Kamihama, T.; Kimura, T.; Hosokawa, J. I.; Ueji, M.; Takase, T.; Tagami, K. Tinea pedis outbreak in swimming pools in Japan. Public. Health. 1997, 111, 249-53.
61. Verma, A.; Bolton, F. J.; Fiefield, D.; et al. An outbreak of E. coli O157 associated with a swimming pool: an unusual vehicle of transmission. Epidemiol. Infect. 2007, 135, 989-92.
62. Quon, H.; Jiang, S. Quantitative microbial risk assessment of antibiotic-resistant E. coli, Legionella pneumophila, and mycobacteria in nonpotable wastewater reuse applications. Environ. Sci. Technol. 2024, 58, 12888-98.
63. Ellis, M. W.; Hospenthal, D. R.; Dooley, D. P.; Gray, P. J.; Murray, C. K. Natural history of community-acquired methicillin-resistant Staphylococcus aureus colonization and infection in soldiers. Clin. Infect. Dis. 2004, 39, 971-9.
Cite This Article
How to Cite
Download Citation
Export Citation File:
Type of Import
Tips on Downloading Citation
Citation Manager File Format
Type of Import
Direct Import: When the Direct Import option is selected (the default state), a dialogue box will give you the option to Save or Open the downloaded citation data. Choosing Open will either launch your citation manager or give you a choice of applications with which to use the metadata. The Save option saves the file locally for later use.
Indirect Import: When the Indirect Import option is selected, the metadata is displayed and may be copied and pasted as needed.
About This Article
Copyright

Data & Comments
Data
0


Comments
Comments must be written in English. Spam, offensive content, impersonation, and private information will not be permitted. If any comment is reported and identified as inappropriate content by OAE staff, the comment will be removed without notice. If you have any queries or need any help, please contact us at support@oaepublish.com.