

Characteristics and potential risks of microplastics in the soil near landfill in Anyang, China
 0
0 Abstract
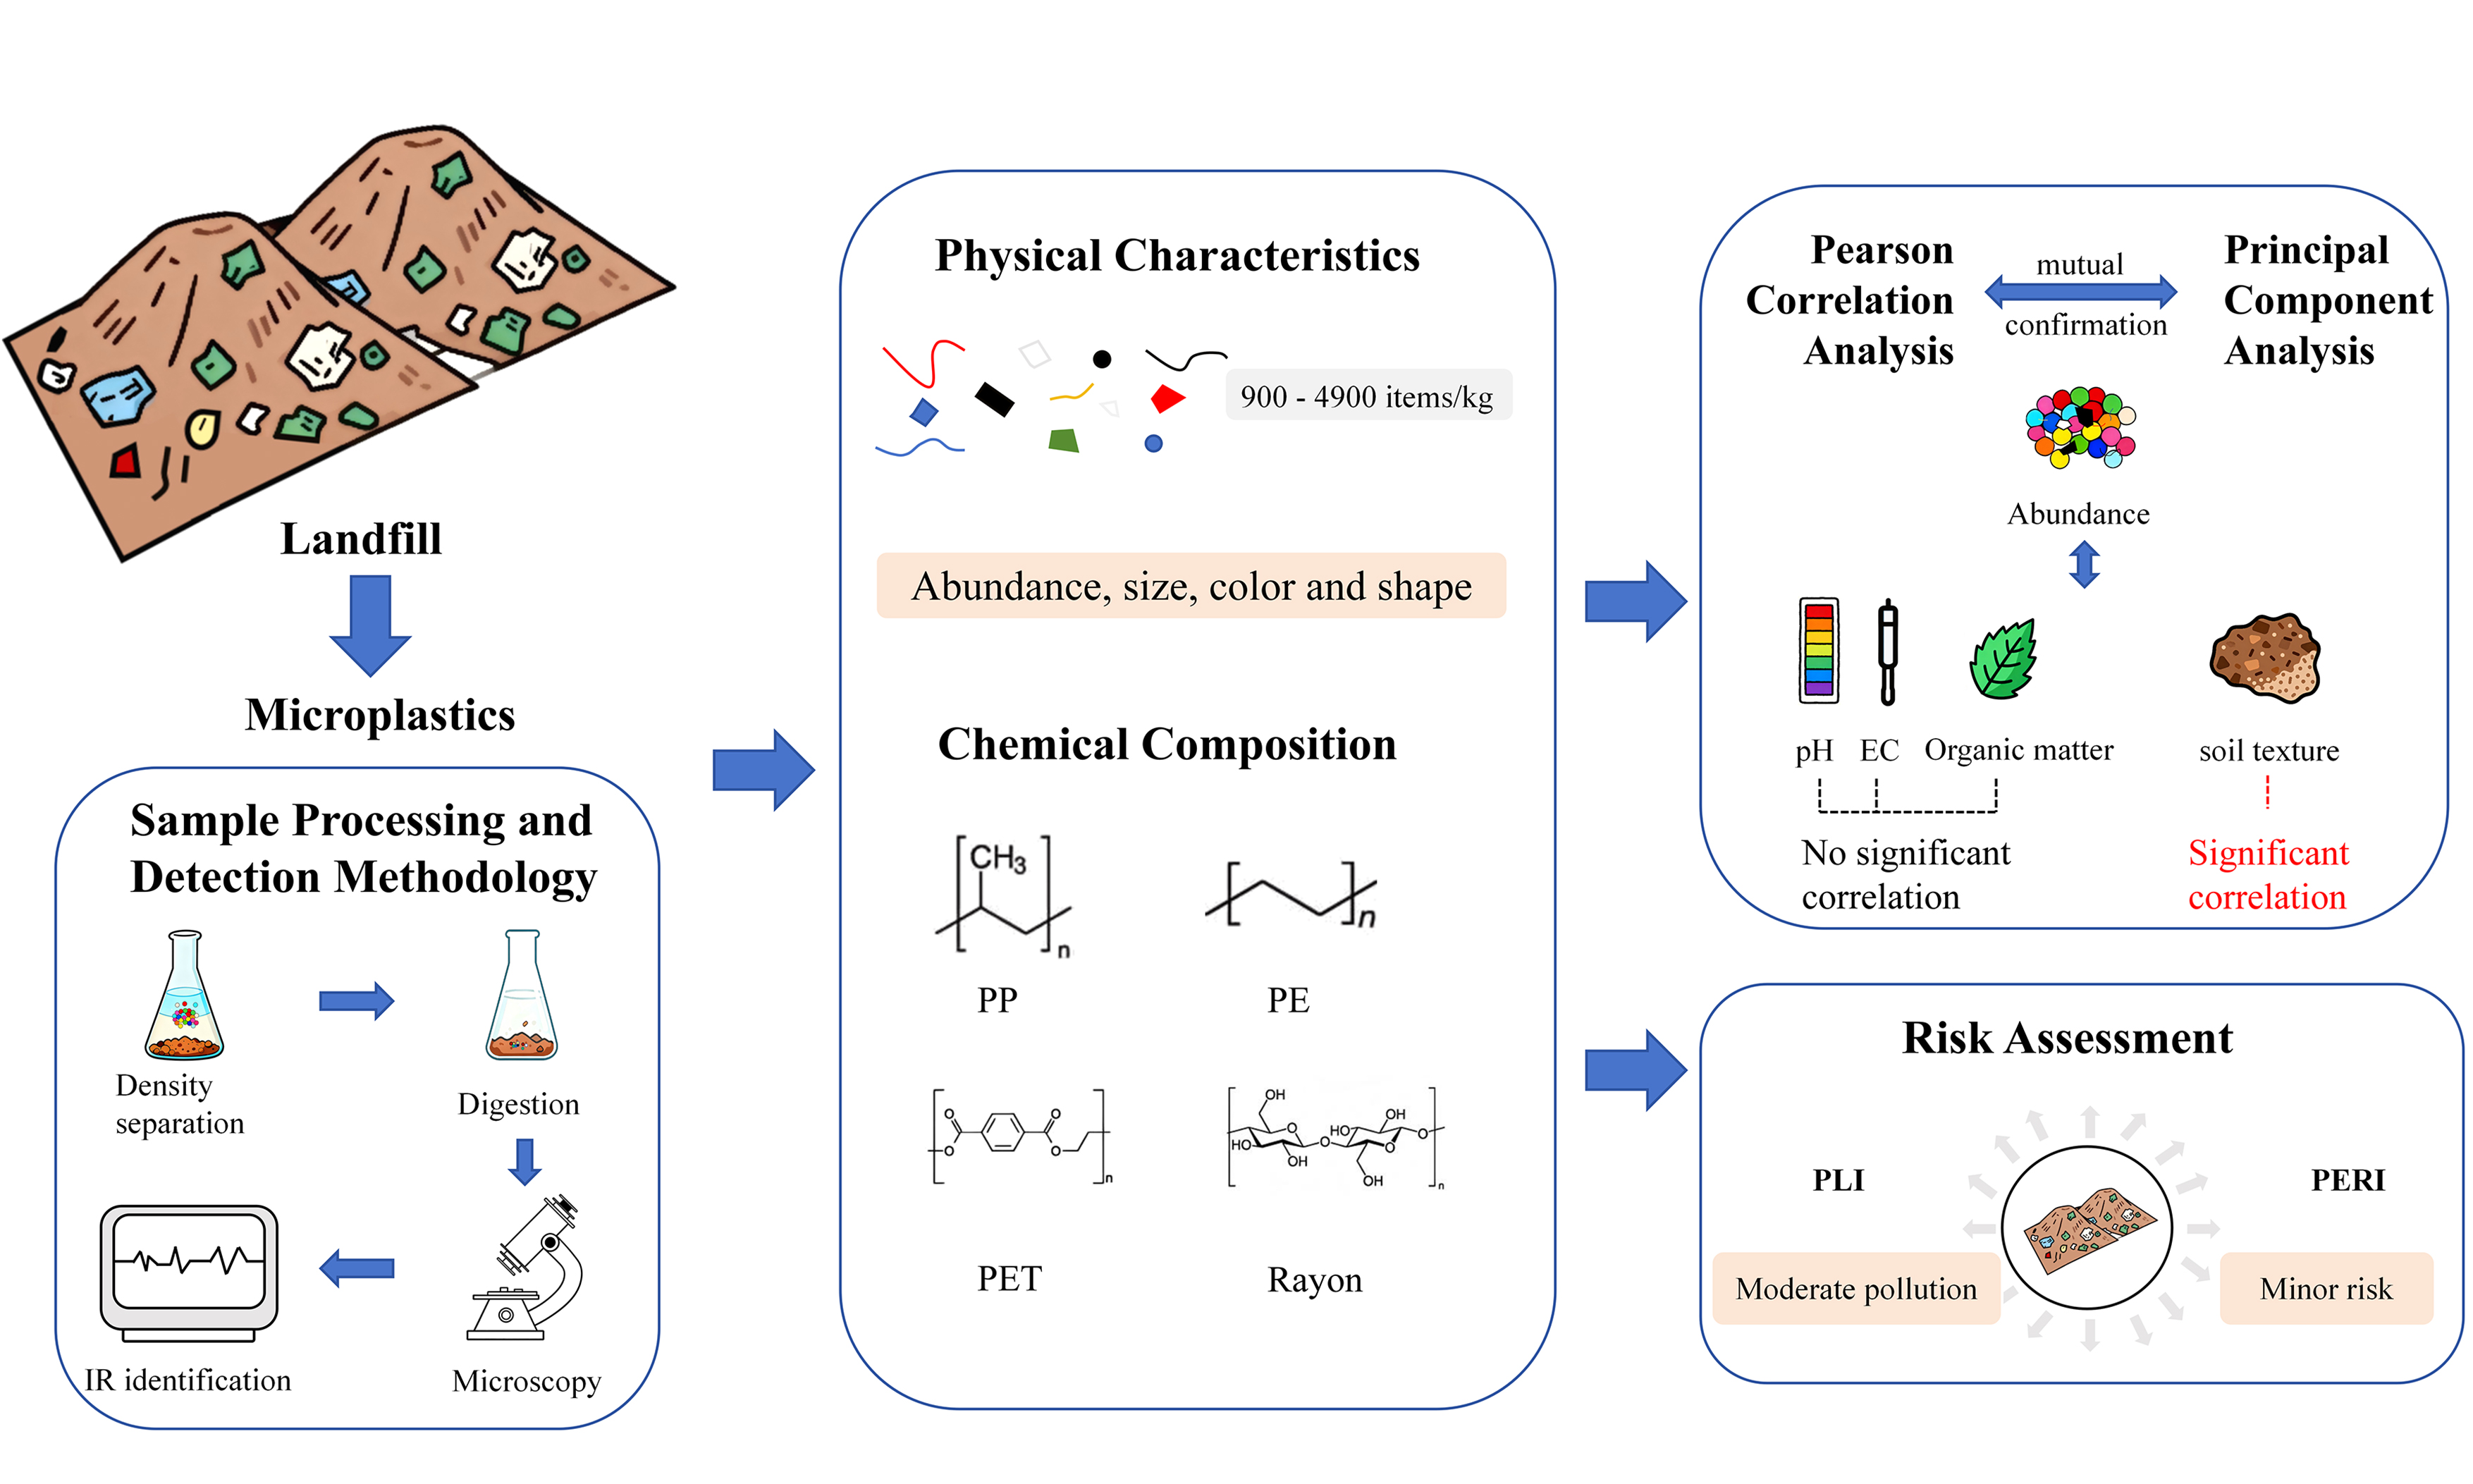
Landfills are the main storage facilities for plastic waste, which is prone to degradation into microplastics and potential transference to surrounding areas. This study focused on the characteristics and potential risks of microplastics in soil near the Anyang landfill in China, the largest municipal waste disposal facility in the area. Receiving plastic-rich domestic waste makes this landfill a potential source of microplastic pollution to the surrounding environment. Microplastics were extracted via density separation and the oxidative digestion method. Their abundance, morphological traits, and types were analyzed through microscopy and infrared spectroscopy. This study conducted further research on the link between microplastic levels and soil physicochemical properties, and the associated ecological risks. The findings indicated that the abundance of microplastics in the soil varied between 900 and 4,900 items/kg. The majority of microplastics measured were smaller than 0.5 mm. The main shapes of microplastics included fibers, films, and fragments. Seven colors of microplastics were identified, with black accounting for the highest proportion. Rayon and polypropylene were the major polymer types. Microplastic abundance showed no significant correlation with soil organic matter content, pH, or electrical conductivity, but was significantly influenced by soil texture. Overall, the microplastic pollution level in the study area was classified as moderate, and the potential ecological risk was low. These findings suggested that microplastic pollution in soils near landfills may be influenced by landfill waste. This study provided a valuable reference for evaluating the soil microplastic pollution status, ecological risks, and pollution prevention and control near the landfill site in Anyang City.
Keywords
INTRODUCTION
Plastic products have been widely manufactured and used since 1950[1]. Due to characteristics such as practicality, durability, and low cost, plastics are extensively utilized across multiple sectors, including food packaging, medical supplies, and the construction industry[2,3]. Despite their extensive applications, it is evident that the environmental pollution issues arising from them are numerous[4]. In 2015, global plastic waste production reached 6,300 metric tons (Mt) and is projected to rise to 12,000 Mt by 2050[5]. Recycling accounts for only a limited fraction of plastic waste, with the majority accumulating in the environment or landfills[6]. Most of the plastic waste emitted into the environment has stable chemical properties. It is estimated that the lifespan of plastics can reach hundreds of years[7]. Under long-term external influences (ultraviolet aging, mechanical forces, weathering in the environment), it gradually decomposes into smaller plastic fragments[8].
Microplastics (MPs) refer to plastic pieces that measure less than 5 mm in size[9]. Microplastics are present in a diverse array of forms within the environment[10]. Currently, microplastics have been found in oceans, lakes, the atmosphere, soil[11-13], and even within certain of the most secluded areas on Earth, including Antarctica and Mount Everest[14,15]. Microplastics are recognized as a new persistent environmental pollutant, attracting attention from various scientific disciplines[16]. In the past, studies regarding microplastic pollution have predominantly focused on marine ecosystems[17]. In recent years, scientists have increasingly focused on soil pollution caused by microplastics, with estimates suggesting that the number of microplastics in soil could potentially exceed that in the oceans by a factor of 4 to 23[18]. Recent research has even confirmed that microplastics can be found within the human body, including blood, lungs, placenta, and testes[19-22].
Microplastics enter soil through various pathways, primarily including plastic waste landfilling, residue from agricultural films, and application of organic fertilizers[23]. Landfilling is a globally prevalent waste management method. Reports indicated that around 79% of plastic waste was disposed of improperly and ends up accumulating in landfills or the environment[5]. Microplastics not only contribute to soil contamination but may also cause ecological risks, which can impact human health[24]. Li et al. showed that microplastics have adverse effects on soil physicochemical properties and nutrient availability[25]. Medyńska-Juraszek et al. found that the long-term deposition of microplastics in soil can alter soil physicochemical properties such as pH[26]. Therefore, urgent investigations to examine the effects of microplastics on soil are warranted.
Many scholars have carried out a series of studies on the pollution status of microplastics in soil. Zhang et al. analyzed microplastic (MPs ≤ 500 μm) pollution in the soil in areas covered by plastic dust nets in Beijing, and discovered that the abundance of microplastics reached up to 13,752 items/kg, with pollution levels ranging from unpolluted to moderately polluted[27]. The study of farmland soil in Guyuan City revealed microplastic concentrations varied between 186.32 and 1,286.24 n/kg[28]. Compared to regions such as Yunnan and Shaanxi, the microplastic content was relatively low, but it was higher than that in Harbin and Shanxi[29]. Rillig et al. investigated the pollution sources of microplastic contamination in soil environments, concluding that factors such as the dumping of household waste, the activities of small soil-dwelling organisms, and the incorporation of plastic products in agriculture contribute to increasing microplastic pollution[30]. A survey conducted in the southwestern Iranian city of Ahvaz indicated that microplastic concentrations in urban and industrial soils vary from 100 to 3,135 items/kg and 80 to 1,220 items/kg, respectively[31]. It has been shown that 90% of soils in the floodplain of Switzerland contain microplastics, with the highest concentrations associated with mesoplastic particles, indicating that plastic waste is a significant source[32].
Currently, research on microplastics in landfill soil is gradually increasing, but remains limited[33]. Salikova et al.[34] conducted a study that revealed the presence of microplastics in soil and leachate collected around a landfill site in Lithuania. In the southern Indian cities of Perungudi and Kodungaiyur, microplastics were found in the soil surrounding urban solid waste disposal sites, with higher concentrations of plastic particles observed within a radius of 1 kilometer from the landfill[35]. He et al. conducted an investigation of six urban solid waste treatment sites across four major cities in China and found that microplastics were present in landfill leachate[36]. The assessment of microplastics distribution patterns in a Shanghai landfill was carried out by Su et al.[37]. The significant presence of microplastics in waste has made landfills important sites for their accumulation. Additionally, microplastics have been identified in various environments, including water, soil, and aquatic organisms (such as mussels) near the landfill areas, which suggests that landfills are also a source of microplastic contamination affecting the surrounding ecosystem[38].
The critical issue of microplastics in urban landfills cannot be ignored. The Tanggou Landfill in Anyang City is one of the larger landfill sites in North China. The pollution status of microplastics in the surrounding soil remains unclear at present. This study focuses on the soil near landfill in Anyang, utilizing quantitative analysis and qualitative identification methods to investigate the presence of microplastics within the examined area. This will help to elucidate the interactions between soil physicochemical properties and microplastic abundance as well as to assess the risk of microplastic contamination of soils. It will contribute to a comprehensive understanding of microplastic pollution characteristics and their associated environmental risks in soils surrounding landfills, providing valuable insights to inform preventive and remedial strategies.
MATERIALS AND METHODS
Study area
Anyang City is located in the northernmost part of Henan Province, on the North China Plain. It covers a total area of 7,413 km2, including a 1,218 km2 built-up area in the urban zone and a 15 km2 built-up area in the central urban district. The city has a resident population of approximately 5.376 million[39]. The Tanggou landfill is situated in a gully (known as Tanggou) about 800 meters west of Qicun in Matoujian Township of the Long'an District, southwest of Anyang City. It is approximately 10 kilometers from the urban center and primarily receives waste generated from the daily lives of city residents. The facility is designed to handle 700 tons of urban waste each day, with a total landfill design capacity of about 2.3785 million cubic meters and an effective capacity of approximately 2.1947 million cubic meters. As of the end of 2017, a cumulative total of approximately 3.718 million tons of waste had been processed. As the city’s economy develops rapidly and the population increases, the amount of waste generated by residents has also risen. Anyang City produces about 3,870 tons of municipal solid waste every day. The actual daily processing capacity of the waste treatment facility (including the waste incineration power plant) is approximately 3,700 tons, leaving a small portion of waste unprocessed. Additionally, the area surrounding the landfill includes farmland, villages, and the Long’an Industrial Park. This creates a complex environment around the landfill.
In this study, 20 sampling sites were established near the landfill. Sampling sites S1 to S10 were located close to the landfill area (0 ~ 50 m), while S11 to S20 were located on either side of the landfill entrance, near the road and at a greater distance from the landfill area (200 ~ 400 m). The geographical coordinates and site details of the sampling sites were presented in Table 1 and Figure 1.
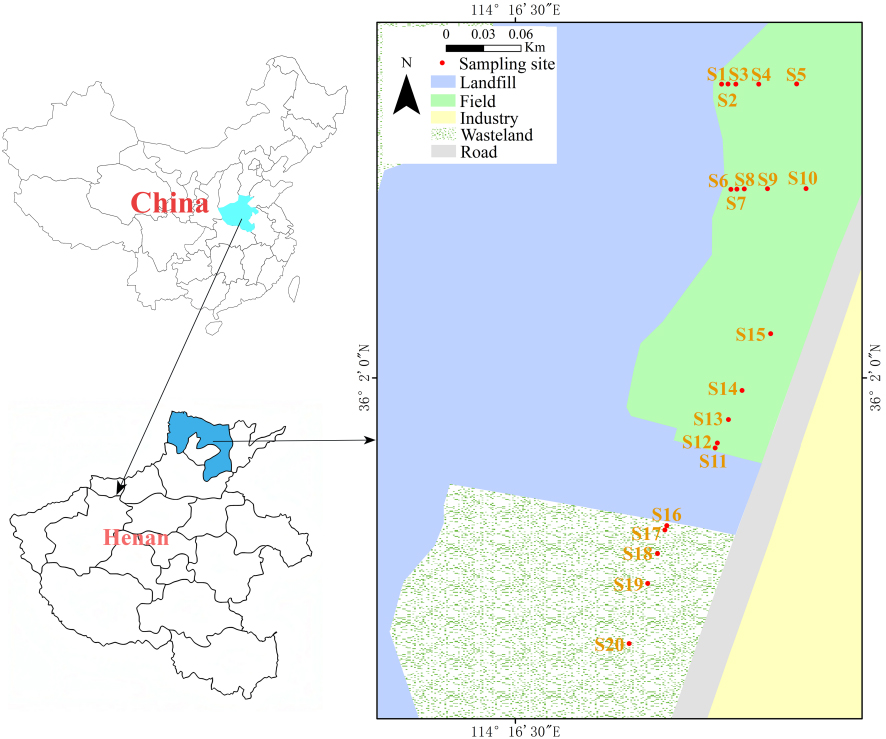
Figure 1. Schematic diagram of sampling locations (Map created based on a standard map from the National Platform for Common Geospatial Information Services of China, Modified from "Mapworld", https://www.tianditu.gov.cn/).
Latitude and longitude information of sampling sites
| Sample | Longitude | Latitude | Sample | Longitude | Latitude |
| S1 | 114°16′56.7285″ | 36°2′7.5846″ | S11 | 114°16′56.5428″ | 36°1′57.9828″ |
| S2 | 114°16′56.8782″ | 36°2′7.5924″ | S12 | 114°16′56.6328″ | 36°1′58.1952″ |
| S3 | 114°16′57.0689″ | 36°2′7.6063″ | S13 | 114°16′56.8812″ | 36°1′58.7101″ |
| S4 | 114°16′57.4794″ | 36°2′7.6180″ | S14 | 114°16′57.2844″ | 36°1′59.4012″ |
| S5 | 114°16′58.4836″ | 36°2′7.6180″ | S15 | 114°16′57.7776″ | 36°2′0.5496″ |
| S6 | 114°16′56.8704″ | 36°2′4.8588″ | S16 | 114°16′55.7580″ | 36°1′56.0244″ |
| S7 | 114°16′57.0504″ | 36°2′4.8156″ | S17 | 114°16′55.7168″ | 36°1′55.9121″ |
| S8 | 114°16′57.1584″ | 36°2′4.8228″ | S18 | 114°16′55.5429″ | 36°1′55.3187″ |
| S9 | 114°16′57.9756″ | 36°2′4.7904″ | S19 | 114°16′55.3728″ | 36°1′54.5772″ |
| S10 | 114°16′58.6596″ | 36°2′4.8732″ | S20 | 114°16′55.1208″ | 36°1′52.9320″ |
Sample collection
In November 2023, soil samples were collected from the 20 sampling sites [Figure 1]. After removing the surface debris such as dead branches, leaves, and litter, a 0.5 m × 0.5 m plot was established. Approximately 1 to 2 kg of topsoil was extracted from a depth of 5 to 20 cm using stainless steel shovels and other metal tools, following a five-point sampling method. The collected soil samples were thoroughly mixed and stored in kraft paper bags with aluminum foil-lined interiors. Bags were then labeled and subsequently taken to the laboratory for further analysis. The soil samples were air-dried at room temperature, then ground and passed through a 2 mm sieve to remove visible impurities such as large plastic fragments, plant roots, and stones.
Extraction of microplastics
The separation and extraction of microplastics from soil were primarily performed using methods based on density separation[40]. The flotation solutions included NaCl, CaCl2, ZnCl2, and NaI. Due to differences in solution density, toxicity, and cost, the flotation solutions utilized under different experimental requirements were not consistent[41]. This study employed a mixed flotation solution consisting of NaCl (1.2 g/cm3) and ZnCl2 (1.7 g/cm3) with a 1:1 volume ratio for density separation after comparison. The prepared flotation solution was filtered to remove any undissolved salt minerals and impurities. A volume of 100 ml of the flotation solution that has been prepared was incorporated into each 20 g of soil. The mixture was manually shaken and then oscillated at room temperature for 30 minutes to ensure thorough mixing. After settling for 24 h, the supernatant was subjected to vacuum filtration using a mixed cellulose ester (MCE) filter membrane (diameter 50 mm; pore size 0.45 μm) to extract microplastics. To ensure the complete extraction of microplastics to the greatest extent possible, the flotation procedure was performed three times.
Oxidative digestion was performed using 30% H2O2 solution to remove organic components that could interfere with the analysis. All materials collected on the filter membrane were thoroughly rinsed into a pre-cleaned 250 mL conical flask using a syringe loaded with 30% H2O2 (guaranteed reagent, GR), followed by supplementation with additional 30% H2O2 (GR) to adjust the final volume to 100 mL. The mixture was stirred evenly. Then, it was subjected to an incubator with a regulated temperature. The temperature was set at 60 °C, and it was left for 24 h for digestion. After the digestion process was completed, vacuum filtration was conducted using an MCE filter membrane (diameter 50 mm; pore size 0.45 μm). During the filtration process, ultrapure water was used to rinse the conical flask and the inner wall of the filtration unit to ensure that all substances were transferred onto the filter membrane. Filter membranes containing microplastics were stored in glass petri dishes and allowed to dry naturally for subsequent analysis.
Identification of microplastics
The microplastics retained on the filter membrane were systematically observed through the stereomicroscope (SZX7, Olympus, Japan). The microplastics were observed at a magnification of 16x, and images were captured using a digital camera. The physical characteristics of all microplastics, such as shape, color, and size were identified and recorded. The abundance of microplastics was calculated after excluding the blank interference. The chemical composition of microplastics was identified by selecting representative microplastics using stainless steel tweezers and a dissection needle under a stereomicroscope and subsequently analyzing them with an infrared spectrometer (Nicolet iN 10, Thermo, USA). The spectral range analyzed in the infrared was between 4,000 and 600 cm-1, at a resolution set at 8.00 cm-1, and a total of 16 scans were conducted. The suspected microplastics were analyzed for composition and functional group characterization. The resulting spectra were compared with a sample library in OMNIC (Thermo Fisher Scientific, Waltham, MA, USA), and when the spectral similarity exceeded 80% or was the highest match, the polymer type was determined.
Physicochemical parameters of soil
The study evaluated various physicochemical soil parameters, including texture, pH, electrical conductivity (EC), and organic matter content. According to the national environmental protection standard testing methods, the pH was measured using a pH meter under the condition of soil-to-water ratio of 1:2.5 (HJ962-2018), while the EC was measured using an EC meter under the condition of soil-to-water ratio of 1:5 (HJ802-2016). A quantity of 0.5 grams of soil was subjected to combustion in a muffle furnace at a temperature of 600 °C for a duration of 6 h by the weight loss method to determine organic matter content. The soil texture was assessed with the LS 13 320 Laser Particle Size Analyzer (Beckman Coulter, USA), which measures particle sizes ranging from 0.02 to 2,000 micrometers.
Ecological risk assessment
Pollution load index
Pollution load index (PLI) is directly related to the abundance of microplastics and can be used to evaluate microplastic pollution levels in soil. However, there is currently no standardized method for its application[42]. The background value for this study was determined by the lowest abundance found in the sampling area. PLI is calculated based on[42]:
where CF is the microplastic pollution coefficient, C denotes the measured abundance of microplastics (items/kg), C0 is the lowest observed abundance value of microplastics (items/kg), PLIzone denotes the PLI for the study area, and n is used to denote the labels of sampling sites. Sun et al.[43] provided a framework for evaluating risk categories, which is illustrated in Table 2.
Evaluation standard of pollution load index
| PLI | Risk category |
| < 1 | Minor |
| 1 ~ 2 | Moderate |
| > 2 | High |
Potential ecological risk index
Potential ecological risk index (PERI) was originally developed by Hakanson[44]. Xu et al.[45] improved upon the original PERI for heavy metals, developing a version specifically to evaluate the ecological risks related to microplastics. PERI can be calculated using[42,45]:
where Ei denotes the ecological risk associated with each type of microplastics, Ti denotes the chemical toxicity coefficient of the polymer, Ci indicates the abundance of various polymers in each sample (items/kg), and C0 indicates the lowest recorded abundance value of microplastics (items/kg). The potential ecological risks are categorized into five categories, as shown in Table 3[46].
Evaluation standard of potential ecological risk index[46]
| PERI | Risk category |
| < 150 | Minor |
| 150 ~ 300 | Moderate |
| 300 ~ 600 | High |
| 600 ~ 1,200 | Danger |
| > 1,200 | Extreme danger |
Quality assurance and data analysis
The use of plastic products should be avoided in the collection, preservation, and laboratory analysis of soil samples to prevent contamination during the experimental procedure. Personnel wore 100% cotton clothing and rubber gloves throughout the procedure. All instruments were rinsed with ultra-pure water before the experiment began. Laboratory blanks were established and processed following the same procedures as the soil samples to assess any potential contamination during experimental processing. Three replicates were established for laboratory blank samples. The average value of these three replicates was used as the blank control for the soil samples. In the laboratory blanks, only fibrous microplastics were detected, with a range of 5 to 12 items per membrane, averaging 8 items per membrane. The Graphical Abstract was created using Microsoft Office 2021 PowerPoint. The geographic location map of the study area was illustrated using ArcMap 10.8 software, while SPSS 27 and Origin 2022 software were used for statistical analysis and mapping. The pH, electrical conductivity, and organic matter content of the soil [presented as mean ± standard deviation (SD)] were calculated using descriptive statistical analysis in SPSS 27 software on data obtained from three independent experimental replicates. Pearson correlation analysis was conducted using SPSS 27, and the results were subsequently visualized as a heatmap using Origin 2022.
RESULTS AND DISCUSSION
Abundance of microplastics
As shown in Figure 2, all soil samples analyzed from the study area exhibited the presence of microplastics. The abundance of microplastics ranged from 900 to 4,900 items/kg, with an average of 2,632 items/kg. Table 4 illustrated that significant variations in the abundance and characteristics of microplastics observed in soil environments across various regions of the world in recent years. Within the study area, the abundance of microplastics was notably lower than that found in Depok City and Guangdong, but higher than that in Guyuan and Hangzhou Bay. It was important to note that the samples from Depok City, the Gulf of Thailand, Guangdong, and those from our study were all collected from landfill sites and their surrounding areas. The abundance of microplastics was significantly higher than that in other regions in Table 4. Existing studies both domestically and internationally have shown a trend towards convergence in research content when analyzing pollution characteristics of microplastics in soil, focusing on aspects such as abundance, particle size range, and shape.
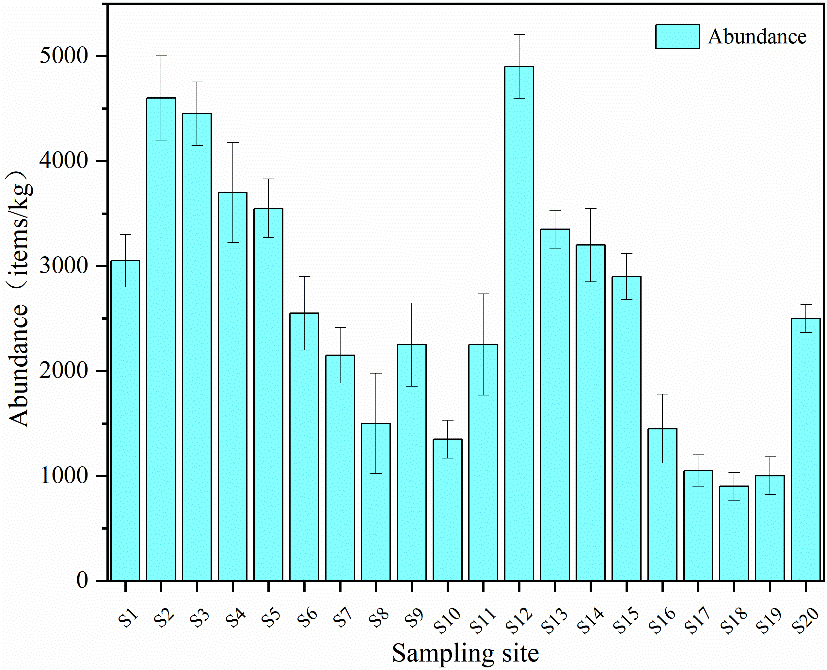
Figure 2. Abundance of microplastics in the sampling sites. [Error bars indicate ± SD (n = 3)]. SD: Standard deviation.
Distribution and characteristics of soil microplastics in different regions
| Region | Abundance (items/kg) | Size (mm) | Shape | Polymer type | Reference |
| Gulf of Thailand | 686.45 ~ 2,278.44 | < 5 | Fiber, film, sphere, granule | PP, PE, PET | Natesan et al.[35], 2021 |
| Mysuru, India | 180 ~ 1,120 | 0.03 ~ 1 | Film, fragment, fiber, foam | PP, PE | Mahesh et al.[47], 2023 |
| Depok City, Indonesia | 48,670 ~ 88,000 | - | Fiber, fragment, film, granule | PE, PVC, PS, PP, PET | Pratiwi et al.[54], 2024 |
| Guangdong, China | 570 ~ 14,200 | 0.03 ~ 5 (mostly < 1) | Fiber, film, fragment | PP, PE, PET, PS, PVC | Wan et al.[48], 2022 |
| Guyuan, China | 186.32 ~ 1,286.24 | < 1 (88%) | Fiber, film, fragment, microbead | PP, PE, PET, PS, PVC, PA | Ma et al.[28], 2023 |
| Liaohe River Basin, China | 145.83 | 0.09 ~ 5 (68% < 2) | Film, fragment, fiber, foam, granule | PP, Rayon, PE, PES, PET, PS | Han et al.[55], 2021 |
| Hangzhou Bay, China | 503 | 0.06 ~ 4.5 (0.5 ~ 2 > 50%) | Film, fragment, fiber | PE, PP, PP:PE, Rayon | Zhou et al.[49], 2020 |
| Anyang, China | 900 ~ 4,900 | Mostly < 0.5 | Fiber, film, fragment, granule | Rayon, PP, PE, PET | This study |
In the surrounding area of the Tanggou landfill in Anyang, there was significant variation in the abundance of microplastics in soil among different sampling sites. The abundance was higher near the landfill (S1 to S10), reaching an average of 2,915 items/kg. This elevated level can be attributed to improper waste management during landfill operations, which allowed waste to enter the surrounding soil environment. Additionally, the sampling sites were primarily agricultural lands, where factors such as the use of fertilizers, pesticides, and plastic mulch during crop cultivation may also influence microplastic abundance. The packaging of fertilizers and pesticides, as well as agricultural films, often consists of plastic materials such as polypropylene (PP) and polyethylene (PE). Due to a lack of recycling awareness, these plastic films may reach the end of their useful life or may not be properly disposed of during use. Over time, exposure to sunlight and weathering can cause these materials to gradually degrade into microplastics in the soil. In contrast, S11 to S20 were located on either side of the landfill entrance, near the road, and farther from the landfill area, with a relatively lower average abundance of 2,350 items/kg. Among these, S12 exhibited the highest abundance, which can be attributed to the landfill and agricultural activities, as well as possibly the proximity to the road. Microplastic particles may stem from tire wear caused by vehicles traveling on the road or may infiltrate roadside soil via various pathways, including rainfall or atmospheric deposition. The analysis revealed that the total microplastic abundance in the soil surrounding the landfill site was relatively high, with greater concentrations closer to the landfill compared to other areas. However, the relationship between the abundance of microplastics and distance from the landfill was not linear. The environmental context at each sampling site also significantly influences the abundance of microplastics in the soil.
Size, color and shape characteristics of microplastics
Figure 3A illustrated the proportion of microplastics by size classification among all soil samples. The abundance of microplastics by size category was as follows: < 0.1 mm (29.63% to 71.88%), 0.1 to 0.5 mm (20.31% to 61.11%), 0.5 to 1 mm (0% to 18.52%), and > 1 mm (0% to 5.17%). It was evident that particles smaller than 0.5 mm dominate in most samples, accounting for 81.03% to 100%. This revealed that the vast majority of microplastics in the soil of the study area were smaller than 0.5 mm, with only a small portion exceeding 1 mm. Moreover, as the particle size decreased, the quantity increased. No significant variations were observed in the sizes of microplastics from various sampling sites, suggesting that the surrounding environment had little impact on their size within the soil. Microplastic size was likely to change over time as they undergo degradation. Factors such as temperature, light exposure and wind may cause microplastics to break down into smaller sizes[34]. Microplastics with a small particle size were more easily accumulated in soil environments[50].
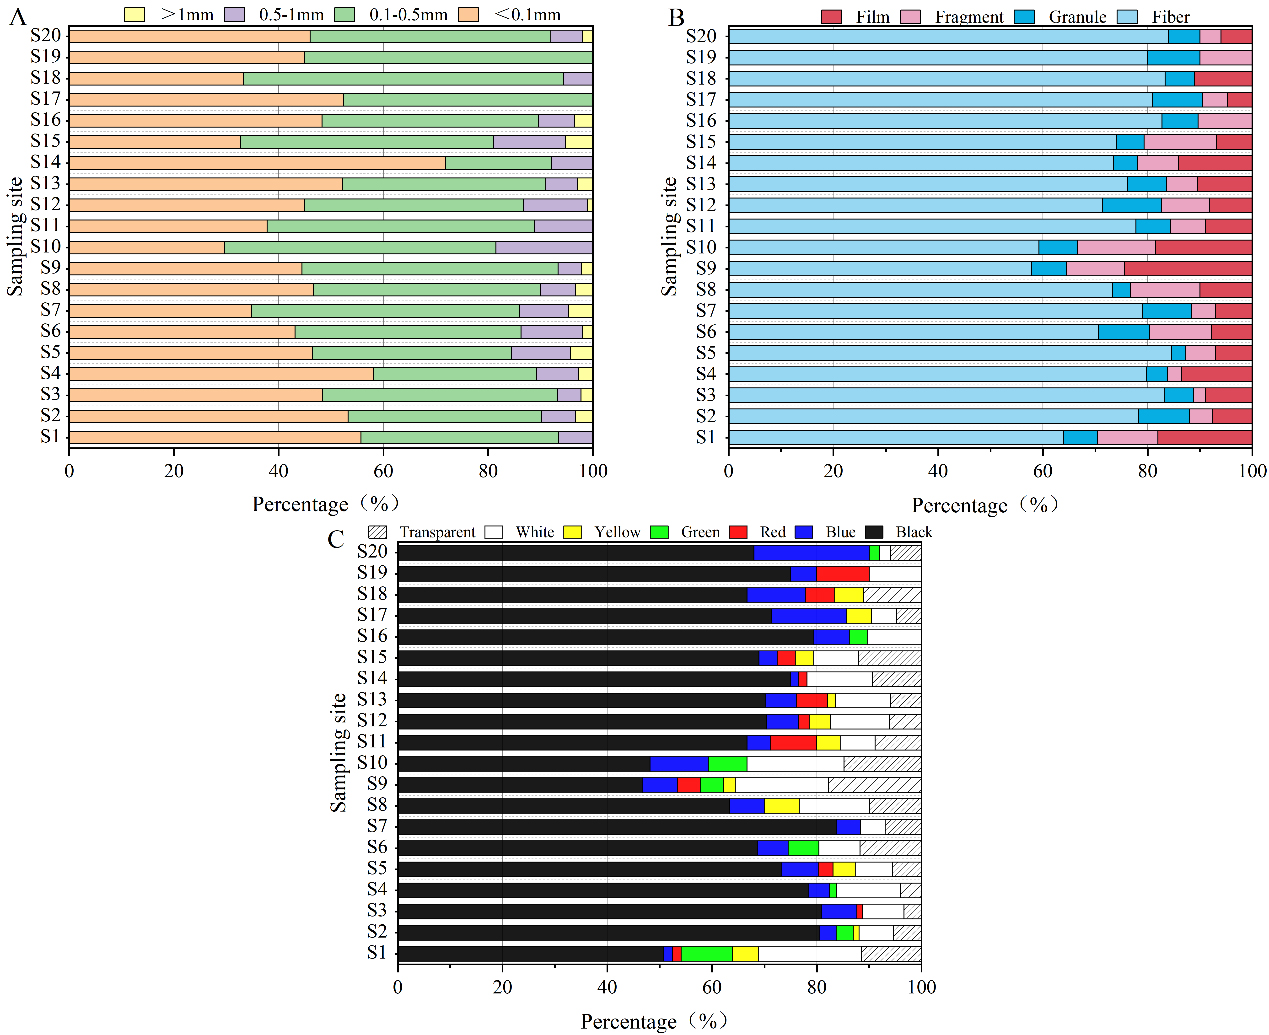
Figure 3. Characteristics of microplastics detected in the soil [(A) Size; (B) Shape; (C) Color].
Figure 3B showed that the observed microplastics primarily existed in four shapes: fiber (57.78% to 84.51%), granule (2.82% to 11.22%), film (0% to 14.81%), and fragment (0% to 24.44%). The distribution of microplastics varied across each sampling site. However, all four shapes of microplastics were generally present at each sampling site. The shapes of microplastics were closely associated with the sources of plastic products. Notably, the number of fibers is significantly higher than in the other three shapes, with an average proportion of 76.11%. The highest proportion of fibers (84.51%) was observed at S5, possibly originating from synthetic fiber materials in items processed at the landfill, such as clothing, or from agricultural tools and packaging materials used during cultivation and production. At the agricultural site near the landfill area, the highest proportion of films (24.44%) was observed at S9. This landfill primarily processes household waste, and commonly used packaging bags and garbage bags in daily life likely contribute significantly to the presence of film-shaped microplastics. Additionally, the low recycling rates of agricultural films result in substantial accumulation of waste films in agricultural soils, making them difficult to biodegrade and exacerbating plastic pollution. These films were particularly thin and transparent in structure, which facilitates their fragmentation. Fragments were likely derived mainly from plastic containers in the landfill, such as water bottles and food storage containers, with the highest proportion found at S10 (14.81%). At S12, granules represented the highest proportion (11.22%), as their relatively diminutive size enabled easier infiltration into the soil through leachate, rainwater runoff, and atmospheric deposition. These factors contribute to the varying forms of microplastics observed in the soil.
According to the color classification [Figure 3C], seven colors of microplastics were observed. The majority of the microplastics collected from various sampling sites were black, comprising between 50.82% to 83.72%. Numerous black plastic items, such as black plastic bags, are highly prone to breaking down into microplastics during landfill disposal. Their dark color makes them hard to clean and recycle effectively, leading to their release into the surrounding soil. In urban settings, abundant air pollutants such as vehicle exhaust and industrial emissions may carry black microplastic particles. These particles can be transported via air currents, eventually settling and infiltrating the soil. In agriculture, black plastic films are widely used to cover soil and maintain moisture and temperature. If these films are not properly recycled or disposed of after use, they can degrade in the soil, forming black microplastics. Unlike other microplastic types, black microplastics exhibit high color stability. They resist significant color changes from light exposure and oxidation, making them more identifiable and detectable in soil environments. Other colors included blue (1.56% to 22%), red (0% to 10%), green (0% to 9.84%), yellow (0% to 6.67%), white (0 to 19.67%), and transparent (0% to 17.78%). Small and colored microplastics were regarded as environmental threats because they resemble essential items for animals and birds[51]. The analysis revealed variations in both the colors and proportions of microplastics across different sampling sites. Regardless of the proximity to the landfill area, black remains the predominant color. Furthermore, white (4.65% to 19.67%) and transparent (3.37% to 17.78%) microplastics were primarily found at sampling sites S1 to S15, which was mainly attributed to their presence in agricultural areas where agricultural films were mostly white or transparent. Other colors of microplastics might have originated from colored plastic products or apparel used in daily life. Improper disposal of these items can lead to their unintended entry into the soil. Moreover, microplastics undergo complex physical, chemical, and biological processes in the environment, resulting in changes to their color over time[49].
Chemical components of microplastics
Infrared spectroscopic analysis was conducted on microplastics collected from 20 sampling sites near the landfill, and the results were matched against a standard spectral library. Types of microplastics were identified based on a match degree exceeding 80%, with the highest matching values determining the specific types. As shown in Figure 4, four types of microplastics were identified in the study area, including rayon, PP, PE, and polyethylene terephthalate (PET). Figure 5 illustrated that the proportions of different types of microplastics vary within the total microplastics content. Among all soil samples, the most prevalent microplastic was rayon (59.1%), followed by PP (22.7%), PE (13.6%), and PET (4.5%). PET and Rayon dominated the measured fibrous microplastics, and PP and PE dominated the measured thin-film and fragmented microplastics. Combining survey results on pollution at the sampling sites, it was found that the waste processed at the landfill primarily consists of residential waste. Rayon was closely associated with consumer goods such as clothing and bedding, including disposable hygiene products (e.g., wipes, diapers) and medical supplies. PP was commonly used for household appliance housings and food containers, while PE was widely used for detergent bottles, toys, and similar products. The chemical composition of agricultural films primarily consists of PP and PE[53]. Furthermore, plastic particles from industrial, traffic-related (e.g., tire wear), landfill, and agricultural sources can enter the soil environment through atmospheric deposition and wind transport. Pratiwi et al. indicated that PE, polyvinyl chloride (PVC), and polystyrene (PS) were the primary polymers identified in the soil of the landfill in Depok City[54]. Additionally, the dominant microplastics found in the soils along the Liao River Basin were PP, Rayon, PE, and polyethersulfone (PES)[55]. This indicates that the distribution of microplastic types varies across specific study areas, closely related to the sources of the microplastics. Landfill environments were typically acidic or alkaline. Under these conditions, the glycosidic bonds in the molecular chain of rayon were prone to hydrolysis, thereby generating shorter and finer microplastic fibers[56]. When exposed to sunlight, PP and PE were susceptible to thermal-oxidative and photo-oxidative degradation. In landfill environments, metal ions that might be present could also catalyze plastic degradation, which resulted in polymer chain scission, the formation of oxygen-containing groups (e.g., carbonyls), material embrittlement, and microcracks[8,57]. PET exhibited a higher fragmentation rate than PE and PP, degrading more readily and generating smaller particle sizes[58]. Plastic degradation facilitated the fragmentation of plastics through physical processes (e.g., leachate scouring and waste compaction). Over time, this led to their continuous transformation into microplastics and progressively smaller particles, representing an ongoing reduction process.
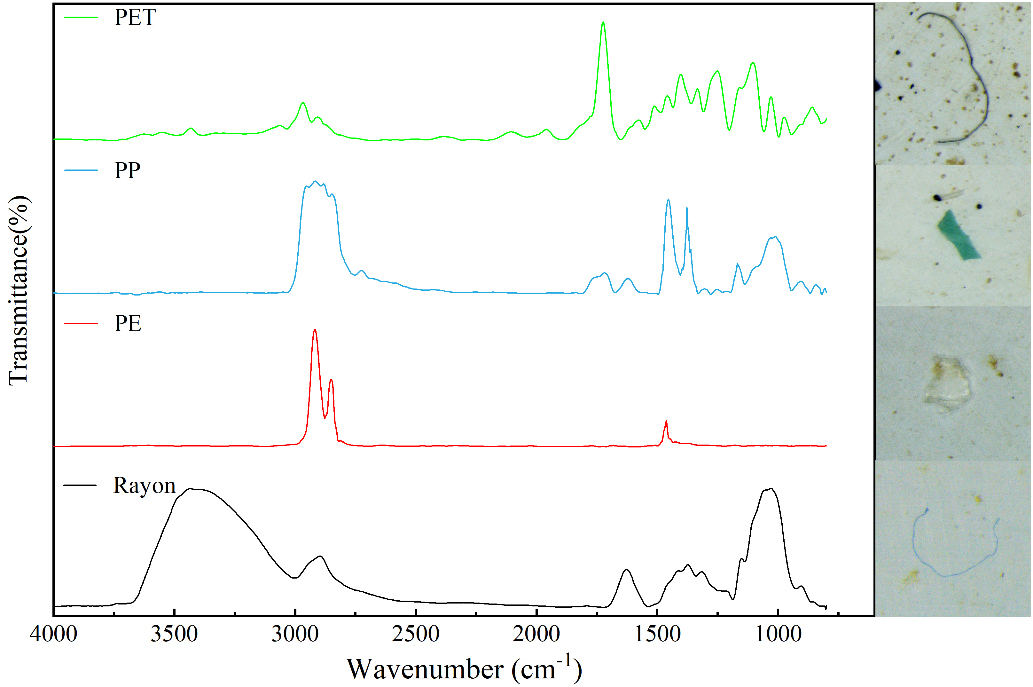
Figure 4. Microplastics in the soil and their infrared spectra. PET: Polyethylene terephthalate; PP: polypropylene; PE: polyethylene.
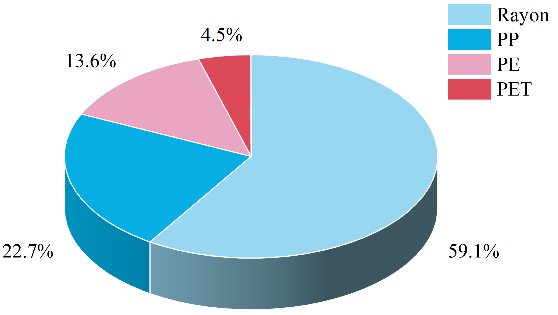
Figure 5. Percentage of polymer types in the soil. PP: Polypropylene; PE: polyethylene; PET: polyethylene terephthalate.
Correlation between microplastics characteristics and physicochemical properties of soil
As shown in Table 5, the pH of the soil ranged from 6.53 ± 0.04 to 7.53 ± 0.02, indicating an overall neutral soil condition. The EC of the soil ranged from 93.23 ± 2.40 μs/cm to 417.33 ± 2.08 μs/cm. The particle-size composition of the soil samples in the study area indicated that silt was the dominant fraction, suggesting a silty loam soil texture. The organic matter content in the soil ranged from 4.11% to 5.31%, indicating a rich organic matter level. Differences in the physicochemical properties of the soil are likely influenced by the surrounding environmental conditions.
Physicochemical properties of the soil at the sampling site
| Sample | pH | EC (μs/cm) | Organic matter (%) | Clay (%) | Silt (%) | Sand (%) |
| S1 | 6.87 ± 0.03 | 374.33 ± 13.5 | 5.01 ± 0.16 | 8.89 | 80.85 | 10.26 |
| S2 | 6.95 ± 0.03 | 239.33 ± 2.08 | 5.15 ± 0.38 | 8.85 | 80.94 | 10.21 |
| S3 | 6.78 ± 0.03 | 229.33 ± 8.50 | 5.05 ± 0.23 | 8.97 | 80.97 | 10.06 |
| S4 | 6.85 ± 0.01 | 128.67 ± 3.01 | 5.31 ± 0.32 | 10.19 | 81.37 | 8.44 |
| S5 | 6.80 ± 0.02 | 157.67 ± 0.46 | 5.19 ± 0.05 | 7.86 | 81.72 | 10.42 |
| S6 | 7.12 ± 0.00 | 262.00 ± 2.65 | 5.27 ± 0.17 | 8.09 | 81.32 | 10.59 |
| S7 | 7.43 ± 0.02 | 182.53 ± 0.32 | 5.28 ± 0.25 | 8.14 | 81.38 | 10.49 |
| S8 | 7.53 ± 0.02 | 100.90 ± 1.91 | 4.99 ± 0.25 | 8.15 | 81.41 | 10.45 |
| S9 | 7.31 ± 0.01 | 144.57 ± 0.95 | 5.24 ± 0.31 | 7.91 | 81.37 | 10.72 |
| S10 | 7.28 ± 0.06 | 266.00 ± 6.93 | 4.99 ± 0.10 | 7.83 | 81.42 | 10.75 |
| S11 | 7.03 ± 0.03 | 141.57 ± 2.39 | 4.71 ± 0.16 | 8.22 | 79.56 | 12.22 |
| S12 | 7.28 ± 0.05 | 182.50 ± 0.75 | 4.55 ± 0.17 | 8.19 | 79.60 | 12.21 |
| S13 | 6.96 ± 0.08 | 365.33 ± 2.52 | 4.50 ± 0.20 | 8.57 | 77.83 | 13.60 |
| S14 | 6.67 ± 0.11 | 151.53 ± 6.55 | 4.73 ± 0.32 | 8.27 | 78.69 | 13.04 |
| S15 | 6.53 ± 0.04 | 149.83 ± 3.5 | 4.60 ± 0.30 | 8.23 | 78.60 | 13.17 |
| S16 | 7.17 ± 0.05 | 93.23 ± 2.40 | 4.22 ± 0.19 | 5.78 | 82.66 | 11.56 |
| S17 | 7.08 ± 0.02 | 98.57 ± 3.01 | 4.11 ± 0.15 | 5.76 | 82.53 | 11.71 |
| S18 | 7.02 ± 0.04 | 107.73 ± 5.93 | 4.34 ± 0.16 | 5.89 | 82.01 | 12.1 |
| S19 | 6.82 ± 0.06 | 98.37 ± 2.36 | 4.25 ± 0.14 | 5.79 | 82.53 | 11.68 |
| S20 | 6.90 ± 0.10 | 417.33 ± 2.08 | 4.43 ± 0.20 | 6.72 | 81.7 | 11.58 |
To investigate the relationships between microplastic abundance and various soil physicochemical properties, a Pearson correlation coefficient (r) analysis was performed based on data collected from each sampling site, as illustrated in Figure 6. The results demonstrated a lack of significant correlation of microplastic abundance with soil organic matter content, pH, or EC. However, the abundance of microplastics was significantly positively correlated with clay content (P < 0.01), consistent with previous research indicating that soil texture primarily influences microplastics abundance levels[59]. This is likely associated with the larger surface area of clay particles, the smaller pores between them, and their higher viscosity, which enhance the adsorption and retention of microplastics. Conversely, Scheurer et al. reported that no significant correlation between the abundance of microplastics and soil texture, potentially reflecting the complex influences of various factors on microplastic accumulation in the soil, including anthropogenic and natural factors, as well as geographic variations[32]. Therefore, further investigations were essential to confirm the relationship between soil physicochemical properties and microplastic abundance.
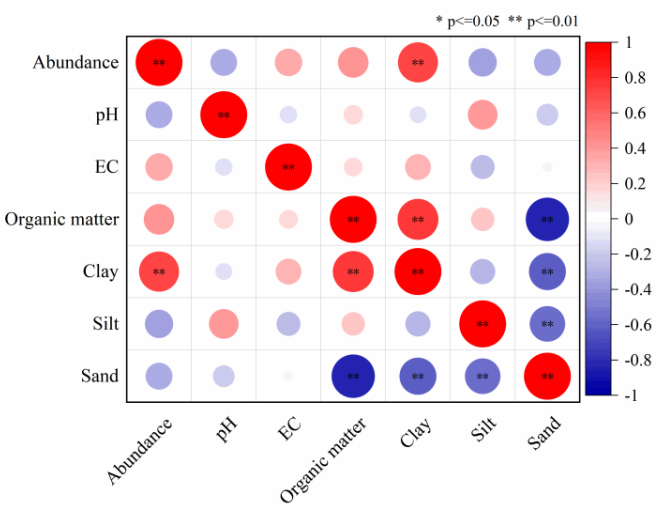
Figure 6. The Pearson correlation between the abundance of microplastics in soil and pH, EC, organic matter, and soil texture (Clay, Silt, Sand). EC: Electric conductivity.
Principal Component Analysis (PCA) was employed to comprehensively analyze variables, including the abundance, size, and shape of microplastics, as well as pH, EC, and texture of soil, with the results presented in Figure 7. PCA reduced the multidimensional variables to two principal components (PC1 and PC2). PC1 (horizontal axis) accounts for 43.2% of the total variance, while PC2 (vertical axis) explains 14.1%. Together, they cumulatively account for 57.3% of the total variance, effectively summarizing the information from the original variables. Variables with positive loadings on PC1, such as abundance, organic matter, clay, and fragment content, are the primary drivers of this component. In contrast, PC2 is characterized by variations in silt, pH, and sand. The sample scores revealed that the samples were widely distributed along both PC1 and PC2, indicating considerable variation in soil properties. PCA of soil properties and microplastic abundance revealed negative correlations with pH, silt, and sand content, while positive correlations were observed with all other parameters. The strongest correlation was between abundance and clay content, as indicated by the smallest angle between their vectors and their long arrows, which denote high loadings on the principal components. This finding was consistent with the results obtained from Pearson correlation analysis, further validating the relationship between microplastic abundance and soil texture.
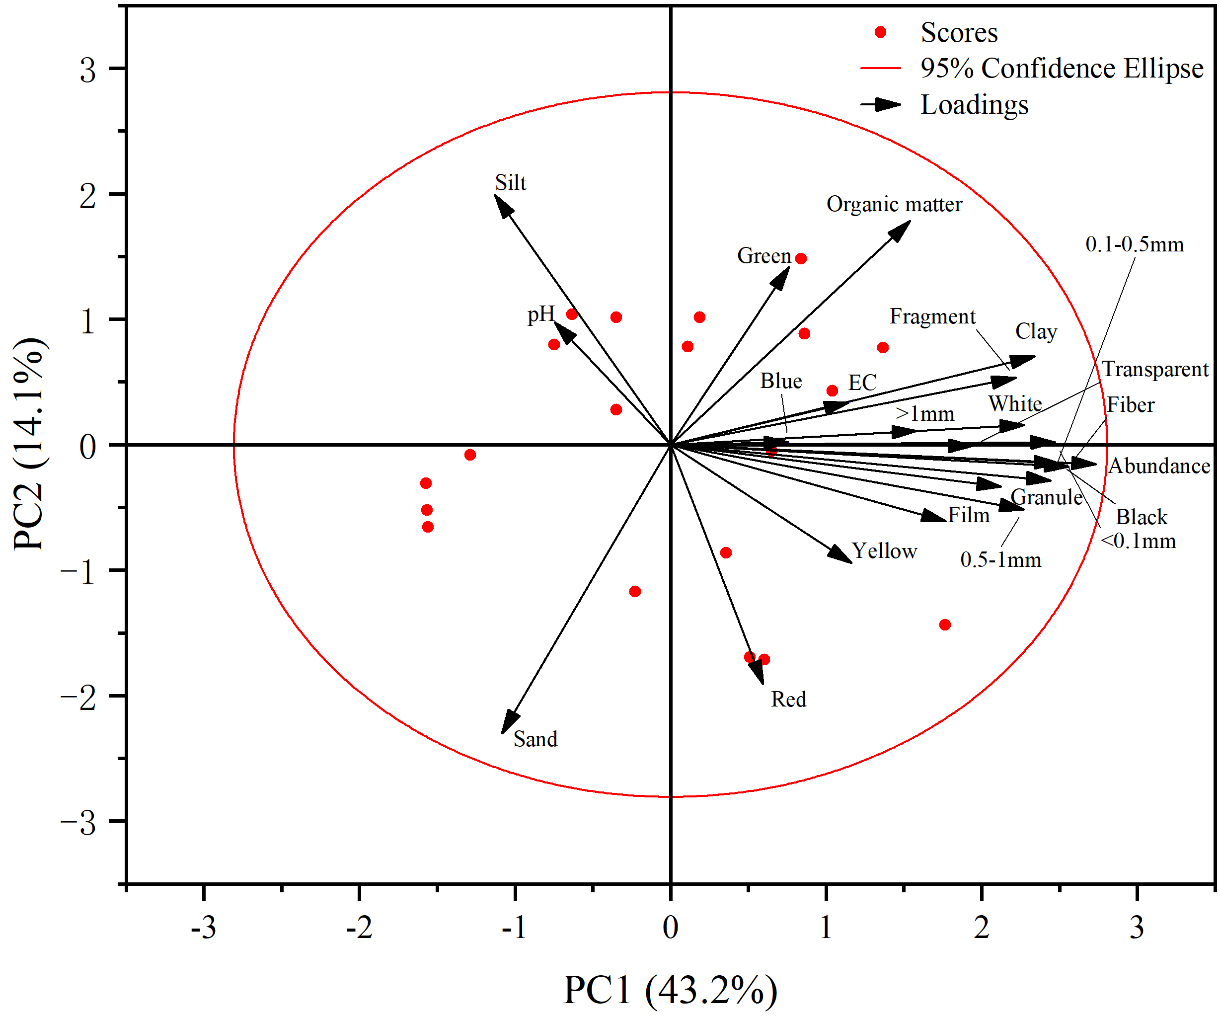
Figure 7. PCA of microplastic characteristics and soil physicochemical properties. EC: Electric conductivity; PC: principal component; PCA: principal component analysis.
Ecological risk assessment
Pollution load index
Figure 8 showed that microplastic pollution at various sampling sites near the Tanggou landfill in Anyang exhibited different PLI values, ranging from 1.05 to 2.33. The overall regional PLI value was 1.61, indicating moderate pollution. In the vicinity of the landfill (S1 to S10), PLI values range from 1.22 to 2.26. S2, S3, and S4 were categorized as high pollution. The PLI values for the area were 1.73. S11 to S20 were located near the landfill entrance and adjacent road. Further from the landfill, the PLI values ranged from 1.05 to 2.33, with a regional PLI of 1.50. Notably, S12 reached a high pollution level. The lowest PLI value for microplastic pollution was found at S19. This indicated that pollution levels were influenced by the surrounding environment, with higher levels of microplastic pollution near landfill areas. Overall, the trend indicated that PLI values decrease with increasing distance from the landfill. All sampling sites were affected by varying degrees of pollution, indicating the severity of microplastic pollution loads in the soil within the study area. This issue warrants attention from relevant authorities.
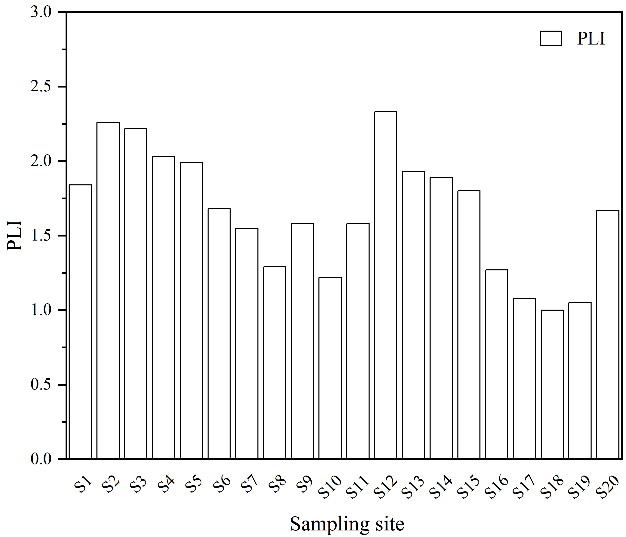
Figure 8. PLI of microplastics in the soil. PLI: Pollution load index.
Potential ecological risk index
Figure 9 presented the PERI for microplastics in the soil across different sampling sites in the study area. The PERI range for microplastics in the study area soil was 2.50-13.61. The average value was 7.31. All sampling sites were classified as presenting a minor risk. The ecological risk posed by microplastics is not solely determined by their abundance; the type of polymer also plays a significant role in influencing their ecological risk. For instance, polymer types with high hazard levels, such as PVC, can lead to elevated regional risk levels[46]. The level of microplastic pollution was relatively high in this study. However, the potential ecological risk could be underestimated because the high-risk polymer types were not detected. Therefore, it is essential to consider that the ecological risk associated with microplastics is influenced by both their abundance and the nature of the polymers found within the environment.
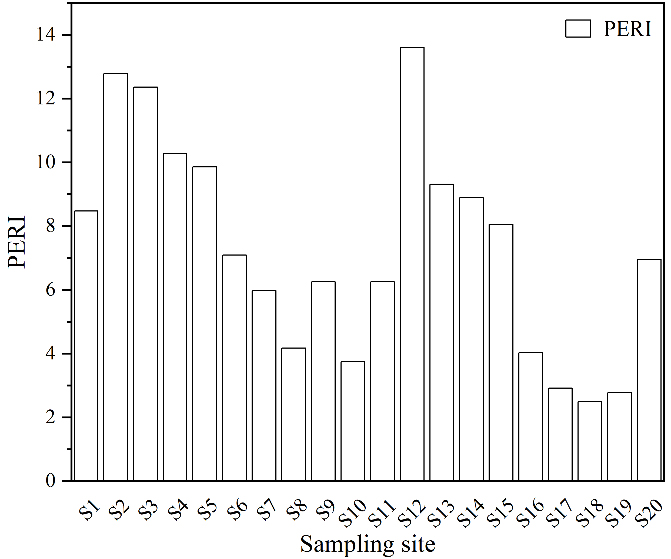
Figure 9. PERI for microplastics in the soil. PERI: Potential ecological risk index.
Limitations
The research only conducted a single sampling analysis of soil microplastics in November 2023, lacking long-term monitoring data. Microplastics undergo long-term changes in the environment. Thus, establishing a long-term microplastic monitoring system for regular sampling and analysis is crucial. We propose a detailed 2-3-year monitoring strategy that includes seasonal sampling (e.g., annually during characteristic dry and wet seasons) to capture climate impacts on microplastic dynamics. This involves sampling vertical soil profiles (e.g., 0-5 cm, 5-20 cm, 20-50 cm) to study vertical transport and ultimate fate, with the concurrent collection of meteorological data (precipitation, temperature, wind speed), key soil properties (pH, organic matter, texture, porosity), and groundwater fluctuation data. These additional parameters are crucial for linking microplastic dynamics to environmental drivers. This will reveal pollution dynamics, offering a scientific basis for assessing pollution development trends and devising effective prevention and control strategies.
The study did not conduct detailed waste classification in the landfill or track different waste types. This limits the understanding of determining the contribution of different types of garbage to soil microplastic pollution. The work in this aspect needs to be further strengthened. Further research is needed on microplastic release mechanisms during landfilling, their migration patterns, and the impact of other pollution sources such as atmospheric deposition and surface runoff on soil microplastic pollution. Additionally, research on the potential impacts of microplastics on soil organisms (such as earthworms, microorganisms, etc.) will also help deepen ecological risk assessment. Future research could employ more comprehensive detection techniques, such as Pyrolysis-Gas Chromatography/Mass Spectrometry (Py-GC/MS), enabling a more accurate assessment of the ecological risks of microplastic pollution. These in-depth explorations will enhance our understanding of soil microplastic pollution around landfills.
CONCLUSIONS
The challenges posed by plastic use and waste management are continually increasing. This study used flotation and digestion pretreatment methods to isolate and extract microplastics from the soil near the Tanggou landfill in Anyang. The physicochemical characteristics of the microplastics were analyzed employing a stereomicroscope and a micro-infrared spectroscopy system. An assessment of the risks linked to microplastics in the soil near the landfill was also conducted, with the findings indicating that:
(1) In the study area, the detection rate of microplastics in the soil was 100%. The abundance of microplastics was found to vary between 900 and 4,900 items/kg, with an average abundance of 2,632 items/kg. Additionally, it also showed certain spatial distribution characteristics. The area near the landfill had a higher average abundance of 2,915 items/kg. In contrast, the area farther from the landfill (S11 to S20) had a relatively low average abundance of 2,350 items/kg. However, the relationship with distance from the landfill was nonlinear. This indicated that the surrounding environmental conditions also influenced the abundance of microplastics in the soil.
(2) The majority of microplastics in the soil were sized less than 0.5 mm (81.03% to 100%). Moreover, as the particle size decreased, the quantity increased. The shapes of the microplastics were primarily fibers, films, and fragments, and the predominant colors were black, white, and transparent. The main polymer types detected included Rayon, PP, and PE.
(3) The results from the Pearson correlation analysis and PCA provide mutual confirmation, demonstrating that microplastic abundance was significantly influenced by soil texture and exhibited a marked positive correlation with clay content. However, there was a lack of significant correlation with soil pH, EC, or organic matter content. This may be attributed to the accumulation of microplastics in soil, which is influenced by various factors, including anthropogenic influences, natural conditions, and geographic variations.
(4) The overall PLI value for microplastics in the soil near the landfill was 1.61, indicating a moderate pollution level. The microplastic pollution load near the landfill area was higher than the overall average. The PERI ranged from 2.50 to 13.61, indicating a low potential ecological risk.
DECLARATIONS
Authors’ contributions
All authors contributed to the study conception and design.
Conceptualization: Liu, F.; Yan, B.
Sample collection: Liu, F.; Wei, J.; Wang, C.; Li, J.; Guo, A.
Laboratory analysis: Liu, F.; Wei, J.; Wang, C.; Li, J.; Guo, A.
Writing-original draft: Liu, F.
Writing-review & editing: Yan, B.
Availability of data and materials
All data generated or analyzed during this study are included in this article.
Financial support and sponsorship
This study was supported by the Open Project Program of the Key Laboratory of Marine Resource Chemistry and Food Technology, Tianjin University of Science and Technology (TUST), Ministry of Education (Grant No. EMTUST-24-03).
Conflicts of interest
All authors declared that there are no conflicts of interest.
Ethical approval and consent to participate
Not applicable.
Consent for publication
Not applicable.
Copyright
© The Author(s) 2026.
REFERENCES
1. Geyer, R. Production, use, and fate of synthetic polymers. In Plastic Waste and Recycling; Elsevier, 2020; pp 13-32.
2. Chen, S.; Hu, Y. H. Chemical recycling of plastic wastes with alkaline earth metal oxides: a review. Sci. Total. Environ. 2023, 905, 167251.
3. Napper, I.; Thompson, R. Plastics and the environment. Annu. Rev. Environ. Resour. 2023, 48, 55-79.
4. Comanita, E.; Hlihor, R. M.; Ghinea, C.; Gavrilescu, M. Occurrence of plastic waste in the environment: ecological and health risks. Environ. Eng. Manag. J. 2016, 15, 675-85.
5. Geyer, R.; Jambeck, J. R.; Law, K. L. Production, use, and fate of all plastics ever made. Sci. Adv. 2017, 3, e1700782.
6. Wright, R. J.; Langille, M. G. I.; Walker, T. R. Food or just a free ride? A meta-analysis reveals the global diversity of the plastisphere. ISME. J. 2021, 15, 789-806.
7. Webb, H.; Arnott, J.; Crawford, R.; Ivanova, E. Plastic degradation and its environmental implications with special reference to poly(ethylene terephthalate). Polymers 2012, 5, 1-18.
8. Zhang, K.; Hamidian, A. H.; Tubić, A.; et al. Understanding plastic degradation and microplastic formation in the environment: a review. Environ. Pollut. 2021, 274, 116554.
9. Thompson, R. C.; Olsen, Y.; Mitchell, R. P.; et al. Lost at sea: where is all the plastic? Science 2004, 304, 838.
10. Wei, H.; Wang, J.; Pan, S.; et al. Are wastewater treatment plants as the source of microplastics in surface water and soil? J. Hazard. Mater. 2023, 459, 132154.
11. Wang, W.; Yuan, W.; Chen, Y.; Wang, J. Microplastics in surface waters of Dongting Lake and Hong Lake, China. Sci. Total. Environ. 2018, 633, 539-45.
12. Guo, J. J.; Huang, X. P.; Xiang, L.; et al. Source, migration and toxicology of microplastics in soil. Environ. Int. 2020, 137, 105263.
13. Wang, C.; Guo, M.; Yan, B.; et al. Characteristics of microplastics in the atmosphere of Anyang City. Environ. Monit. Assess. 2024, 196, 350.
14. González-Pleiter, M.; Edo, C.; Velázquez, D.; et al. First detection of microplastics in the freshwater of an Antarctic specially protected area. Mar. Pollut. Bull. 2020, 161, 111811.
15. Napper, I. E.; Davies, B. F.; Clifford, H.; et al. Reaching new heights in plastic pollution - preliminary findings of microplastics on mount Everest. One. Earth. 2020, 3, 621-30.
16. Priya, A. K.; Jalil, A. A.; Dutta, K.; et al. Microplastics in the environment: recent developments in characteristic, occurrence, identification and ecological risk. Chemosphere 2022, 298, 134161.
17. Surendran, U.; Jayakumar, M.; Raja, P.; Gopinath, G.; Chellam, P. V. Microplastics in terrestrial ecosystem: sources and migration in soil environment. Chemosphere 2023, 318, 137946.
18. Wang, Z.; Li, W.; Li, W.; Yang, W.; Jing, S. Effects of microplastics on the water characteristic curve of soils with different textures. Chemosphere 2023, 317, 137762.
19. Ragusa, A.; Svelato, A.; Santacroce, C.; et al. Plasticenta: first evidence of microplastics in human placenta. Environ. Int. 2021, 146, 106274.
20. Jenner, L. C.; Rotchell, J. M.; Bennett, R. T.; Cowen, M.; Tentzeris, V.; Sadofsky, L. R. Detection of microplastics in human lung tissue using μFTIR spectroscopy. Sci. Total. Environ. 2022, 831, 154907.
21. Leslie, H. A.; van Velzen, M. J. M.; Brandsma, S. H.; Vethaak, A. D.; Garcia-Vallejo, J. J.; Lamoree, M. H. Discovery and quantification of plastic particle pollution in human blood. Environ. Int. 2022, 163, 107199.
22. Zhao, Q.; Zhu, L.; Weng, J.; et al. Detection and characterization of microplastics in the human testis and semen. Sci. Total. Environ. 2023, 877, 162713.
23. Yang, L.; Zhang, Y.; Kang, S.; Wang, Z.; Wu, C. Microplastics in soil: a review on methods, occurrence, sources, and potential risk. Sci. Total. Environ. 2021, 780, 146546.
24. Yang, J.; Lianzhen, L.; Qian, Z.; Ruijie, L.; Tu, C.; et al. Microplastics contamination of soil environment: Sources, processes and risks. Acta. Pedol. Sin. 2021, 58, 281-298.
25. Li, K.; He, Q.; Zhu, J.; et al. Responses of microbial communities to the addition of different types of microplastics in agricultural soils. Environ. Pollut. 2025, 364, 125220.
26. Medyńska-Juraszek, A.; Jadhav, B. Influence of different microplastic forms on pH and mobility of Cu2+ and Pb2+ in soil. Molecules 2022, 27.
27. Zhang, M.; Liu, L.; Xu, D.; Zhang, B.; Li, J.; Gao, B. Small-sized microplastics (< 500 μm) in roadside soils of Beijing, China: accumulation, stability, and human exposure risk. Environ. Pollut. 2022, 304, 119121.
28. Ma, G.; Ding, J. F.; Zhou, Y.; et al. Distribution characteristics and risk assessment of microplastics in farmland soil in Guyuan. Huan. Jing. Ke. Xue. 2023, 44, 5055-62.
29. Yu, Q.; Liu, S.; Ma, L.; Men, Z.; Li, T.; et al. Analysis on the occurrence characteristics and influencing factors of microplastics in Harbin agricultural soils. China. Environ. Sci. 2023, 43, 793-9.
30. Rillig, M. C. Microplastic in terrestrial ecosystems and the soil? Environ. Sci. Technol. 2012, 46, 6453-4.
31. Nematollahi, M. J.; Keshavarzi, B.; Mohit, F.; Moore, F.; Busquets, R. Microplastic occurrence in urban and industrial soils of Ahvaz metropolis: a city with a sustained record of air pollution. Sci. Total. Environ. 2022, 819, 152051.
32. Scheurer, M.; Bigalke, M. Microplastics in Swiss floodplain soils. Environ. Sci. Technol. 2018, 52, 3591-8.
33. Silva, A. L.; Prata, J. C.; Duarte, A. C.; Soares, A. M.; Barceló, D.; Rocha-santos, T. Microplastics in landfill leachates: the need for reconnaissance studies and remediation technologies. Case. Stud. Chem. Environ. Eng. 2021, 3, 100072.
34. Salikova, N. S.; Rodrigo-Ilarri, J.; Rodrigo-Clavero, M.; Urazbayeva, S. E.; Askarova, A. Z.; Magzhanov, K. M. Environmental assessment of microplastic pollution induced by solid waste landfills in the Akmola region (North Kazakhstan). Water 2023, 15, 2889.
35. K, M. B.; Natesan, U.; R, V.; R, P. K.; R, R.; S, S. Spatial distribution of microplastic concentration around landfill sites and its potential risk on groundwater. Chemosphere 2021, 277, 130263.
36. He, P.; Chen, L.; Shao, L.; Zhang, H.; Lü, F. Municipal solid waste (MSW) landfill: A source of microplastics? - Evidence of microplastics in landfill leachate. Water. Res. 2019, 159, 38-45.
37. Su, Y.; Zhang, Z.; Wu, D.; Zhan, L.; Shi, H.; Xie, B. Occurrence of microplastics in landfill systems and their fate with landfill age. Water. Res. 2019, 164, 114968.
38. Carr, S. A.; Liu, J.; Tesoro, A. G. Transport and fate of microplastic particles in wastewater treatment plants. Water. Res. 2016, 91, 174-82.
39. Ding, H. Evaluation and countermeasures of water environment carrying capacity in Anyang city. J. Green. Sci. Technol. 2024. , 26, 146-52.
40. Lee, H.; Kim, S.; Sin, A.; et al. Pretreatment methods for monitoring microplastics in soil and freshwater sediment samples: a comprehensive review. Sci. Total. Environ. 2023, 871, 161718.
41. Li, J.; Song, Y.; Cai, Y. Focus topics on microplastics in soil: analytical methods, occurrence, transport, and ecological risks. Environ. Pollut. 2020, 257, 113570.
42. Ranjani, M.; Veerasingam, S.; Venkatachalapathy, R.; et al. Assessment of potential ecological risk of microplastics in the coastal sediments of India: a meta-analysis. Mar. Pollut. Bull. 2021, 163, 111969.
43. Sun, X.; Gou, Y.; Yan, H.; Tang, Q.; Yang, Z.; et al. Soil microplastic pollution and distribution characteristics in a typicacotton field in northern Xinjiang, China. J. Agro-Environ. Sci. 2024, 43, 571-80.
44. Hakanson, L. An ecological risk index for aquatic pollution control.a sedimentological approach. Water. Res. 1980, 14, 975-1001.
45. Xu, P.; Peng, G.; Su, L.; Gao, Y.; Gao, L.; Li, D. Microplastic risk assessment in surface waters: a case study in the Changjiang Estuary, China. Mar. Pollut. Bull. 2018, 133, 647-54.
46. Lithner, D.; Larsson, A.; Dave, G. Environmental and health hazard ranking and assessment of plastic polymers based on chemical composition. Sci. Total. Environ. 2011, 409, 3309-24.
47. Mahesh, S.; Gowda, N. K.; Mahesh, S. Identification of microplastics from urban informal solid waste landfill soil; MP associations with COD and chloride. Water. Sci. Technol. 2023, 87, 115-29.
48. Wan, Y.; Chen, X.; Liu, Q.; Hu, H.; Wu, C.; Xue, Q. Informal landfill contributes to the pollution of microplastics in the surrounding environment. Environ. Pollut. 2022, 293, 118586.
49. Zhou, B.; Wang, J.; Zhang, H.; et al. Microplastics in agricultural soils on the coastal plain of Hangzhou Bay, east China: multiple sources other than plastic mulching film. J. Hazard. Mater. 2020, 388, 121814.
50. Grayling, K.; Young, S.; Roberts, C.; et al. The application of X-ray micro computed tomography imaging for tracing particle movement in soil. Geoderma 2018, 321, 8-14.
51. Van Cauwenberghe, L.; Claessens, M.; Vandegehuchte, M. B.; Janssen, C. R. Microplastics are taken up by mussels (Mytilus edulis) and lugworms (Arenicola marina) living in natural habitats. Environ. Pollut. 2015, 199, 10-7.
52. Islam, T.; Li, Y.; Rob, M. M.; Cheng, H. Microplastic pollution in Bangladesh: research and management needs. Environ. Pollut. 2022, 308, 119697.
53. Steinmetz, Z.; Wollmann, C.; Schaefer, M.; et al. Plastic mulching in agriculture. Trading short-term agronomic benefits for long-term soil degradation? Sci. Total. Environ. 2016, 550, 690-705.
54. Pratiwi, O. A.; Achmadi, U. F.; Kurniawan, R. Microplastic pollution in landfill soil: emerging threats the environmental and public health. Environ. Anal. Health. Toxicol. 2024, 39, e20240090.
55. Han, L. H.; Xu, L.; Li, Q. L.; Lu, A. X.; Yin, J. W.; Tian, J. Y. Levels, characteristics, and potential source of micro(meso)plastic pollution of soil in Liaohe River Basin. Huan. Jing. Ke. Xue. 2021, 42, 1781-90.
56. Romsaiyud, A.; Songkasiri, W.; Nopharatana, A.; Chaiprasert, P. Combination effect of pH and acetate on enzymatic cellulose hydrolysis. J. Environ. Sci. (China). 2009, 21, 965-70.
57. Ding, L.; Guo, X.; Du, S.; et al. Insight into the photodegradation of microplastics boosted by iron (hydr)oxides. Environ. Sci. Technol. 2022, 56, 17785-94.
58. Yang, Y.; Qiu, J.; Zhang, H.; He, P.; Lü, F. How soon will landfilled plastics integrate into the geological carbon cycle? Environ. Sci. Ecotechnol. 2025, 26, 100590.
Cite This Article
How to Cite
Download Citation
Export Citation File:
Type of Import
Tips on Downloading Citation
Citation Manager File Format
Type of Import
Direct Import: When the Direct Import option is selected (the default state), a dialogue box will give you the option to Save or Open the downloaded citation data. Choosing Open will either launch your citation manager or give you a choice of applications with which to use the metadata. The Save option saves the file locally for later use.
Indirect Import: When the Indirect Import option is selected, the metadata is displayed and may be copied and pasted as needed.
About This Article
Copyright

Data & Comments
Data
0


Comments
Comments must be written in English. Spam, offensive content, impersonation, and private information will not be permitted. If any comment is reported and identified as inappropriate content by OAE staff, the comment will be removed without notice. If you have any queries or need any help, please contact us at support@oaepublish.com.