

Scalable spray-dried graphite/CNT/silicon composites with enhanced cycling stability for Li-ion battery anodes
 0
0 
Abstract
This study presents a scalable and cost-effective spray-drying method for synthesizing graphite/silicon/carbon nanotube (G-Si-CNT) composites as high-performance anodes for lithium-ion batteries. By integrating graphite fines, nano-silicon (nSi), and a low loading
Keywords
INTRODUCTION
With the rapid expansion of electric vehicles, there is a growing demand for lithium-ion batteries (LIBs) that offer high gravimetric and volumetric energy densities[1,2]. Silicon (Si) has been considered a promising candidate for high-capacity anodes due to its high theoretical capacity (3,579 mAh·g-1 for Li15Si4,), suitable charge/discharge voltage plateau (0.1-0.4 V vs. Li/Li+), in addition to its abundance, low cost and environmental friendliness[3-5]. However, the widespread use of Si anodes is hindered by challenges such as low electrical conductivity (2.52 ×
To address these challenges and ensure industrial viability, extensive research has focused on developing silicon-carbon (Si-C) composites by integrating Si particles with various carbon materials[7], including amorphous carbon, carbon nanotubes (CNTs)[8-11], carbon fibers[12,13], graphene[14-17], graphite and graphite flakes[18,19], etc. These composites utilize the conductive properties of the carbon matrices to enhance electrical conductivity and incorporate voids to accommodate the volume changes of Si particles. Furthermore, the exceptional mechanical properties of CNTs and graphene can significantly enhance the conductivity and structural integrity of the electrode during the battery’s cycling process, thereby improving the cycling stability of the Si-C composite electrode. For instance, Xu et al. developed Si-carbon composite spheres (G-Si-CNT) by embedding silicon particles in graphene and CNTs using spray drying and chemical vapor deposition (CVD)[15]. These spheres are highly resilient, withstanding over 100 MPa during calendering, and show excellent cycling stability and rate performance, delivering 1,572 mAh·g-1 at 0.1 A·g-1 after 100 cycles (88% retention) and 907 mAh·g-1 at 1 A·g-1 after 700 cycles (90% retention). The porous structure accommodates Si volume expansion, while the graphene-CNT framework enhances conductivity and reduces resistance. Although CVD growth of CNTs or graphene in Si/C composites improves electrochemical performance, the high specific surface area (SSA), low tap density, and complex, difficult-to-scale process limit volumetric energy density and industrial scalability. In some studies, when commercially available CNTs or graphene are incorporated into composites, a substantial improvement in cycling stability and rate performance has been reported[9,20-22]. However, most research on CNT-integrated composites employs high CNT content (> 10 wt%); investigations into low-CNT-content Si/C composites are limited and deserve further exploration.
From a practical perspective, graphite or graphite flakes serve as a more effective matrix than pyrolytic carbon from carbon precursors or CVD-grown CNTs/graphene. Graphite offers high electrical conductivity, comparable to other carbon materials, while micro-sized graphite or graphite flakes significantly improve tap density - a key parameter for anode materials in commercial LIBs[23]. Additionally, graphite is substantially less expensive than CNTs or graphene, making it an economical choice for large-scale production. For example, graphite-based Si/C composites have achieved a tap density value of 0.91 g·cm-3, approaching the industrial anode requirement of 1 g·cm-3[17]. To overcome these limitations, cost-effective and scalable alternatives are needed, prompting the exploration of graphite-based Si/C composites with low content of CNTs.
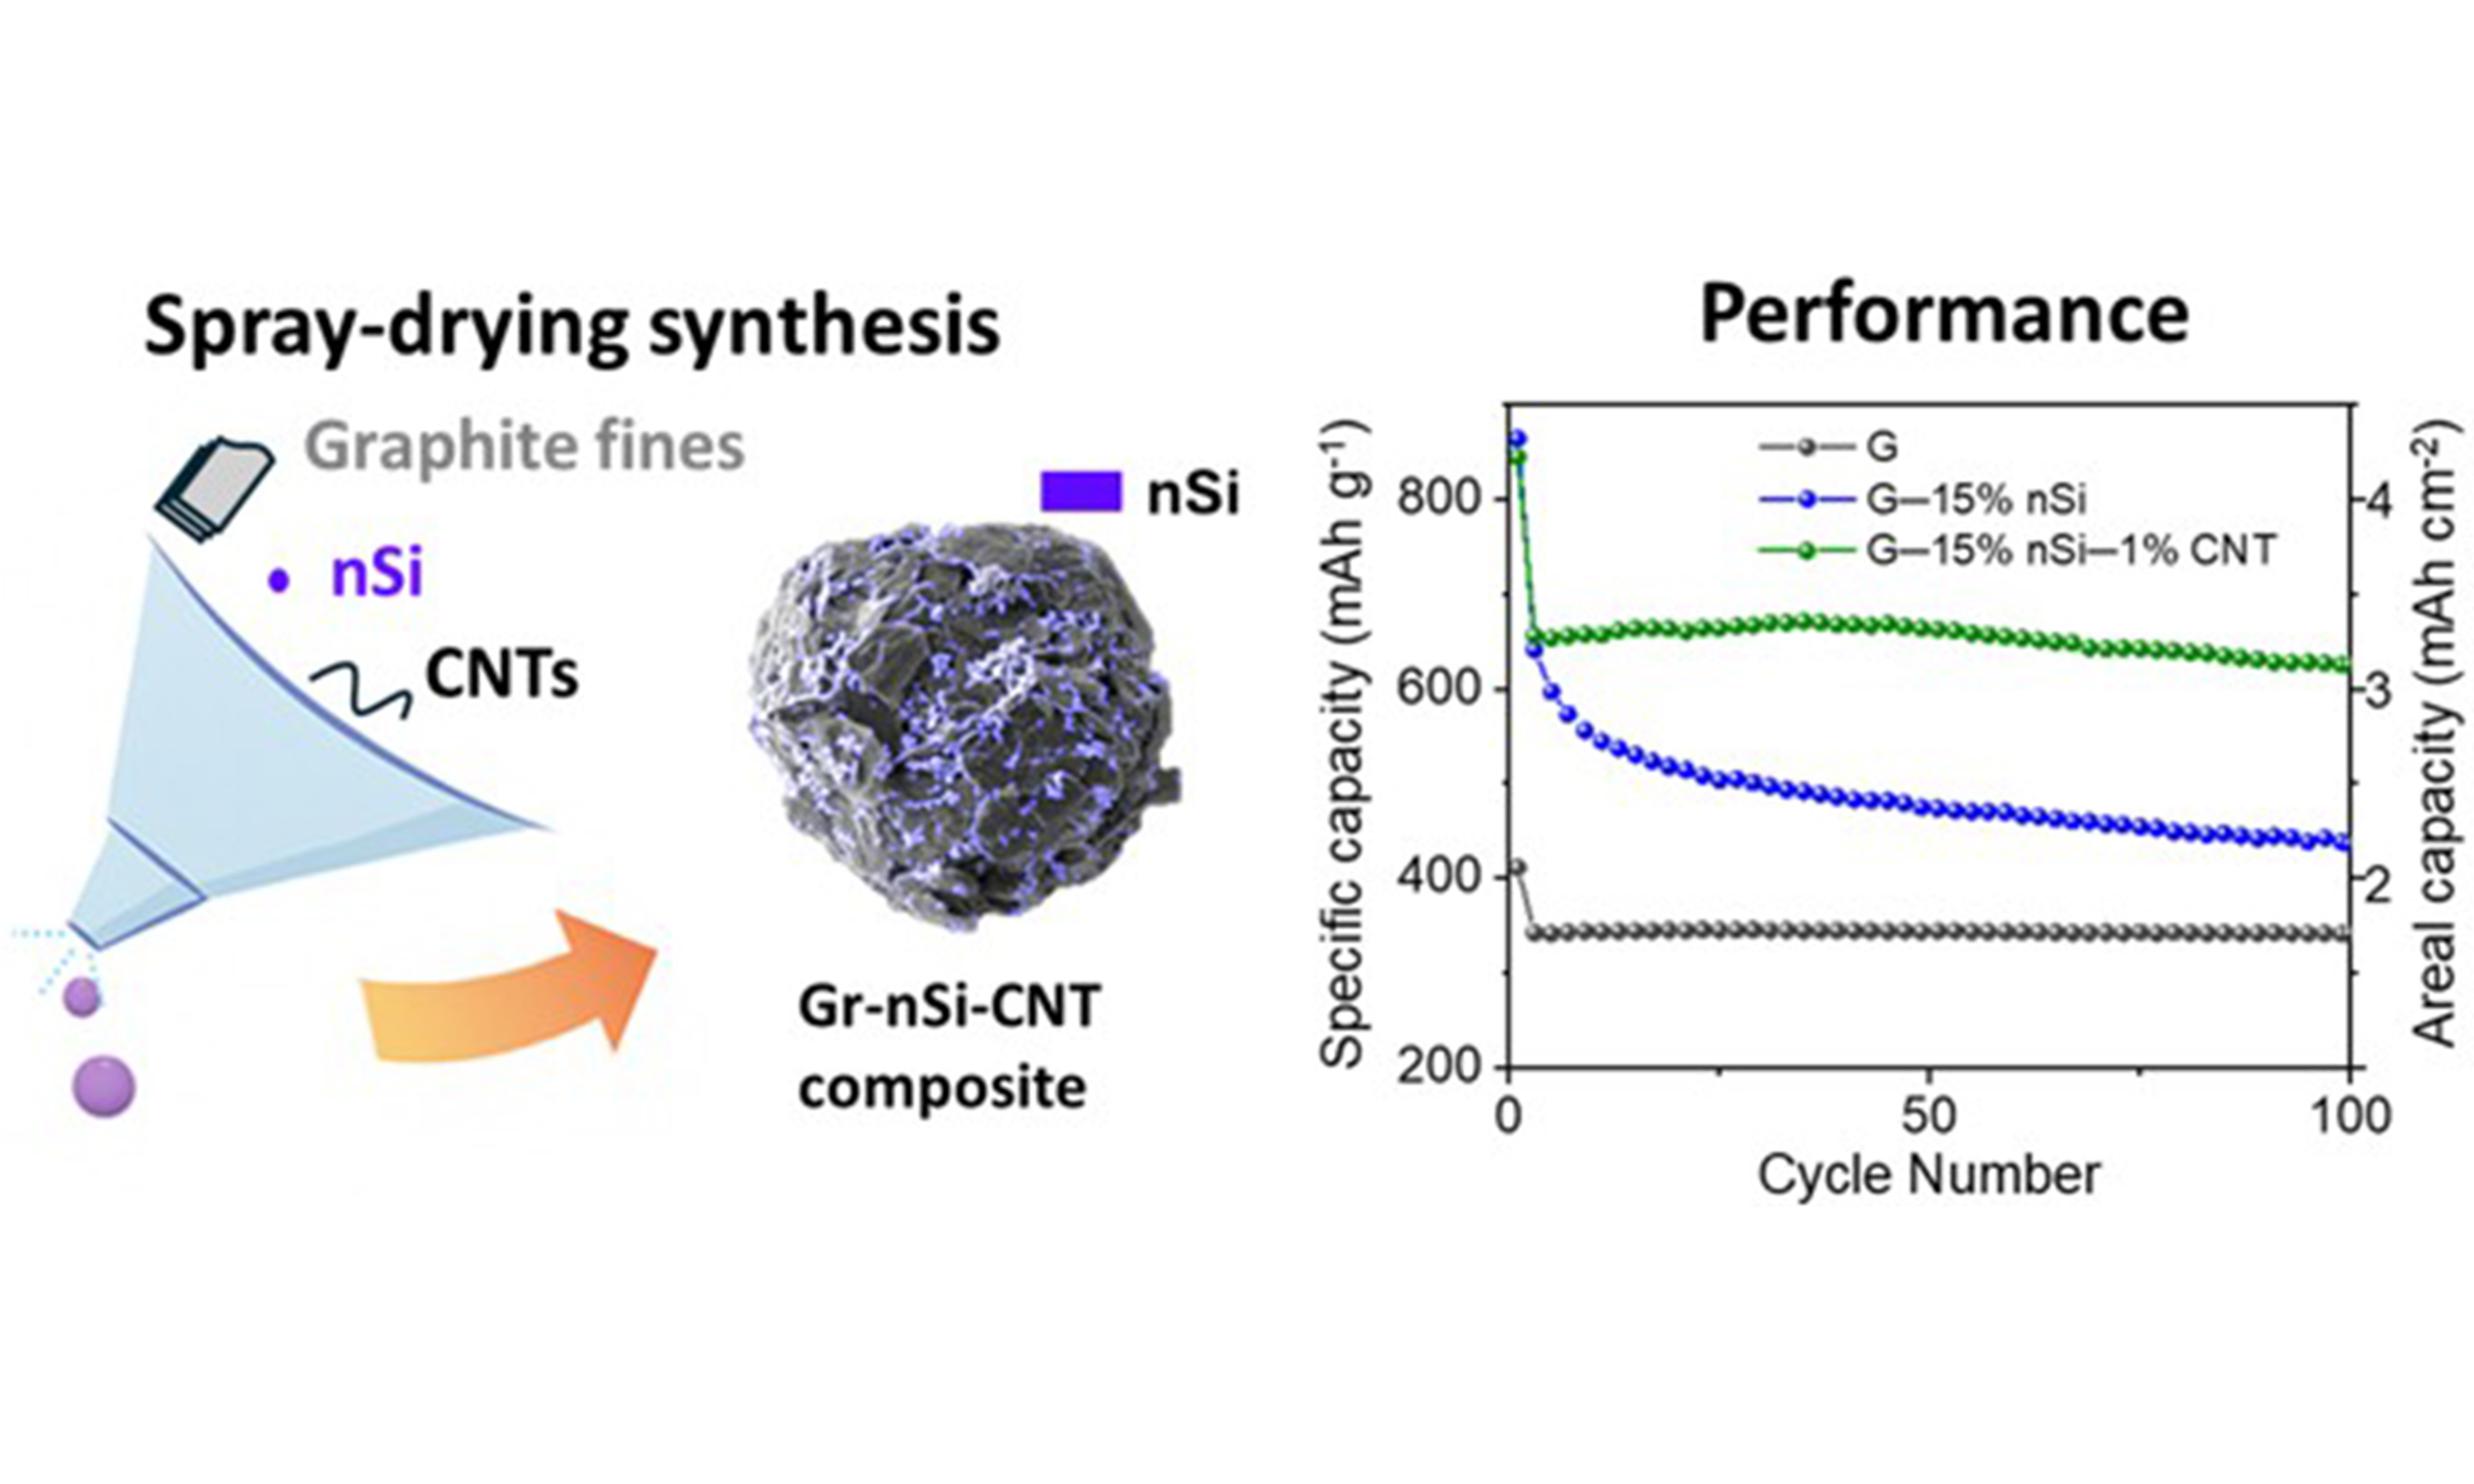
In our prior work, low-cost by-products from natural graphite spheroidization, graphite fines, were effectively recycled using the spray drying method, a scalable and cost-effective technique for producing uniform spherical particles[24]. By optimizing key parameters, including graphite content, graphite-to-binder ratio, feed rate, and atomization pressure, we produced particles with diameters of 10-50 µm and a D50 (median diameter) of approximately 17 µm, aligning with commercial specifications for size and shape. These agglomerates delivered electrochemical performance comparable to commercial graphite. Building on this expertise, this study introduces a scalable one-step spray drying method to synthesize spherical graphite/silicon composites integrated with a low loading (1 wt%) of single-walled CNTs. Unlike previous approaches relying on high CNT content or complex processes such as CVD, which increase costs and limit scalability, this method achieves significant improvements in cycling stability and rate performance with low CNT loading, highlighting a cost-effective and industrially feasible solution for high-performance Si-based anodes.
EXPERIMENTAL
Reagents
Natural graphite fines (fNG, containing 99.7% carbon, D50 ≈ 7 µm), a by-product of the spheroidization of purified natural graphite flakes, were supplied by Nouveau Monde Graphite (Canada) and used as received. Micro-silicon (μSi) powder (APS 1-5 µm, 99.9%) was purchased from Alfa Aesar, and nano-silicon (nSi) powder (APS 50 nm, > 97%) was purchased from TRUNNANO. Single-walled CNT dispersion [TUBALLTM BATT H2O, 0.4 wt% CNTs, 0.6 wt% carboxymethyl cellulose (CMC), 99 wt% H2O] was obtained from OCSiAl. Sodium CMC (average molecular weight ≈ 90 kDa, degree of substitution 0.7), citric acid (CA,
Preparation of G-Si and G-Si-CNT composites
Graphite fines and Si powders were agglomerated using a spray-drying process (Pilotech, YC-015). This method was validated in our earlier work on the re-agglomeration of graphite fines, which investigated the spray-drying and feedstock parameters required to engineer agglomerates with controlled particle size[24]. Building on these findings, the fNG content in the formulation was adjusted accordingly to account for the incorporation of Si in the mix. The feedstock for spray drying was a slurry consisting of 72 wt% deionized water, 4 wt% CMC binder, and 24 wt% active material. The active material consisted of specific ratios of graphite fines and Si powder (µSi or nSi) (100:0, 95:5, 91:9, and 85:15), designed to assess the impact of Si particle size and content on the cycle life of the materials. For CNT-integrated composites, the active material is composed of 84 wt% graphite fines, 15 wt% nSi, and 1 wt% CNTs. All the slurries were blended using a resonant acoustic mixer (RAM, ResoDyn LabRAM) operating at approximately 50 G for 30 min. The spray-drying conditions, including inlet temperature, air blow, and feed rate, were adjusted at 210 °C,
Spray-dried powders were heat-treated in a tube furnace (Thermo Scientific Thermolyne F21125) under an argon atmosphere to carbonize the CMC binder. The thermal treatment followed a heating rate of 2 °C·min-1 from room temperature to 1,000 °C, with a 2 h dwell at the final temperature, followed by natural cooling to room temperature. The mass loss associated with CMC carbonization during heat treatment for CNT-free materials was approximately 11.5%, representing about 80.5% of the CMC content. As a result, the heat-treated powders contain about 3.1% of residual carbon and exhibit graphite contents of 92.1%, 88.1%, and 82.3%, with corresponding Si content of 4.8%, 8.8%, and 14.6%, hereafter referred to as G-5% nSi, G-9% nSi, and G-15% nSi, respectively. Similarly, the mass loss for the G-15% nSi-CNT composite was approximately 9.7%, accounting for about 87.7% of the CMC, resulting in a powder composition of 84.2% G, 14.8% Si, and 1% CNTs (denoted as G-15% nSi-CNT). A graphite agglomerate without Si was used as a reference, denoted GA. After heat treatment, the powders were classified using a GilSonic autosiever (G-6) through a 45 µm stainless-steel mesh.
Material characterization
The morphology of the spray-dried and heat-treated agglomerates was analyzed using scanning electron microscopy (SEM, TESCAN VEGA3). Cross-sectional images of agglomerate particles in powder form, as well as in pristine and cycled electrodes, were acquired using a focused ion beam-scanning electron microscope (FIB-SEM, TESCAN LYRA3) equipped with a gallium ion source.
The particle size distribution (PSD) was determined using a Bettersizer ST laser particle analyzer with water as the dispersion medium.
The tapped density of the powder was determined by using a Dual Autotap from QUANTA CHROME. A
X-ray diffraction (XRD) analysis was performed on a Bruker D8 Advance diffractometer with a Cu Kα radiation source (λ = 0.15406 nm, 40 kV, 40 mA). Diffraction patterns were collected in continuous-scan mode using a 2θ increment of 0.02° and a counting time of 2 s per step.
N2-adsorption isotherms were acquired using an Autosorb iQ system from Quantachrom Instruments. The SSAs were analyzed as a function of the pore size using the Quenched solid density functional theory (QSDFT) model implemented in the ASiQWIN analysis software.
X-ray nano-holo-tomography analyses were carried out at the European Synchrotron Radiation Facility (ESRF) at beamline ID16B[25]. Samples with a diameter of approximately 1 mm were obtained by hole-punching the electrode sheets. The extracted samples were encapsulated under an argon atmosphere within PFA (perfluoroalkoxy) tubes and sealed with glue after mounting on brass analysis pins. The experimental conditions for data acquisition, as well as methods for 3D reconstruction and image analysis, were reported in our previous work[24]. Briefly, four distances holotomography measurements have been carried out with 50 nm voxel size, 30 ms exposure time per projection (3,203 in total) and 29.6 keV beam energy. The total acquisition time per sample was around 10 min. The different phases were segmented using a machine learning based random forest classifier embedded within the Ilastik software, with a probability threshold set at 0.85[26]. Image analysis was conducted on the entire reconstructed volume using ImageJ software[27], and three-dimensional visualization was carried out with the dedicated volume viewer plugin available in the same software.
Electrode preparation, cell assembly and cycling conditions
Electrodes were prepared by mixing a slurry containing 461 mg of active material, C65, CMC, and SBR in a mass ratio of 92.5:1.0:2.0:4.5, along with 849 μL of a pH3 buffer solution. The slurry was blended with a RAM mixer at approximately 40 g for 30 min. The pH3 buffer solution was prepared from 0.173 M CA and
The slurry was cast onto 25 µm-thick copper foil using a doctor blade applicator with a 200 µm blade gap, dried under ambient conditions in air for 24 h, and subsequently calendered using a rolling cylinder press (MSK-HRP-MR100DC, Zhengzhou CY Scientific Instruments) to achieve 30%-33% porosity, corresponding to an electrode density of approximately 1.4 g·cm-3. The areal mass loading of active material was approximately 5 mg·cm-2, with final electrode composition (after drying) of 86.9 wt% active material,
The galvanostatic charge/discharge cycling tests were performed on a Neware BTS4000 System within a voltage window of 1 V and 10 mV vs. Li/Li+ under controlled ambient temperature (21 ± 2 °C) to guarantee reproducibility and stability of the measurements. Discharge and charge steps refer to lithiation and delithiation processes, respectively. Cells were rested at open-circuit voltage (OCV) for 2 h before cycling. Two formation cycles were conducted at C/20, followed by cycling at C/9. C-rates were calculated from the theoretical capacity (Ctheo) of the active mixture using 372 mAh·g-1 for graphite (LiC6) and 3,579 mAh·g-1 for Si (Li15Si4)[29]: Ctheo = ωSi × 3,579 mAh·g-1 + (1 - ωSi) × 372 mAh·g-1, where ωSi represents the silicon mass fraction. Thus, 1 C corresponds to 372, 532.4, 660.6, and 853.1 mA·g-1 for 0, 5, 9, and 15 wt% Si, respectively, and the applied C/20 and C/9 currents were scaled accordingly. The capacities are expressed in mAh per gram of active material and were averaged from triplicate cycling tests.
Rate performance was evaluated by charging (delithiation) at various C-rates ranging from C/10 to 4C, followed by a constant-voltage (CV) step at 1 V with a cut-off current of C/50, while discharging was conducted at C/10.
Electrochemical impedance spectroscopy (EIS) measurements were performed in a three-electrode configuration in T-shaped Swagelok®-type cells using a VMP-300 potentiostat/galvanostat (Bio-Logic Science Instruments) controlled by EC-Lab® software. The working electrode (WE) and the opposing lithium metal counter electrode (CE) were positioned in the central section of the T-shaped Swagelok® cell, in close proximity to an additional lithium piece placed at the T-junction, which served as the reference electrode (RE). This configuration minimizes solution resistance and ensures stable potential control during impedance measurements. A borosilicate glass-fiber separator (Whatman GF/D) was placed between the WE and RE, as well as between the WE and CE. The electrode dimensions and electrolyte volume were identical to those used in the two-electrode configuration described above. This setup allows direct assessment of the working electrode impedance, independent of the counter (lithium) electrode contribution[30]. Following the formation process, impedance spectra were recorded at OCV by applying a 5 mV AC (alternative current) perturbation over the frequency range of 200 kHz to 10 mHz. The resulting spectra were analyzed and fitted using a Randles-type equivalent circuit within EC-Lab®.
RESULTS AND DISCUSSION
Crystalline structure
Figure 1 shows the XRD patterns of the raw materials fNG and nSi, and the spray-dried composites G-15% nSi and G-15% nSi-CNT. The diffractogram of fGN exhibits the characteristic reflections of hexagonal graphite (2H phase) observed at 2θ = 26.4°, 42.3°, 44.6°, 54.6°, and 77.5°, indexed to the (002), (100), (101), (004), and (110) planes, respectively. Additionally, peaks corresponding to (101) and (012) rhombohedral graphite reflections are observed at 2θ = 43.4° and 46.1°, respectively [Joint Committee on Powder Diffraction Standards (JCPDS) card No. 26-1079]. The nSi powder exhibits diffraction peaks of (111), (220), (311), (400), (331), and (422) located at 2θ = 28.4°, 47.3°, 56.1°, 69.1°, 76.3°, and 88.0°, respectively, which are indicative of Si with a cubic structure (JCPDS card No. 27-1402). Both G-15% nSi and G-15% nSi-CNT composites retain these peaks, confirming that spray-drying and subsequent heat-treatment do not alter the crystalline structure of the pristine materials. The presence of CNTs in the G-Si composite is not detected by XRD due to its low amount (1 wt%) and limited crystallinity.
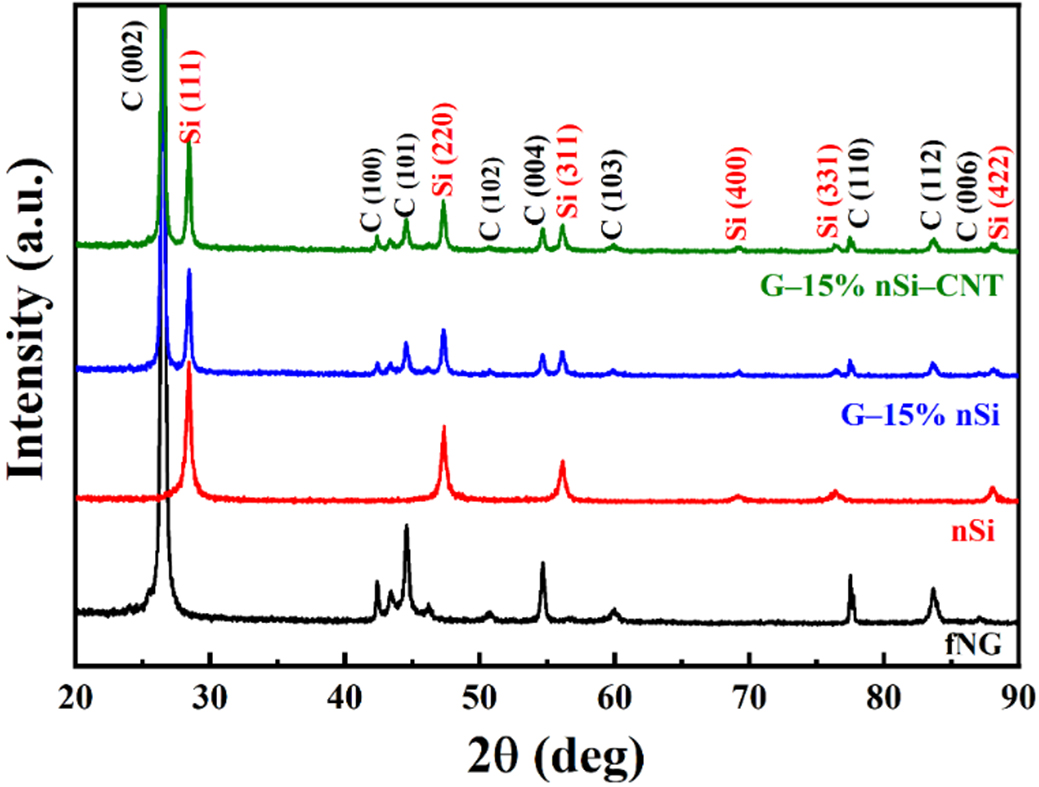
Figure 1. XRD patterns of fNG, nSi, G-15% nSi, and G-15% nSi-CNT. XRD: X-ray diffraction; fNG: natural graphite fines; nSi: nano-silicon; CNT: carbon nanotube.
Morphology
The morphological features of the raw materials and agglomerated products are depicted in Figure 2. The SEM image of graphite fines [Figure 2A] exhibits distinctive flake-shaped particles, whereas the µSi and nSi powders (Figure 2B and C, respectively) show distinguishable particle morphologies and sizes. The µSi particles are a few micrometers in size, while the nSi particles, several nanometers in size, tend to form aggregates. The spray-dried composites containing 9% µSi and 9% nSi are presented in Figure 2E and F, respectively. All agglomerated materials exhibit high sphericity as reported in our previous work[24]. In comparison with graphite-only agglomerate [Figure 2D], the G-9% µSi composite shows µSi particles on the agglomerate surface, highlighted with blue cycles. As for the composite containing 9% nSi [Figure 2F], small nSi aggregates are visible on the particle surface marked with orange cycles. Similarly, in the composites with 15% of nSi and 1% of CNTs [Figure 2G], nSi aggregates are also observed on the surface, accounting for 13%-18% of the particle surface (see Supplementary Figure 1 in Supplementary Materials). An enlarged surface view of G-15% nSi-CNT [Figure 2H] reveals the presence of both nSi and CNTs. Some CNTs are visible on the surface of the graphite (highlighted with red dashed circles), while others appear to provide connections between the nSi aggregates and the graphite surface (marked with light green box). The FIB-SEM cross-sectional image of G-15% nSi-CNT composite [Figure 2I] displays layered graphite flakes with nSi and CNTs embedded within the porous agglomerates (porosity of ~22%), confirming their incorporation into the graphite matrix via spray-drying, with an internal loading of nSi in the agglomerates of ~14% (estimated from the cross-section area; see Supplementary Figure 1 in Supplementary Materials). Such a composite morphology can be explained by the fact that during spray drying, the slurry is dispersed into micron-sized droplets, each containing a representative fraction of the solid components. As the solvent evaporates, capillary forces drive the solids toward the droplet surface, promoting close packing and the formation of dense agglomerates. The graphite fines form the primary structural framework, while Si particles and CNTs become embedded within this network as the droplet dries and solidifies. We previously demonstrated that this spray-drying route reliably agglomerates graphite fines into mechanically robust secondary particles[24], and the same mechanism underlies the formation of the graphite-Si-CNT composites studied in this work.
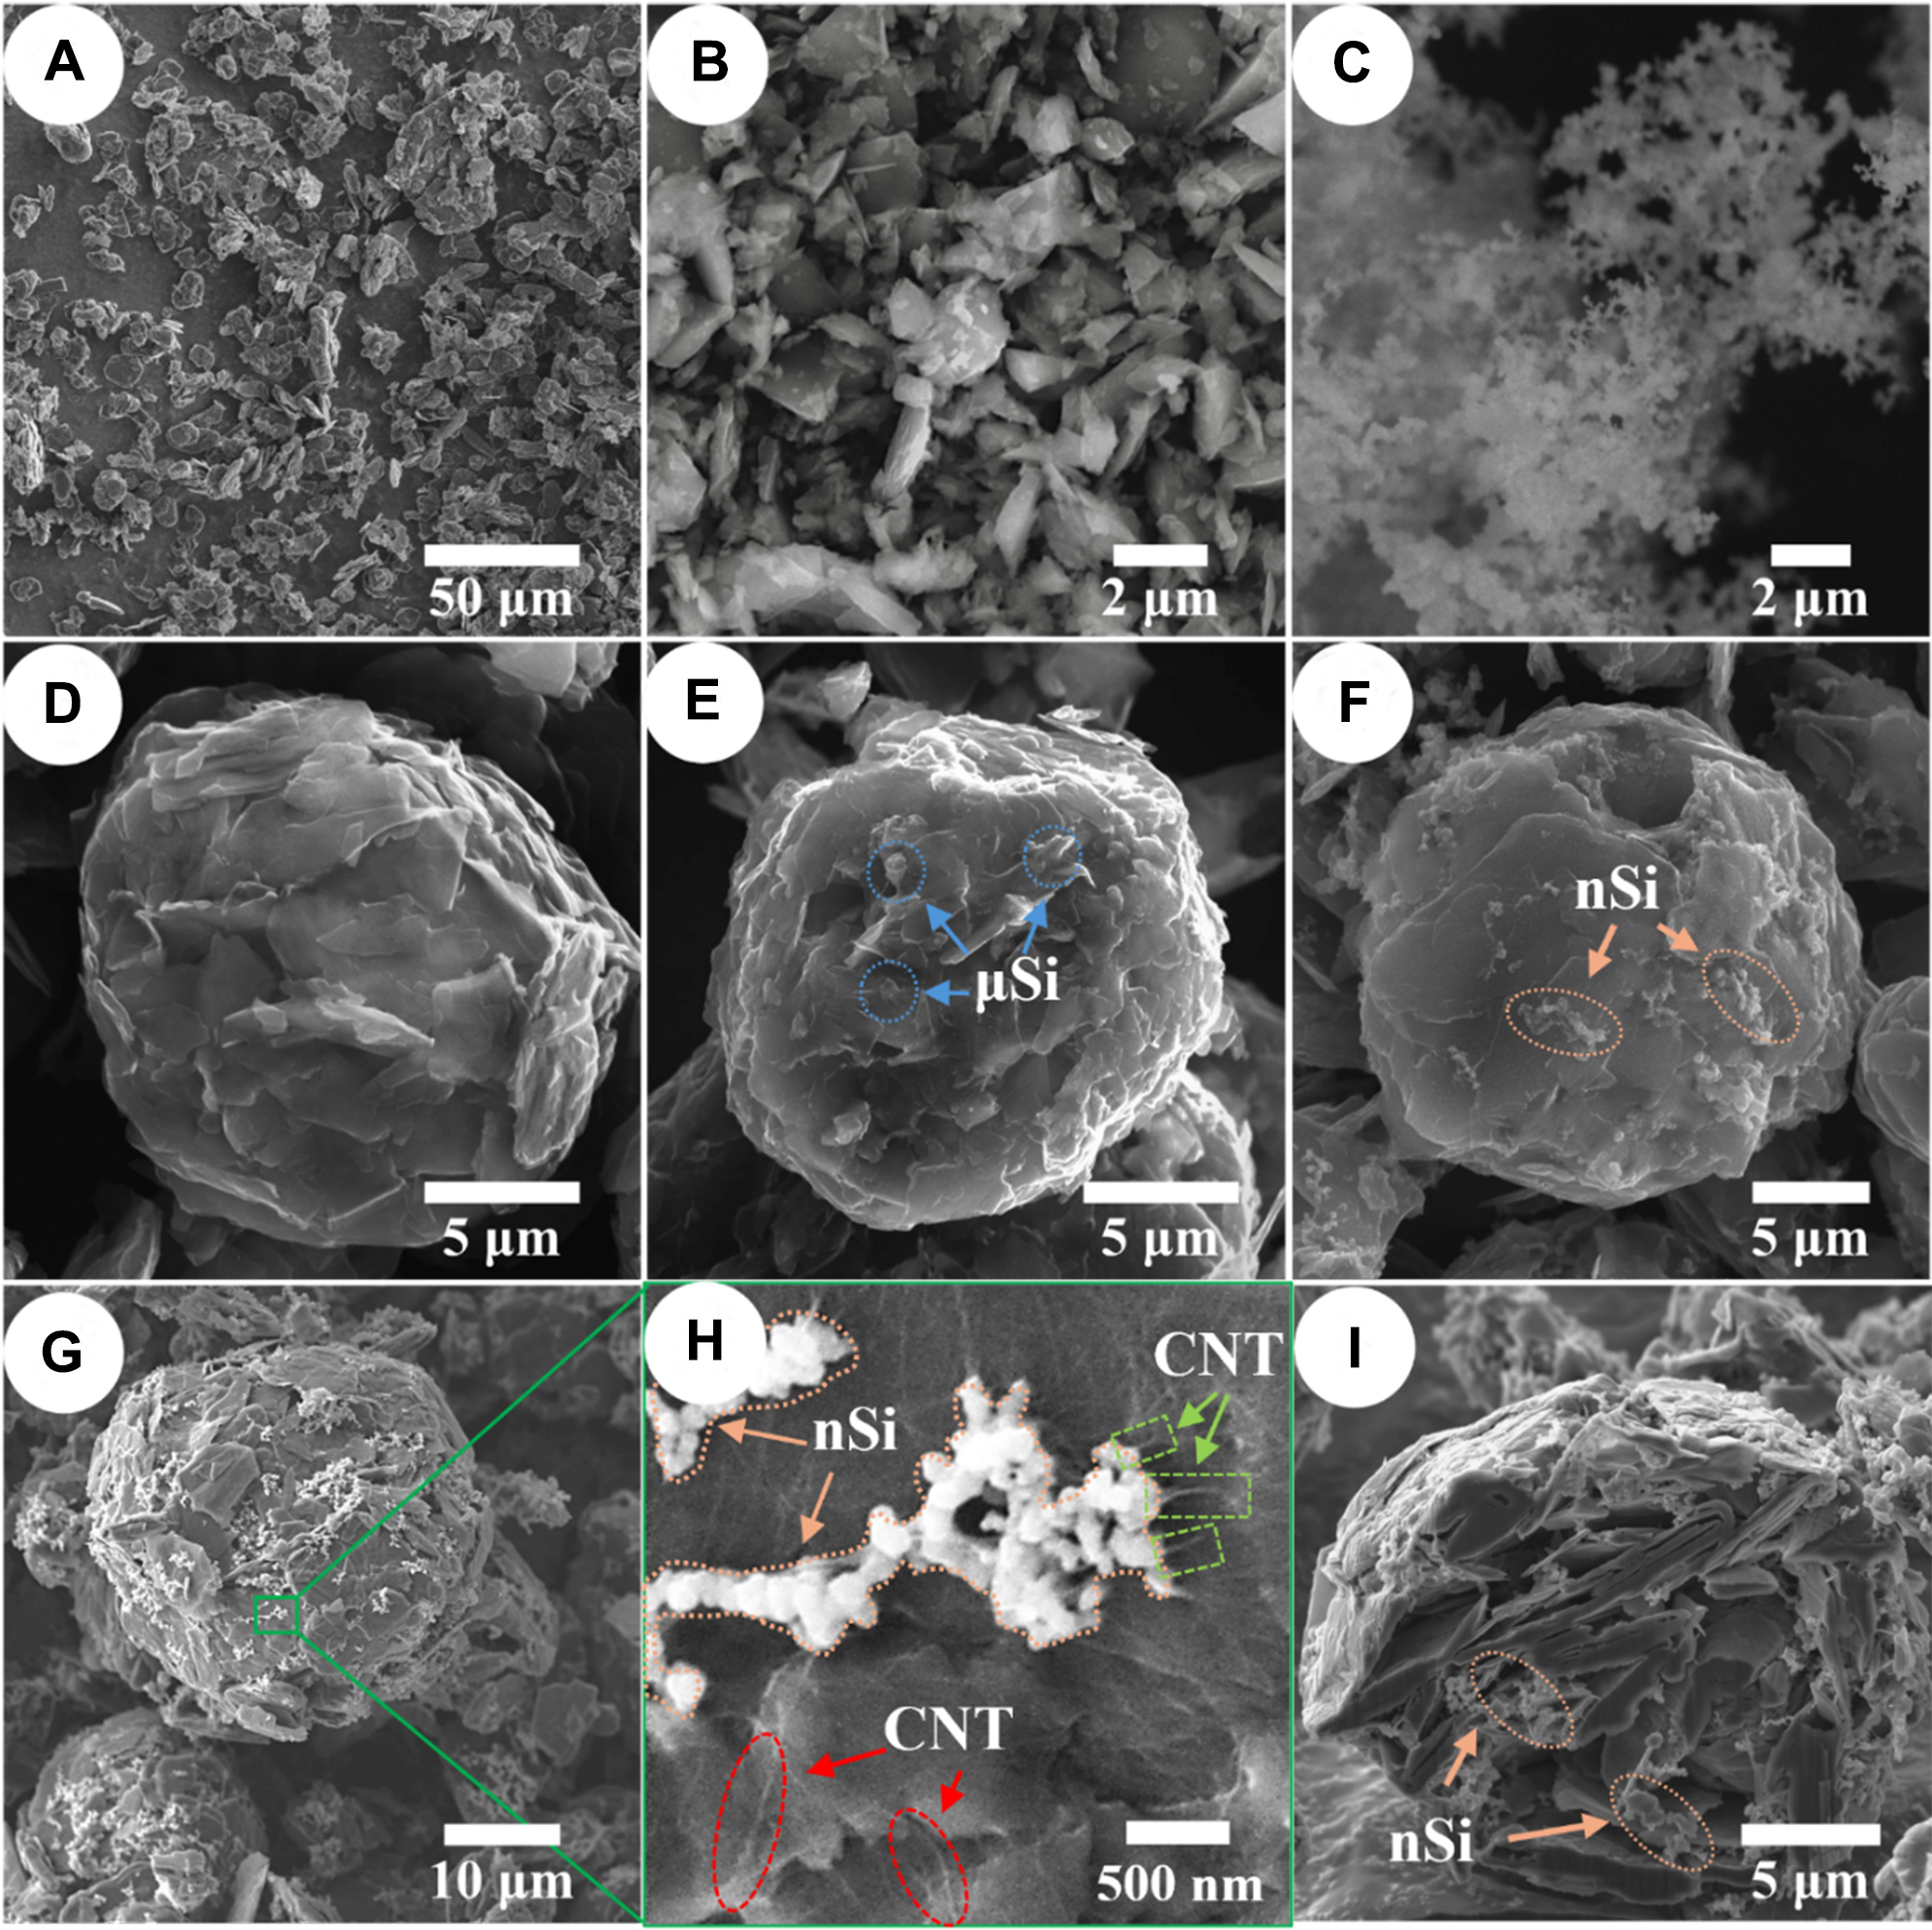
Figure 2. SEM images of (A) fNG, (B) µSi, (C) nSi, (D) GA, (E) G-9% µSi, (F) G-9% nSi, (G) G-15% nSi-CNT (lower magnification), (H) G-15% nSi-CNT (higher magnification), and (I) FIB cross-section of G-15% nSi-CNT. SEM: Scanning electron microscopy; fNG: natural graphite fines; µSi: micro-silicon; nSi: nano-silicon; GA: graphite agglomerate; CNT: carbon nanotube; FIB: focused ion beam.
Transmission electron microscopy (TEM) characterization would provide additional insight into the Si-CNT interface and nanoscale dispersion within agglomerates; however, TEM analysis was not conducted in this study due to equipment unavailability and the challenge of preparing ultra-thin specimens from agglomerates > 10 µm.
The PSD curves in Figure 3 confirm successful agglomeration of graphite fines and Si powders, evidenced by the increase by a factor of 2-3 in D10, D50, and D90 after spray drying with respect to the raw graphite fines [Table 1], validating the slurry formulation and spray-drying parameters for achieving particle sizes suitable for battery applications. Moreover, the comparison with the PSD curve of only graphite agglomerate demonstrates that the addition of µSi or nSi does not significantly change the PSD of the agglomerated product. However, there is a slight decrease in agglomerate size with the addition of CNTs.
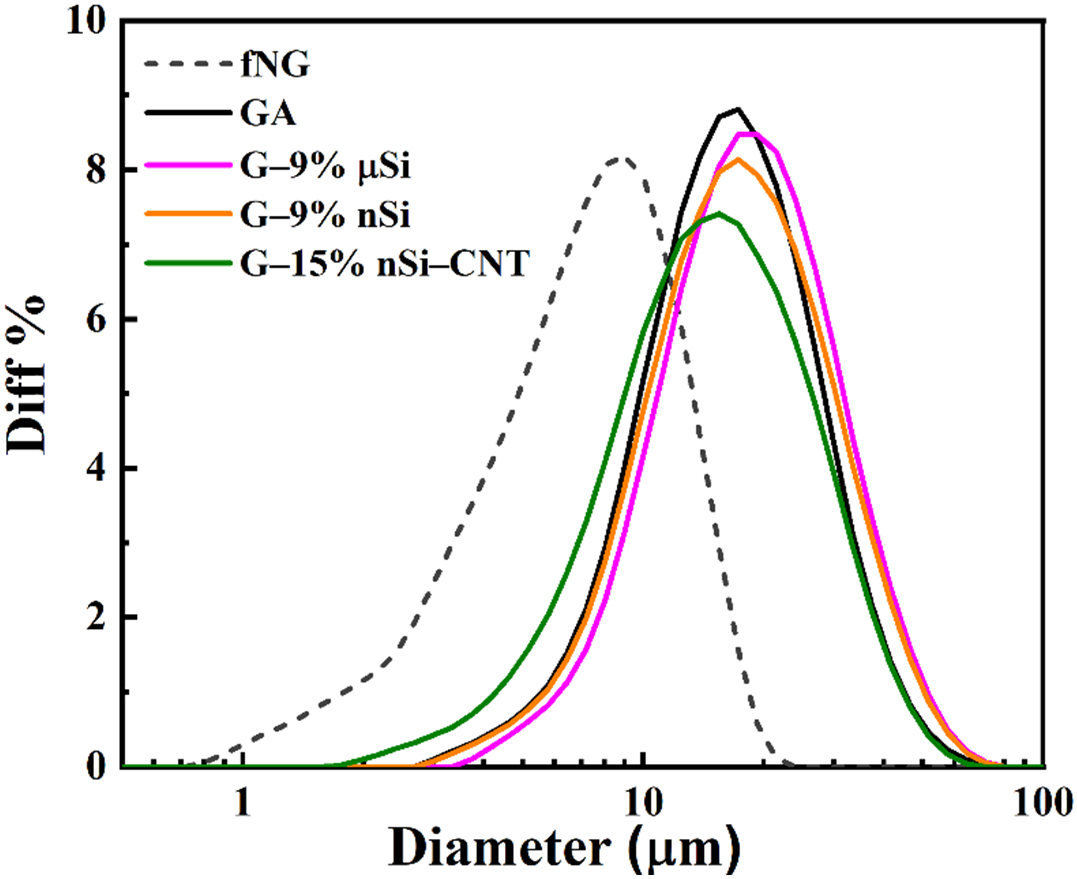
Figure 3. PSD curves of the materials. PSD: Particle size distribution; fNG: natural graphite fines; GA: graphite agglomerate; μSi: micro-silicon; nSi: nano-silicon; CNT: carbon nanotube.
Main morphological characteristics of the materials
| Sample | D10 (µm) | D50 (µm) | D90 (µm) | SSA (m2·g-1) | Smicropore (m2·g-1) | Smesopore (m2·g-1) | Tapped density (g·cm-3) |
| fNG | 2.7 | 6.9 | 12.3 | 9.5 | 4.7 | 4.8 | 0.34 |
| nSi | - | - | - | 12.0 | 0 | 12.0 | 0.11 |
| GA | 8.0 | 16.5 | 36.7 | 20.3 | 11.3 | 9.0 | 0.47 |
| G-9% µSi | 8.2 | 17.1 | 39.9 | 3.7 | 1.6 | 2.1 | 0.47 |
| G-5% nSi | 8.1 | 17.8 | 37.7 | 5.0 | 0.2 | 4.8 | 0.47 |
| G-9% nSi | 8.0 | 16.4 | 37.0 | 4.4 | 2.5 | 2.4 | 0.44 |
| G-15% nSi | 7.7 | 15.8 | 32.0 | 7.3 | 2.5 | 4.8 | 0.40 |
| G-15% nSi-CNT | 6.2 | 14.0 | 28.2 | 11.9 | 5.6 | 6.3 | 0.49 |
Table 1 shows the tapped density of the raw materials and agglomerated composites. The tapped densities of raw nSi and fNG are 0.11 and 0.37 g·cm-3, respectively. Spray-dried G-nSi composites demonstrate higher tapped densities than the raw materials. For instance, the composite with 5 wt% nSi has a tapped density of 0.47 g·cm-3, equivalent to that of graphite agglomerates without silicon. However, as the nSi content increases to 9 wt%, the tapped density decreases to 0.44 g·cm-3, then to 0.40 g·cm-3 for the composite with 15 wt% of nSi. This decline is attributed to the inherently low tapped density of nSi (0.11 g·cm-3), which diminishes the overall packing efficiency of the composite. Interestingly, Gr-15% nSi-CNT composites exhibit a higher tapped density than their CNT-free counterparts Gr-15% nSi, 0.49 vs. 0.40 g·cm-3. This increase can be attributed to the role of CNTs in enhancing particle packing within the agglomerates. The CNTs, with their high mechanical strength and flexibility, likely improve the structural integrity and interparticle bonding of the composite particles, enabling tighter and more uniform packing during the tapping process. The tapped density is rarely reported in graphite-nSi composites. The current tapped density of Gr-15% nSi-CNT in this work is still lower than the value of 1.0 g·cm-3 required for commercial anode graphite[31,32], but it represents a significant improvement over the raw materials and CNT-free variants. The tapped density can be optimized by fine-tuning the spray-drying and pitch-coating parameters, and this work lays the foundation for further refinement toward achieving industrial standards.
The SSA, the sum of the micropore and mesopore areas, of the different materials is listed in Table 1. The greater SSA of GA (20.3 m2·g-1) in comparison with fNG (9.5 m2·g-1) is mainly due to the microporosity formed upon carbonization of the CMC binder, as previously reported[24]. Interestingly, the SSA of the agglomerate composites was substantially reduced with the integration of Si, whether µSi or nSi. For instance, the SSA is reduced to 4.4 m2·g-1 for G-9% nSi and 3.7 m2·g-1 for G-9% µSi. As suggested from the previous FIB-SEM cross-section image [Figure 2I], it may be because both nSi and µSi particles serve as gap fillers between graphite flakes within the agglomerates, reducing micro- and meso-porosity compared to graphite-only agglomerates. However, when the nSi content is increased to 15%, excess nSi aggregates on the surface of graphite flakes, leading to an increase in surface area, particularly in the mesopore area. The incorporation of CNTs further enhances the micropore area in these composites compared to their counterparts without CNTs.
To assess the effect of electrode calendering on the morphology of the agglomerates, X-ray nano-holo-tomography was performed on the G-9% nSi electrode before and after calendering. Note that the analyses were limited to this formulation due to a limited amount of beam time allocated for these experiments. The analysis conducted on the G-9% nSi electrode is considered as representative of the structural evolution expected in the higher (15%) nSi-loading composite. Figure 4A and B shows the 3D representation of these electrodes with a close-up view of an agglomerate. A net decrease in electrode porosity is observed after calendering, from 64% to 39% (-36% relative), resulting in an overall increase in electrode density from 0.6 to 1.4 g·cm-3. The electrode density before calendering agrees with the theoretical value estimated from the electrode composition (0.53 g·cm-3, 61% porosity), whereas after calendering it is slightly higher than the targeted range of 30%-33%. This difference may be due to partial relaxation of the electrode microstructure after the applied pressure is released. On the agglomerated particle side, the particles change from a spheroidal shape with an average size of 25 × 20 × 20 μm3 to an elongated shape of 9 × 9 × 3 μm3, showing a drastic reduction in inner porosity from 31% to 9.5% (i.e., a relative decrease of 70%). In addition to increasing energy density, calendering the electrode reduces the inner porosity of agglomerated particles, which may mitigate the exacerbated irreversible capacity loss caused by electrolyte decomposition at the active material surface. Meanwhile, the porous network intra-connectivity of both electrodes remains similarly high, at 99.8% and 98.9% for the non-calendered and calendered electrodes, respectively, indicating that the overall porosity - and thus the active material - is well accessible to the electrolyte. However, the compression step affects the global geometrical tortuosity of the electrodes, as highlighted by the color-scale shift between the geodesic distance maps, representing the geometrical path lengths required for accessing different parts of the electrode. Hence, more tortuous diffusion pathways are obtained for the calendered electrode [Figure 4C and D]. Moreover, decoupling between the in-plane and through-plane contributions
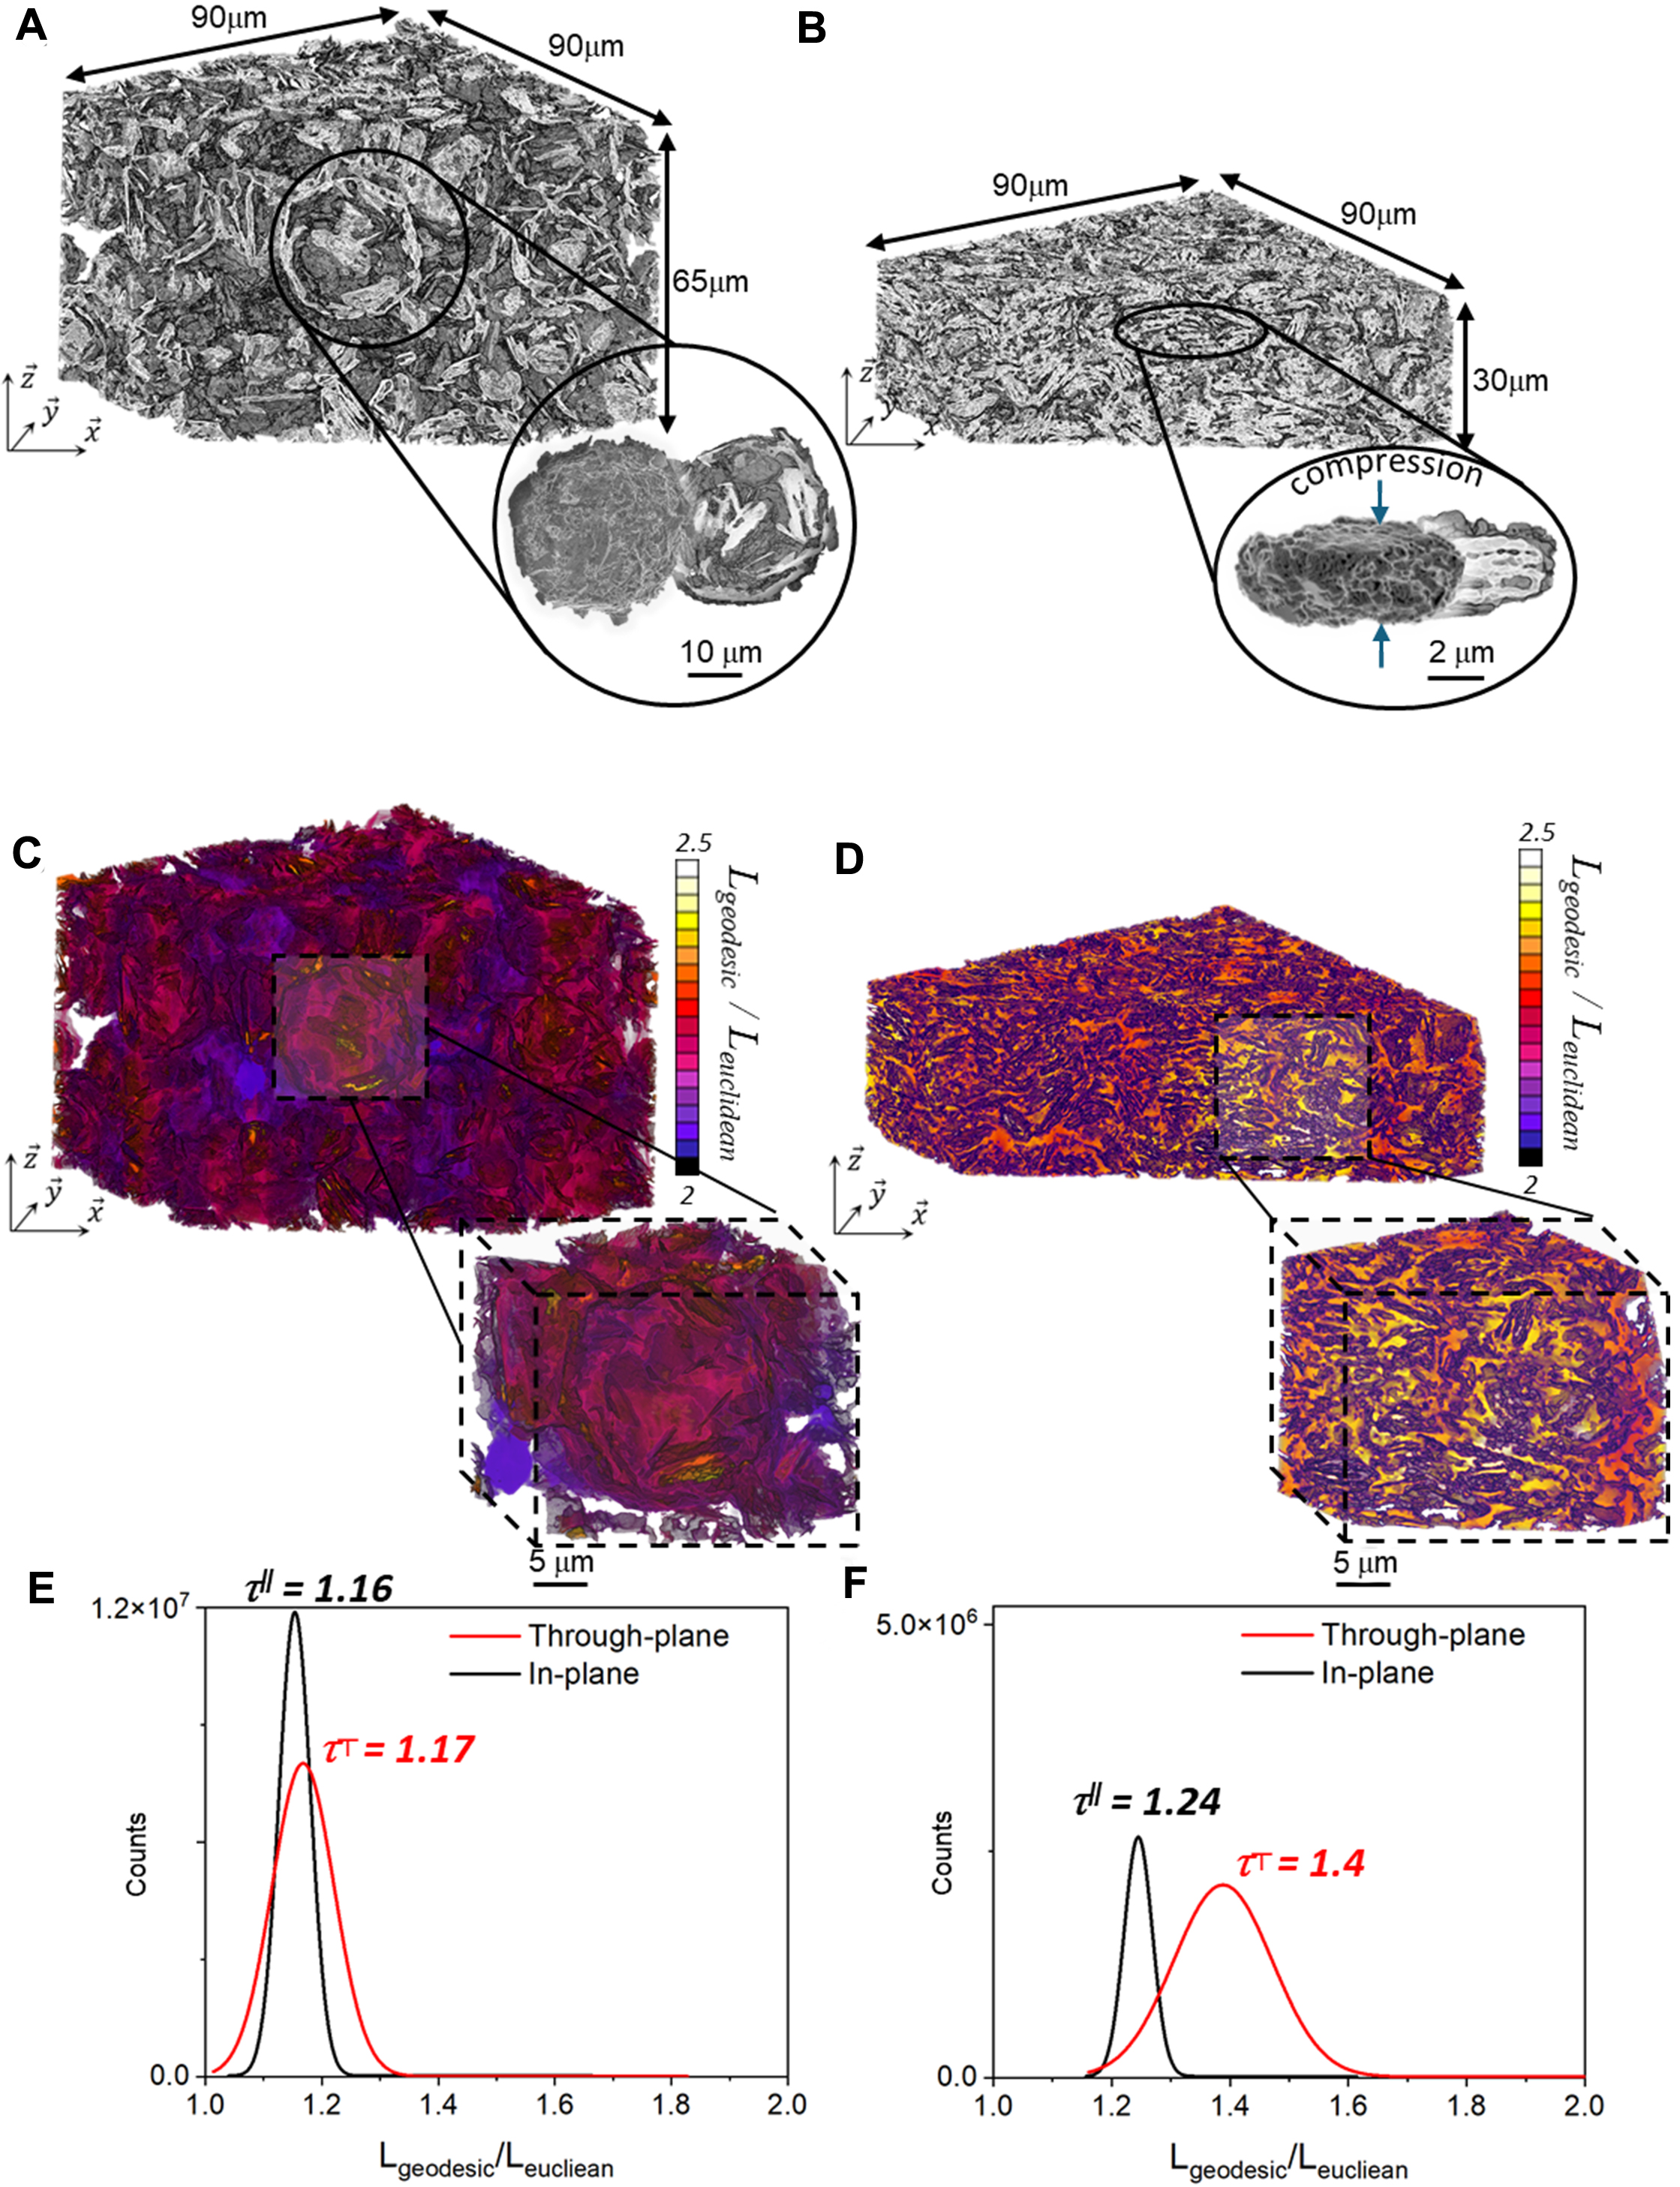
Figure 4. (A and B) 3D representation of the GA-9% nSi-based electrode with a close-up view of an agglomerate, including a cross-section view (A) before and (B) after calendaring. (C and D) Geodesic distance maps for the porosity and corresponding distributions for the electrode (C and E) before and (D and F) after calendaring. 3D: Three-dimensional; GA: graphite agglomerate; nSi: nano-silicon.
Electrochemical performance
Figure 5 and Table 2 compare the cycling performance of the different materials. We first examined the cycling behavior of the spray-dried G-9% nSi composite and compared it with a simple blend of GA and 9% nSi prepared by resonant acoustic mixing (denoted as GA + 9% nSi). As shown in Figure 5A, the GA + 9% nSi electrode displays rapid capacity decay during the first few cycles (cyan curve), whereas the spray-dried G-9% nSi composite (orange curve) maintains much more stable capacity. This behavior highlights the role of spray drying in effectively embedding Si nanoparticles within the graphite agglomerates, thereby helping maintain electrical contact during cycling.
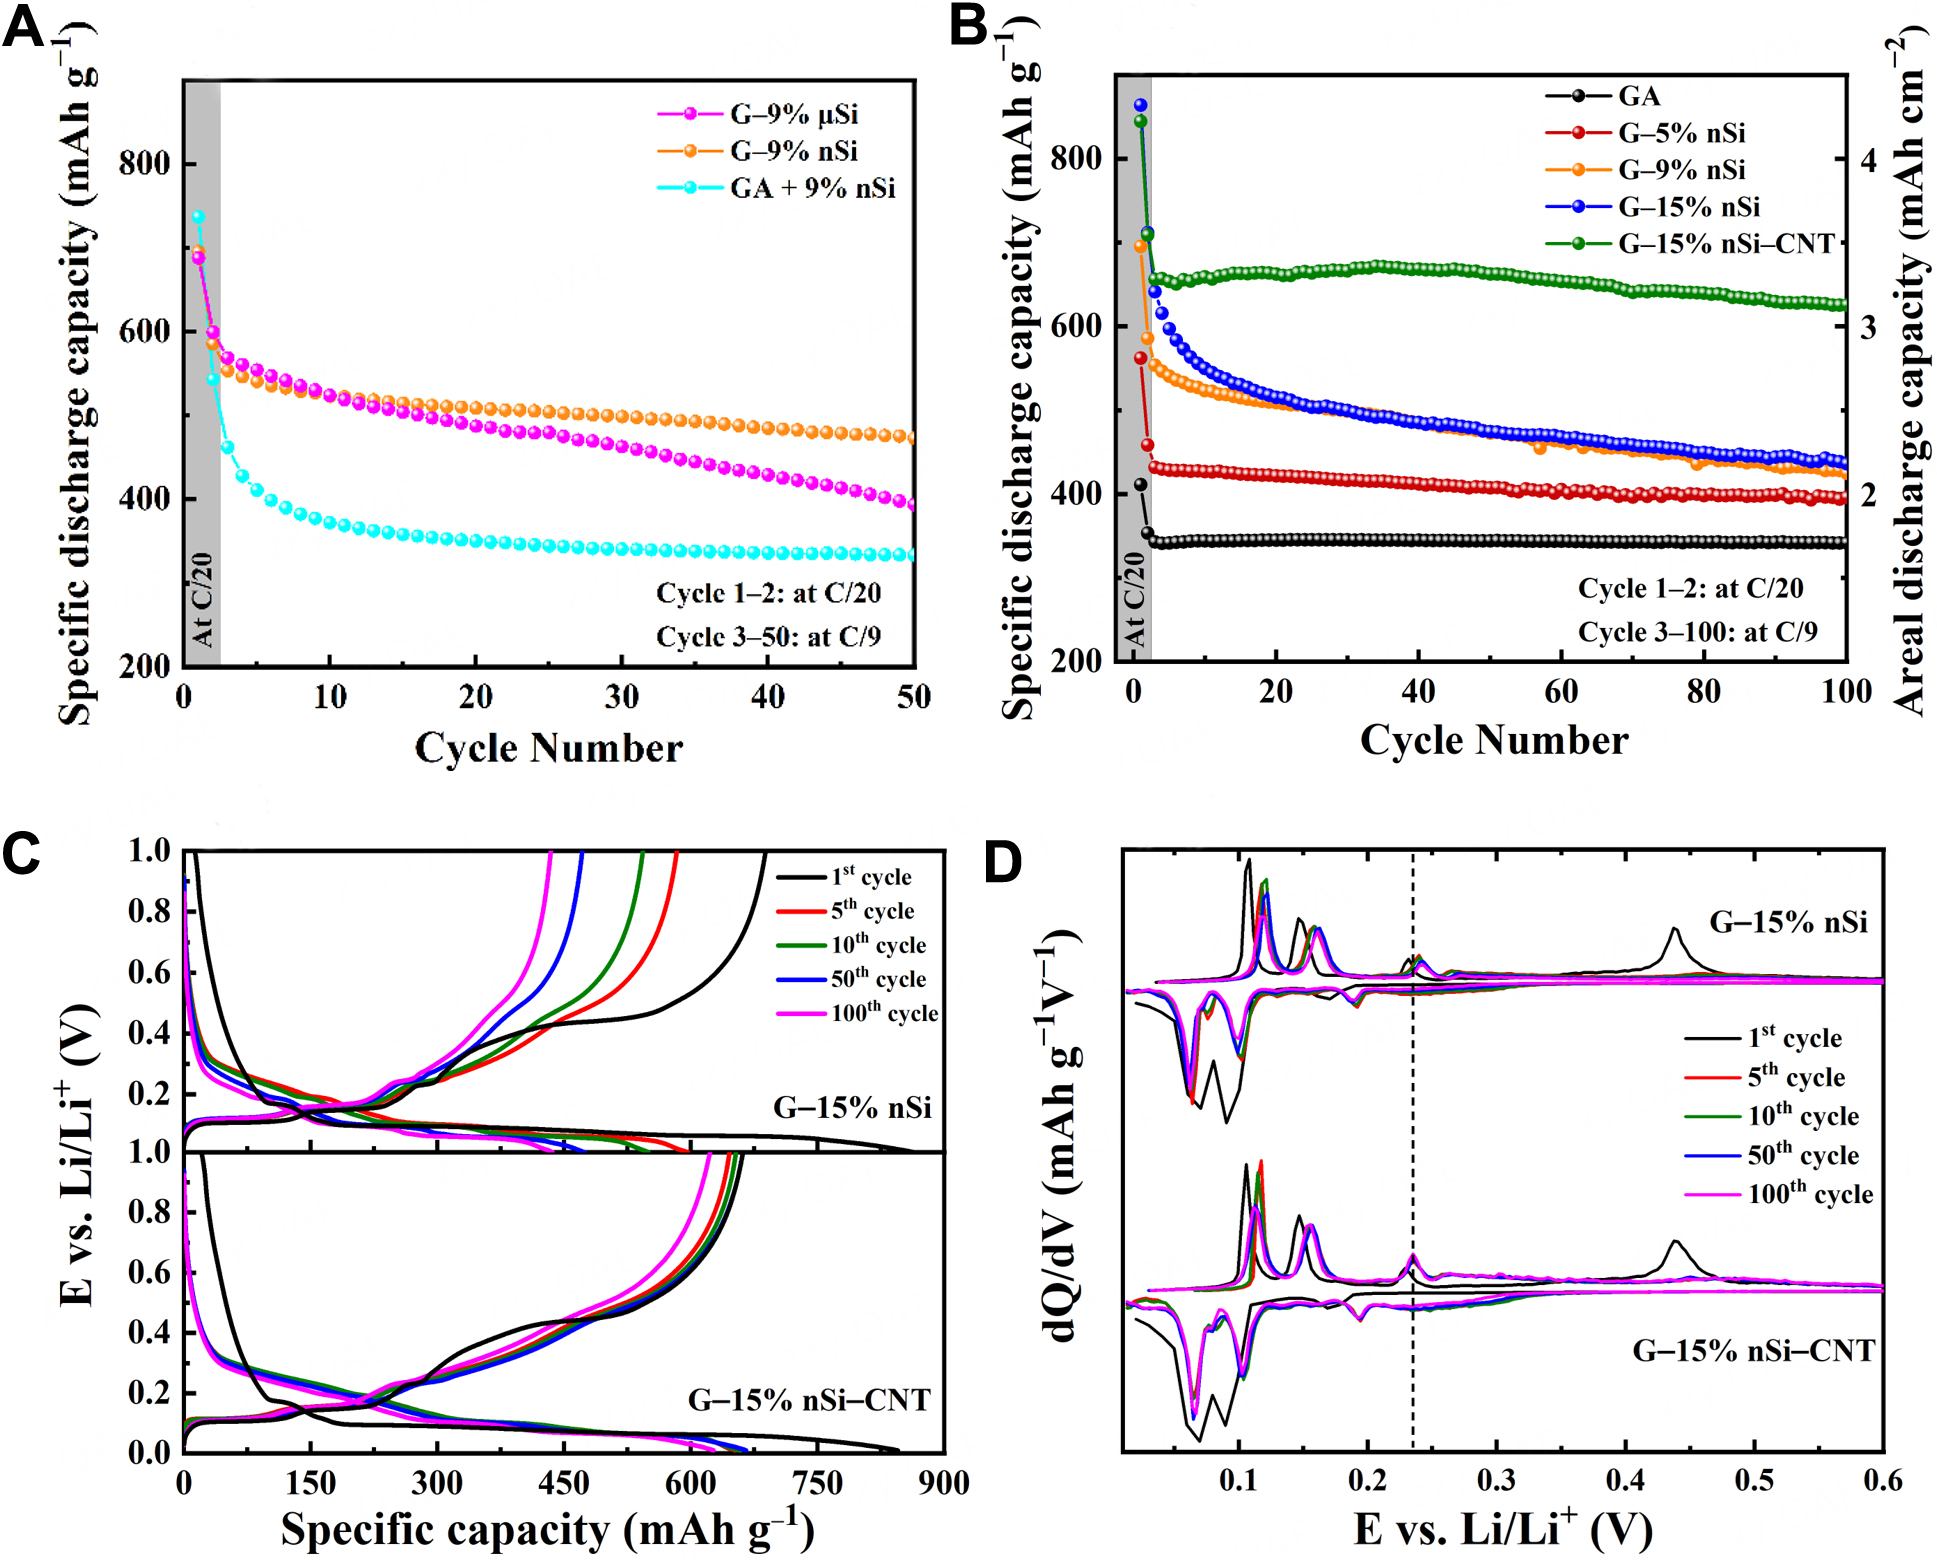
Figure 5. Cycling performance of G-Si composite anodes: (A) Comparison of synthesis methods and the influence of Si particle size; (B) Effect of nano-Si content and CNT integration on electrochemical performance. (C) Charge/discharge curves and (D) Differential capacity curves for G-15% nSi and G-15% nSi-CNT at representative cycles. CNT: Carbon nanotube; nSi: nano-silicon; µSi: micro-silicon; GA: graphite agglomerate.
Comparison of the electrochemical performance of the different anodes (mean values based on triplicate cycling tests)
| Sample | Initial discharge capacity (mAh·g-1) | ICE (%) | 3rd-cycle discharge capacity (mAh·g-1) | Discharge capacity at 50th/100th cycle (mAh·g-1) | Capacity retention relative to the 3rd cycle (50th/100th cycle, %) |
| GA | 420 | 84.5 | 343 | 344/342 | 100/99.7 |
| G-9% µSi | 688 | 84.4 | 568 | 394/- | 69.4/- |
| GA + 9% nSi | 737 | 75.2 | 462 | 333/- | 72.2/- |
| G-5% nSi | 562 | 79.7 | 432 | 407/396 | 94.2/91.7 |
| G-9% nSi | 695 | 80.3 | 554 | 473/425 | 85.4/76.7 |
| G-15% nSi | 864 | 79.7 | 641 | 474/436 | 73.9/68.0 |
| G-15% nSi-CNT | 845 | 78.3 | 656 | 662/625 | 100/95.3 |
The importance of Si particle size in cycling stability is also evident. The spray-dried G-9% nSi electrode exhibits higher stability than the G-9% µSi electrode (orange vs. magenta curve in Figure 5A). This finding is consistent with studies showing that a decrease in Si particle size enhances cycling stability in Si-based electrodes[4,33,34]. Smaller Si particles experience lower internal stress and are therefore less prone to cracking or pulverization[33,34], which helps maintain structural integrity and electrical connectivity over repeated cycling. Additionally, nanoscale silicon can better accommodate volume changes and suppress the propagation of fractures[33,34]. Although the increased surface area of smaller particles promotes additional SEI formation[33,34], this drawback is often outweighed by their superior mechanical resilience and longer-term stability. Moreover, reduced particle size of nSi offers shorter diffusion paths for Li+, enabling more uniform lithiation and faster reaction kinetics compared to larger µSi particles[4].
Afterward, the impact of the amount of nSi (0, 5, 9 and 15 wt%) in the spray-dried agglomerates was evaluated [Figure 5B]. As expected, the initial discharge capacities rise with higher nSi content. Supplementary Figure 2 in Supplementary Materials shows that the initial capacity values closely align with the theoretical values calculated from the Si content in the composite, using the theoretical capacities of graphite (372 mAh·g-1) and Si (3,579 mAh·g-1). This suggests that a large fraction of Si particles in the composites is electrochemically accessible. It should be noted, however, that no extra discharge capacity related to the SEI formation is considered in the calculation. Figure 5B also reveals that the cycling stability decreases as the Si content increases: the 3rd-100th capacity retention decreases from 91.7% for the G-5% nSi electrode to 68.0 % for the G-15% nSi electrode [Table 2]. A higher Si content means higher volume changes and thus higher mechanical stress and degradation in the agglomerates and electrode coating, accentuating the loss of electrical contact upon cycling. This is more evident during the first 20 cycles for the G-9% nSi and G-15% nSi electrodes (orange and blue curves in Figure 5B), suggesting that most of the mechanical degradation occurs in this period. Beyond 20 cycles, the rate of capacity loss (slope of the curve) becomes nearly identical.
To mitigate the capacity decay observed with higher nSi content in spray-dried composites, a promising solution is to incorporate CNTs[8-11,15,20]. CNTs provide additional contact sites for nSi and create a conductive network with the graphite flakes, which helps to improve electrical conductivity. Moreover, the intertwined CNTs within the agglomerates are likely to bolster their mechanical strength, mitigating the effects of Si volume change and reducing the risk of fracturing and electrical disconnection. This approach improves the overall stability of the electrode and helps to sustain higher capacity over extended cycling periods. As depicted in Figure 5B (green curve), incorporating 1 wt% CNTs in G-15% nSi improves capacity retention to 95.3% after 100 cycles (630 mAh·g-1 or 3.15 mAh·cm-2) vs. 68.0% (440 mAh·g-1 or 2.2 mAh·cm-2) for G-15% nSi (green vs. blue curves in Figure 5B).
Supplementary Table 1 in Supplementary Materials summarizes the electrochemical performance of graphite/Si-based composites reported in the previous works[14,15,21,35-42]. Compared with these materials, the G-15% nSi-CNT composites developed in this work exhibit outstanding lithium-storage properties, particularly in terms of achieving high areal capacities that are critical for practical battery applications. Several studies have employed CVD routes to grow CNTs or graphene in situ on Si or graphite surfaces[15,40,41]. The resulting CVD-derived carbon structures construct continuous conductive networks, mechanically reinforce the Si domains, and buffer the large volume changes of Si during cycling, thereby producing composites with appealing cycling stability and rate capability. However, these performance metrics are often obtained using very low electrode mass loadings (1-1.5 mg·cm-2), which lead to limited areal reversible capacities and reduce the relevance of the results for real applications. Similarly, a number of composites synthesized via spray-drying and/or ball-milling approaches have also been evaluated at comparably low mass loadings, leading to similarly low areal capacities[14,35-39]. Li et al. reported Si-based composites exhibiting both strong cycling stability and mass loadings suitable for practical applications; in both cases, the Si-containing materials were blended with commercial graphite to achieve these performance levels[21].
To understand the electrochemical processes underlying long-term cycling behavior, charge/discharge profiles and differential capacity (dQ/dV) curves were plotted for selected cycles. Figure 5C compares the charge/discharge profiles of the G-15% nSi and G-15% nSi-CNT composites at the 1st, 5th, 10th, 50th, and 100th cycles. The G-15% nSi electrode shows faster capacity decay than the G-15% nSi-CNT electrode, consistent with the trends observed in Figure 5B. Both composites exhibit features characteristic of G-Si systems, different from graphite-only electrode[24,43]. During the first lithiation, the voltage drops from the open-circuit potential (~3.0 V) to 0.01 vs. Li/Li+, passing through: (i) a graphite intercalation region between 0.1 and
We can also observe that CNT-integrated composites achieve a stable CE of 99.2% in fewer charge/discharge cycles (7 cycles) compared to CNT-free composite (13 cycles), as shown in Figure 6A. This is highlighted in a different way in Figure 6B, which shows the evolution of the cumulative irreversible capacity over cycling (i.e., the difference between the discharge capacity and the charge capacity, summed cycle after cycle).
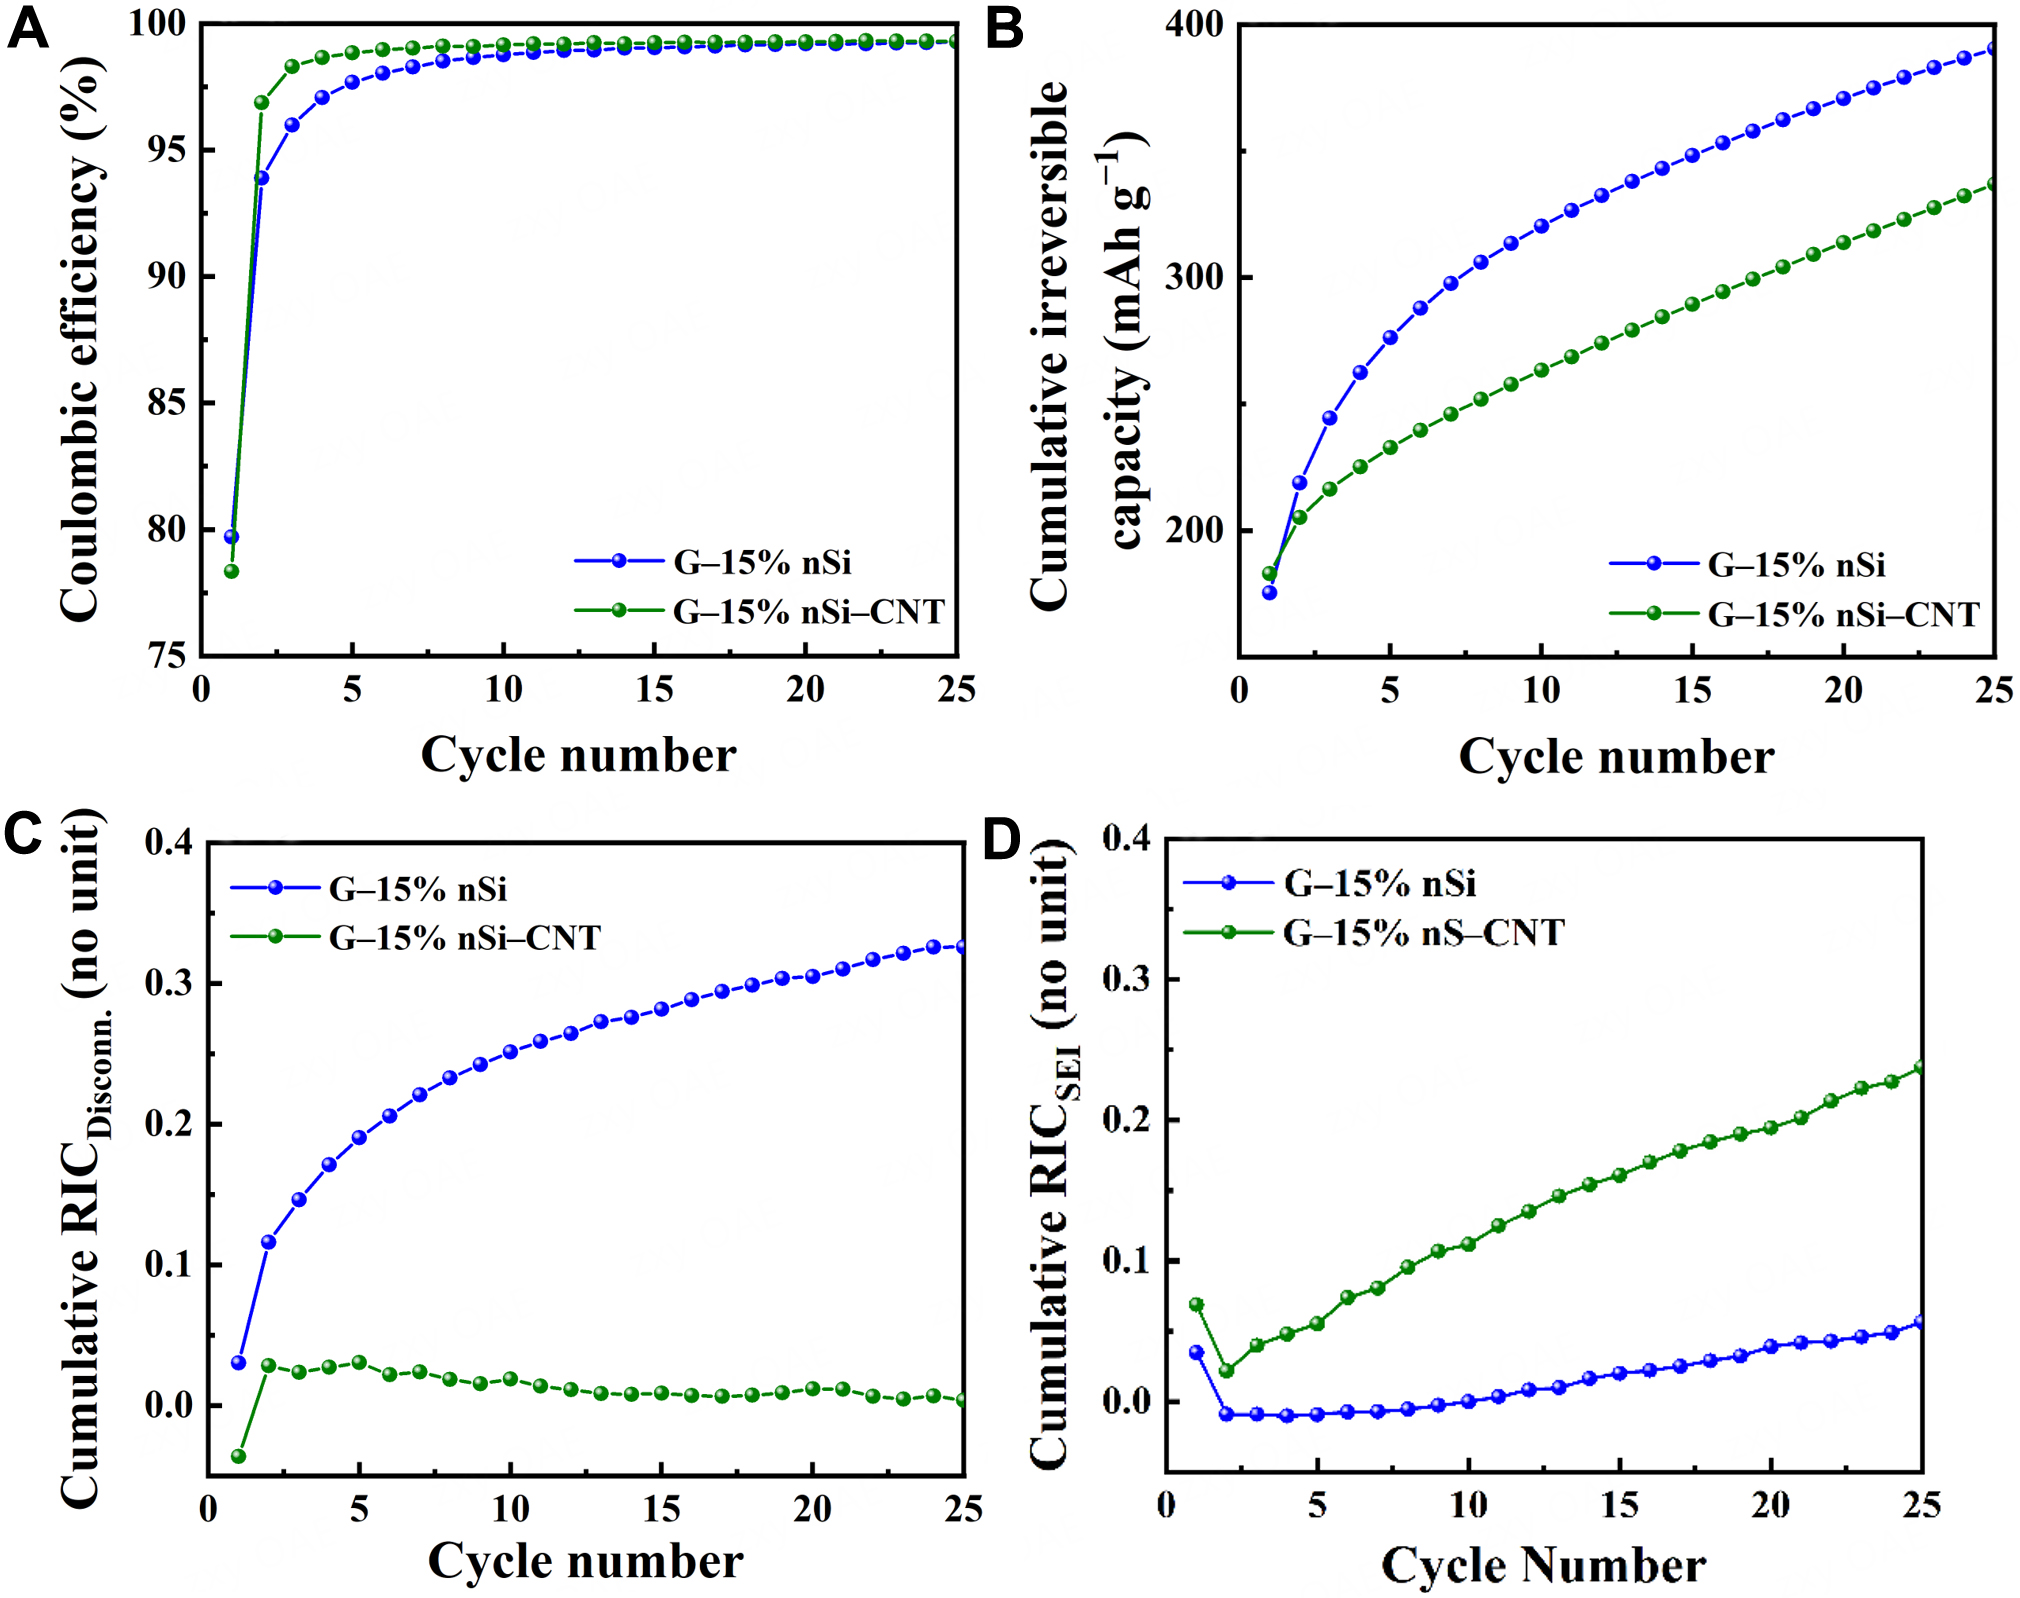
Figure 6. Evolution of coulombic efficiency (A), cumulative irreversible capacity (B), cumulated relative irreversible capacities associated with disconnection (C) and SEI formation (D) during cycling for G-15% nSi and G-15% nSi-CNT. SEI: Solid electrolyte interphase; nSi: nano-silicon; CNT: carbon nanotube.
Capacity fade (or irreversible capacity) of Si-based electrodes primarily results from mechanical or electrical disconnection of the active material and/or irreversible electron consumption during SEI layer formation[47]. As a first approximation, it is assumed that mechanical and electrical disconnections primarily arise from particle contraction in the charge (delithiation) process, whereas capacity loss due to irreversible electron consumption during SEI layer formation/reformation primarily occurs in the discharge (lithiation) step[47]. The relative irreversible capacity (RIC) associated with the disconnection (RICDISCONN.) is thus defined as:
where Cn is the charge capacity at cycle n, and Cn+1 is the charge capacity at cycle n+1. On the other hand, the RIC associated with SEI formation, RICSEI, is calculated as follows:
where Dn+1 is discharge capacity at cycle n + 1. These two irreversible capacities are expressed as a function of the delivered capacity Cn+1 denominator, ensuring independence from the sample-specific capacity fade rate. Figure 6C and D displays the cumulative RICDISCONN. and cumulative RICSEI plots over cycling for G-15% nSi-CNT and G-15% nSi composites. The cumulative RIC represents the sum of RICs from all preceding cycles up to the current cycle. Notably, the cumulative RICDISCONN. of G-15% nSi increases over cycling, whereas it remains consistently low for G-15% nSi-CNT. The increasing RICDISCONN. suggests that mechanical and electrical disconnection is a dominant mechanism of capacity loss in G-15% nSi. Over cycles, the cumulative effect of cracking and debonding progressively reduces the amount of active silicon available for lithium storage, leading to significant capacity fade. However, the presence of CNTs enhances the mechanical and electrical integrity of the composite, effectively mitigating the disconnection of silicon particle from the bulk. In other words, CNTs provide a robust, conductive network that maintains connectivity between silicon particles and the graphite flakes, even during volume changes. From Figure 6D, it could be noticed that the cumulative RICSEI for G-15% nSi-CNT is higher than that for G-15% nSi over cycling. The CNT-integrated composite possesses a higher SSA compared to the CNT-free composite [Table 1]. A higher surface area results in more electrolyte exposure and thus more SEI formation, leading to a relatively higher RICSEI. The higher cycling capacity of G-15% nSi-CNT may also induce greater stress on the SEI layer, thereby affecting its stability. The SEI formation is thus the dominant mechanism of capacity loss in G-15% nSi-CNT. The higher RICSEI reflects the trade-off of incorporating CNTs. CNTs improve mechanical and electrical stability, but they increase SEI-related losses due to greater electrolyte exposure. The latest degradation mechanism associated with electrolyte decomposition could be mitigated thanks to appropriate additive and/or electrolyte tailoring[48].
Figure 7A illustrates the rate capability of G-15% nSi and G-15% nSi-CNT for a C-rate ranging from C/20 to 4C. G-15% nSi-CNT exhibits significantly higher capacities than the CNT-free G-15% nSi composite across all C-rates. Notably, G-15% nSi-CNT shows negligible capacity decay at rates below 1C. At 1C, G-15% nSi-CNT achieves a capacity retention of 97.2%, compared to approximately 62% for G-15% nSi, highlighting its superior rate performance. Additionally, when the C-rate is reduced from 4C back to 0.1C, G-15% nSi-CNT recovers to 93% of its initial capacity, much higher than approximately 65% for G-15% nSi, confirming its excellent electrochemical reversibility.
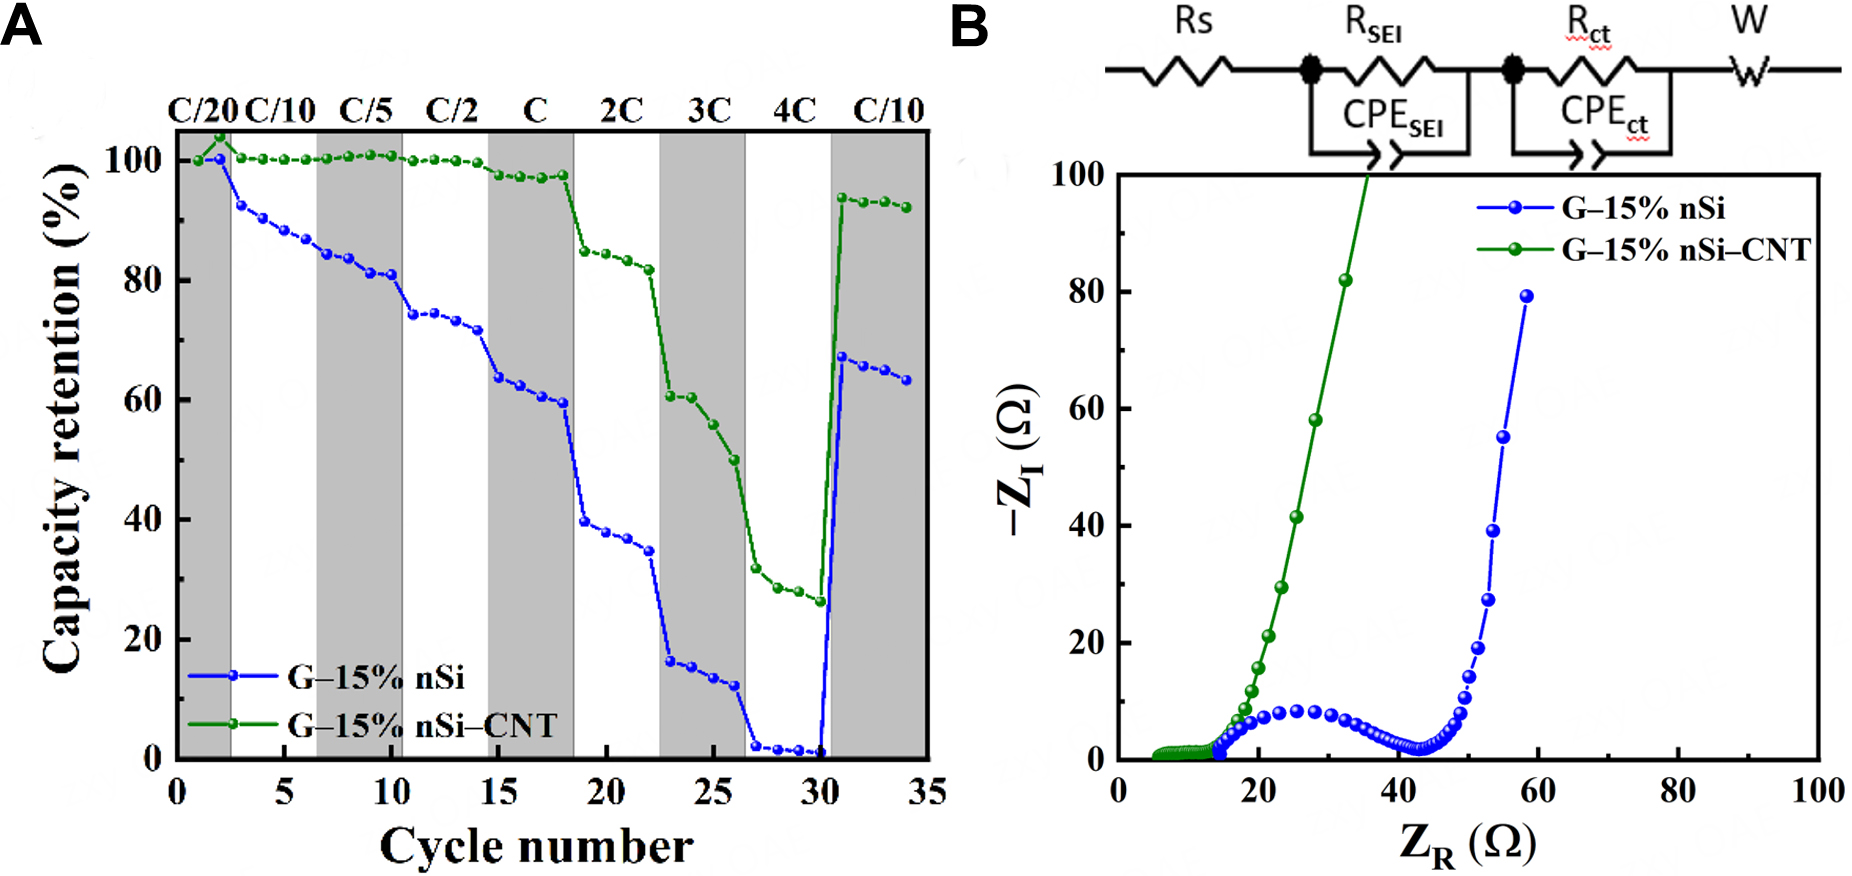
Figure 7. (A) Charge (delithiation) rate performance from C/20 to 4C with a discharge rate fixed at C/10, and (B) Nyquist plots of G-15% nSi and G-15% nSi-CNT electrodes (the inset is the equivalent circuit to fit the curves). nSi: Nano-silicon; CNT: carbon nanotube; Rs: ohmic resistance; RSEI: SEI film resistance; SEI: solid electrolyte interphase; Rct: charge transfer resistance; W: Warburg impedance; CPESEI: constant phase element for SEI; CPECT: constant phase element for charge transfer; ZR: real impedance; -ZI: negative imaginary impedance.
The three-electrode configuration was employed for EIS measurements to ensure accurate determination of the impedance contributions of the composite anodes. In two-electrode cells, the impedance of the lithium counter electrode, whose SEI evolves rapidly upon cycling, can dominate the overall response and obscure the interfacial and charge-transfer resistances of the working electrode. By positioning an additional lithium reference electrode in close proximity to the G-Si composite, the ohmic drop through the electrolyte is minimized and stable potential control is maintained, enabling reliable extraction of resistances associated with the electrolyte/bulk, SEI layer, and charge-transfer processes[30]. Figure 7B presents the Nyquist plots of the two composites in the frequency range of 200 kHz to 0.01 Hz, both exhibiting two depressed semicircles in the high-to-medium frequency range, followed by a sloped line at low frequencies. The inset of Figure 7B illustrates the Randles equivalent circuit used to fit the curves. In this circuit, Rs, which accounts for the bulk resistance of the electrolyte, electrode, and separator, corresponds to the high-frequency intercept on the real axis. RSEI and CPESEI represent the resistance and constant phase element of the SEI layer, respectively. Rct and CPEct denote the resistance and constant phase element associated with the faradaic charge-transfer process, respectively. W represents the Warburg impedance due to the semi-infinite diffusion of Li+ in the composite electrode. EIS fitting reveals that the G-15% nSi-CNT composite exhibits significantly lower resistance values, with an Rs of 5.2 Ω, RSEI of 2.1 Ω, and Rct of 4.7 Ω, compared to the CNT-free composite with Rs of
The superior rate capability and cycling stability of the G-15% nSi-CNT composite can be attributed to the role of CNTs in establishing a continuous conductive and mechanically resilient network within the spray-dried secondary particles. During agglomeration by spray-drying, it is reasonable to expect that CNTs distribute throughout the graphite-Si framework and bridge neighboring graphite fines. This percolating CNT network potentially complements the intrinsically low conductivity of Si and can help maintain electronic connectivity even as Si undergoes volume expansion and contraction during lithiation/delithiation[49-51]. As a result, common failure modes in Si-containing composites, such as mechanical disruption and isolation of active material, may be significantly mitigated. This interpretation is consistent with the electrochemical trends in Figure 7A: the G-15% nSi-CNT composite sustains higher capacities across all rates and shows more complete capacity recovery after the high-rate sequence. The lower Rs, RSEI, and Rct values observed in Figure 7B further support the idea that CNT incorporation improves electronic connectivity and stabilizes interfacial processes[49,50]. Although the present study does not directly image the CNT network, the combined evidence from rate capability, cyclability, and EIS analysis is consistent with CNT-enabled enhancement of both electronic and mechanical robustness in the composite. This also in accordance with previous studies showing that CNTs can form percolating conductive networks within composite materials, improving electron transport and reducing contact resistance between active materials in the carbon matrix[52]. CNTs have also been reported to buffer mechanical strain and maintain electrical connectivity during the large volume changes associated with Si lithiation/delithiation[49-51].
Post-mortem observation of the G-15% nSi and G-15% nSi-CNT electrodes
Figure 8 presents the surface and cross-sectional views of fresh, after 20 cycles and after 100 cycles of G-15% nSi and G-15% nSi-CNT electrodes. As depicted in Figure 8A and D, the fresh electrodes exhibit similar surface textures, with FIB-SEM insets revealing layered graphite structures with nSi particles. After 20 cycles, distinct morphological differences emerge between the two electrodes. The FIB-SEM image of the G-15% nSi electrode (inset of Figure 8B) shows a marked absence of distinct nSi particles between graphite layers, which can be attributed to the electrochemical sintering of nSi[53-56]. Electrochemical sintering in nSi particles within LIB anodes refers to a process where, during repeated lithiation/delithiation cycles, small Si nanoparticles merge or fuse together due to localized electrochemical reactions and mechanical stresses, forming larger agglomerates that degrade electrode performance by reducing surface area, increasing resistance, and promoting cracking[53-56]. In contrast, as shown in inset of Figure 8E, after 20 cycles, the G-15% nSi-CNT composite retains its layered structure with nano-structured Si particles interspersed between graphite layers, though volume expansion is evident. The increase of the nSi particles packing in the formulation without CNTs is estimated, with -20% porosity reduction after 20 cycles in some dense nSi regions of interest (yellow dashed circled areas in Figure 8), while < 1% is reported for the G-Si-CNT electrode. These observations suggest that incorporating CNTs plays a significant role in mitigation of electrochemical sintering effect. It is also possible that nSi particles in the CNT-free formulation are not fully delithiated because of the disconnections and therefore we observe denser areas in between the particles. After 100 cycles, large aggregates and surface cracks are observed on the G-15% nSi electrode [Figure 8C], whereas G-15% nSi-CNT electrode [Figure 8F] shows smaller, more uniform aggregates with no cracks. Only micrometric grooves are present on its surface, corresponding to the imprint of the fibrous separator, caused by repeated volume expansion of the electrode during cycling.
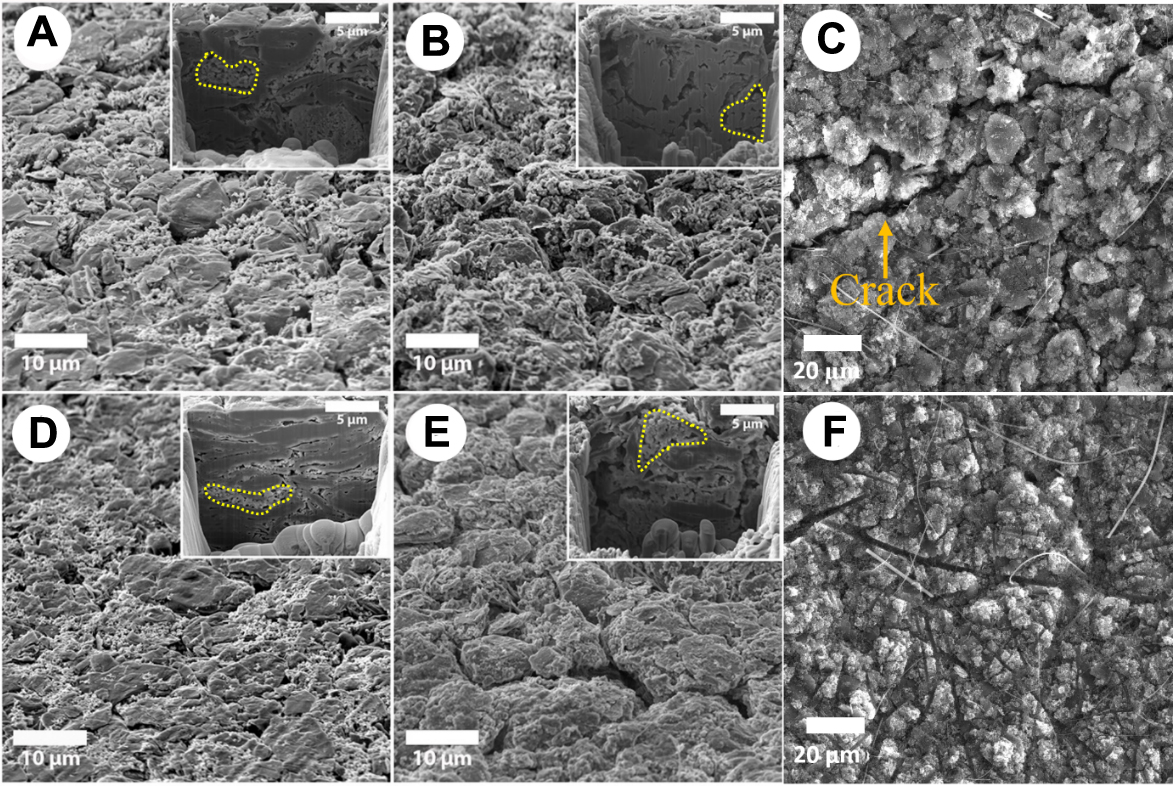
Figure 8. SEM images of (A-C) G-15% nSi electrode at (A) the fresh state, (B) after 20 cycles, (C) after 100 cycles, and of (D-F) G-15% nSi-CNT electrode (D) at the fresh state, (E) after 20 cycles, and (F) after 100 cycles. Insets are FIB-SEM cross-section images of their corresponding electrodes. Yellow dashed circled areas correspond to nSi regions of interest. SEM: Scanning electron microscope; nSi: nano-silicon; CNT: carbon nanotube; FIB: focused ion beam.
CONCLUSION
This study demonstrates the effectiveness of a scalable spray-drying method for synthesizing graphite/silicon/carbon nanotube (G-Si-CNT) composites tailored for LIB anodes. The spray-drying process ensures uniform particle morphology and strong adhesion between components. By integrating low-cost graphite fines, nSi, and a low CNT loading, the resulting composites exhibit superior electrochemical performance, including high-capacity retention and excellent rate capability. Although CNTs increase SEI-related losses due to higher surface area, their benefits in maintaining structural integrity and conductivity outweigh this drawback. Importantly, the use of low-cost by-products from natural graphite spheroidization and low CNT content offers a cost-effective and sustainable pathway for large-scale production of high-performance anodes. Cycling tests at the prototyping full-cell level are planned in future work to validate the material’s performance in practical battery systems.
DECLARATION
Acknowledgements
The authors thank Brassard, M., Oliaii, E., and Reddy, V. from Nouveau Monde Graphite Inc., and Laforgue, A. from the National Research Council Canada, for their critical review of this work. We also thank Soucy, P. for the FIB-SEM analyses performed at the Infrastructure for Advanced Imaging, a facility at INRS-EMT supported by the Canada Foundation for Innovation. Zasukhin, S. from OCSiAl Group is acknowledged for providing the TUBALLTM material. The ESRF and the ID16B beamline are acknowledged for beamtime provision (MA5312, DOI: 10.15151/ESRF-ES-705434511).
Authors’ contributions
Writing - original draft: Wang, Y.; Abrego-Martinez, J. C.; Vanpeene, V.
Methodology: Wang, Y.; Abrego-Martinez, J. C.; Vanpeene, V.; Quéméré, S.
Investigation: Wang, Y.; Abrego-Martinez, J. C.; Vanpeene, V.
Formal analysis: Wang, Y.; Abrego-Martinez, J. C.; Vanpeene, V.
Writing - review and editing: Roué, L.
Supervision: Roué, L.
Funding acquisition: Roué, L.
Conceptualization: Roué, L.
Availability of data and materials
The data that support the findings of this study are available from the corresponding author upon reasonable request.
Financial support and sponsorship
This work was supported by the Natural Sciences and Engineering Research Council (NSERC) of Canada (grant ALLRP 552729-20) and Nouveau Monde Graphite Inc.
Conflicts of interest
Abrego-Martinez, J. C. is affiliated with Nouveau Monde Graphite Inc. The other authors have declared that they have no conflicts of interest.
Ethical approval and consent to participate
Not applicable.
Consent for publication
Not applicable.
Copyright
© The Author(s) 2026.
Supplementary Materials
REFERENCES
1. Li, J.; Fleetwood, J.; Hawley, W. B.; Kays, W. From materials to cell: state-of-the-art and prospective technologies for lithium-ion battery electrode processing. Chem. Rev. 2022, 122, 903-56.
2. Shen, X.; Zhang, X.; Ding, F.; et al. Advanced electrode materials in lithium batteries: retrospect and prospect. Energy. Mater. Adv. 2021, 2021, 1205324.
3. Ge, M.; Cao, C.; Biesold, G. M.; et al. Recent advances in silicon-based electrodes: from fundamental research toward practical applications. Adv. Mater. 2021, 33, e2004577.
4. Wang, L.; Yu, J.; Li, S.; et al. Recent advances in interface engineering of silicon anodes for enhanced lithium-ion battery performance. Energy. Storage. Mater. 2024, 66, 103243.
5. Sun, L.; Liu, Y.; Wang, L.; Jin, Z. Advances and future prospects of micro-silicon anodes for high-energy-density lithium-ion batteries: a comprehensive review. Adv. Funct. Mater. 2024, 34, 2403032.
6. Kim, N.; Kim, Y.; Sung, J.; Cho, J. Issues impeding the commercialization of laboratory innovations for energy-dense Si-containing lithium-ion batteries. Nat. Energy. 2023, 8, 921-33.
7. Jin, B.; Liao, L.; Shen, X.; et al. Advancement in research on silicon/carbon composite anode materials for lithium-ion batteries. Metals 2025, 15, 386.
8. He, Z.; Zhang, C.; Zhu, Z.; Yu, Y.; Zheng, C.; Wei, F. Advances in carbon nanotubes and carbon coatings as conductive networks in silicon-based anodes. Adv. Funct. Mater. 2024, 34, 2408285.
9. Park, B. H.; Jeong, J. H.; Lee, G.; Kim, Y.; Roh, K. C.; Kim, K. Highly conductive carbon nanotube micro-spherical network for high-rate silicon anode. J. Power. Sources. 2018, 394, 94-101.
10. Dressler, R. A.; Dahn, J. R. Optimization of Si-containing and SiO based anodes with single-walled carbon nanotubes for high energy density applications. J. Electrochem. Soc. 2024, 171, 030520.
11. Zhang, H.; Zhang, X.; Jin, H.; et al. A robust hierarchical 3D Si/CNTs composite with void and carbon shell as Li-ion battery anodes. Chem. Eng. J. 2019, 360, 974-81.
12. Kim, K.; Moon, D.; Jo, M.; Ahn, H. Carbon nanotube-interlocked Si/CNF self-supporting electrode using continuable spraying architecture system for flexible lithium-ion batteries. Appl. Surf. Sci. 2024, 656, 159663.
13. Wang, H.; Nie, G.; Wang, Z.; et al. Carbon nanofibers with uniformly embedded silicon nanoparticles as self-standing anode for high-performance lithium-ion battery. Colloids. Surf. A-Physicochem. Eng. Asp. 2023, 671, 131653.
14. Hong, J.; Zhang, J.; Li, X.; Guo, Y.; Zhou, X.; Liu, Z. Graphene-wrapped composites of si nanoparticles, carbon nanofibers, and pyrolytic carbon as anode materials for lithium-ion batteries. ACS. Appl. Nano. Mater. 2023, 6, 10138-47.
15. Xu, J.; Yin, Q.; Li, X.; et al. Spheres of graphene and carbon nanotubes embedding silicon as mechanically resilient anodes for lithium-ion batteries. Nano. Lett. 2022, 22, 3054-61.
16. Li, Y.; Yan, K.; Lee, H.; Lu, Z.; Liu, N.; Cui, Y. Growth of conformal graphene cages on micrometre-sized silicon particles as stable battery anodes. Nat. Energy. 2016, 1, 15029.
17. Xu, Q.; Sun, J.; Li, J.; Yin, Y.; Guo, Y. Scalable synthesis of spherical Si/C granules with 3D conducting networks as ultrahigh loading anodes in lithium-ion batteries. Energy. Storage. Mater. 2018, 12, 54-60.
18. Chen, H.; Hou, X.; Chen, F.; et al. Milled flake graphite/plasma nano-silicon@carbon composite with void sandwich structure for high performance as lithium ion battery anode at high temperature. Carbon 2018, 130, 433-40.
19. Lee, D.; Kondo, A.; Lee, S.; et al. Controlled swelling behavior and stable cycling of silicon/graphite granular composite for high energy density in lithium ion batteries. J. Power. Sources. 2020, 457, 228021.
20. An, W.; Xiang, B.; Fu, J.; et al. Three-dimensional carbon-coating silicon nanoparticles welded on carbon nanotubes composites for high-stability lithium-ion battery anodes. Appl. Surf. Sci. 2019, 479, 896-902.
21. Li, P.; Hwang, J. Y.; Sun, Y. K. Nano/microstructured silicon-graphite composite anode for high-energy-density Li-ion battery. ACS. Nano. 2019, 13, 2624-33.
22. Xia, H.; Mu, X.; Zhou, J.; et al. Realization of high-capacity coulombic efficiency in sodium alginate/carbon nanotube double network coated Si-anode for lithium-ion batteries. Sust. Mater. Tech. 2024, 40, e00940.
23. Chae, S.; Choi, S. H.; Kim, N.; Sung, J.; Cho, J. Integration of graphite and silicon anodes for the commercialization of high-energy lithium-ion batteries. Angew. Chem. Int. Ed. Engl. 2020, 59, 110-35.
24. Abrego-martinez, J. C.; Wang, Y.; Vanpeene, V.; Roué, L. From waste graphite fines to revalorized anode material for Li-ion batteries. Carbon 2023, 209, 118004.
25. Martínez-Criado, G.; Villanova, J.; Tucoulou, R.; et al. ID16B: a hard X-ray nanoprobe beamline at the ESRF for nano-analysis. J. Synchrotron. Radiat. 2016, 23, 344-52.
26. Berg, S.; Kutra, D.; Kroeger, T.; et al. ilastik: interactive machine learning for (bio)image analysis. Nat. Methods. 2019, 16, 1226-32.
27. Schindelin, J.; Arganda-Carreras, I.; Frise, E.; et al. Fiji: an open-source platform for biological-image analysis. Nat. Methods. 2012, 9, 676-82.
28. Tranchot, A.; Idrissi, H.; Thivel, P. X.; Roué, L. Impact of the slurry pH on the expansion/contraction behavior of silicon/carbon/carboxymethylcellulose electrodes for Li-ion batteries. J. Electrochem. Soc. 2016, 163, A1020-6.
29. Liu, X. H.; Zhong, L.; Huang, S.; Mao, S. X.; Zhu, T.; Huang, J. Y. Size-dependent fracture of silicon nanoparticles during lithiation. ACS. Nano. 2012, 6, 1522-31.
30. Raccichini, R.; Amores, M.; Hinds, G. Critical review of the use of reference electrodes in li-ion batteries: a diagnostic perspective, batteries. Batteries 2019, 5, 12.
31. Zhang, W.; Fang, L.; Yue, M.; Yu, Z. Improved electrochemical performance of modified natural graphite anode for lithium secondary batteries. J. Power. Sources. 2007, 174, 766-9.
32. Lin, Z.; Liu, T.; Ai, X.; Liang, C. Aligning academia and industry for unified battery performance metrics. Nat. Commun. 2018, 9, 5262.
33. Müller, J.; Michalowski, P.; Kwade, A. Impact of silicon content and particle size in lithium-ion battery anodes on particulate properties and electrochemical performance. Batteries 2023, 9, 377.
34. Wu, F.; Dong, Y.; Su, Y.; et al. Benchmarking the effect of particle size on silicon anode materials for lithium-ion batteries. Small 2023, 19, e2301301.
35. Zhang, Z.; Sun, S.; Zhang, W.; et al. Internally inflated core-buffer-shell structural Si/EG/C composites as high-performance anodes for lithium-ion batteries. Sci. China. Mater. 2022, 65, 2949-57.
36. Shih, J.; Chen, Y.; James Li, Y.; et al. Suppressed volume change of a spray-dried 3D spherical-like Si/graphite composite anode for high-rate and long-term lithium-ion batteries. ACS. Sustainable. Chem. Eng. 2022, 10, 12706-20.
37. Li, M.; Hou, X.; Sha, Y.; et al. Facile spray-drying/pyrolysis synthesis of core–shell structure graphite/silicon-porous carbon composite as a superior anode for Li-ion batteries. J. Power. Sources. 2014, 248, 721-8.
38. Wu, H.; Zheng, L.; Du, N.; et al. Constructing densely compacted graphite/Si/SiO2 ternary composite anodes for high-performance Li-ion batteries. ACS. Appl. Mater. Interfaces. 2021, 13, 22323-31.
39. Luo, H.; Wang, Q.; Wang, Y.; et al. Nano-silicon embedded in MOFs-derived nitrogen-doped carbon/cobalt/carbon nanotubes hybrid composite for enhanced lithium ion storage. Appl. Surf. Sci. 2020, 529, 147134.
40. Hao, Y.; Yang, X.; Gao, Y.; et al. High-toughness design of micron-sized silicon/carbon composite as practical anode for lithium-ion batteries. Chem. Eng. J. 2025, 515, 163258.
41. Jin, D.; Yang, X.; Ou, Y.; et al. Thermal pyrolysis of Si@ZIF-67 into Si@N-doped CNTs towards highly stable lithium storage. Sci. Bull. 2020, 65, 452-9.
42. Meng, K.; Guo, H.; Wang, Z.; et al. Self-assembly of porous-graphite/silicon/carbon composites for lithium-ion batteries. Powder. Technol. 2014, 254, 403-6.
43. Pham, T. K.; Snook, G. A.; Glass, D.; Ellis, A. V. Lithium-ion diffusion behaviour in silicon nanoparticle/graphite blended anodes. J. Power. Sources. 2025, 638, 236623.
44. Olson, J. Z.; López, C. M.; Dickinson, E. J. F. Differential analysis of galvanostatic cycle data from li-ion batteries: interpretative insights and graphical heuristics. Chem. Mater. 2023, 35, 1487-513.
45. Nguyen, Q. A.; Haridas, A. K.; Terlier, T.; Biswal, S. L. Prelithiation effects in enhancing silicon-based anodes for full-cell lithium-ion batteries using stabilized lithium metal particles. ACS. Appl. Energy. Mater. 2023, 6, 5567-79.
46. Karkar, Z.; Guyomard, D.; Roué, L.; Lestriez, B. A comparative study of polyacrylic acid (PAA) and carboxymethyl cellulose (CMC) binders for Si-based electrodes. Electrochim. Acta. 2017, 258, 453-66.
47. Karkar, Z.; Mazouzi, D.; Hernandez, C. R.; Guyomard, D.; Roué, L.; Lestriez, B. Threshold-like dependence of silicon-based electrode performance on active mass loading and nature of carbon conductive additive. Electrochim. Acta. 2016, 215, 276-88.
48. Cao, Z.; Zheng, X.; Qu, Q.; Huang, Y.; Zheng, H. Electrolyte design enabling a high-safety and high-performance Si anode with a tailored electrode-electrolyte interphase. Adv. Mater. 2021, 33, e2103178.
49. Wang, H.; Chao, Y.; Li, J.; et al. What is the real origin of single-walled carbon nanotubes for the performance enhancement of Si-based anodes? J. Am. Chem. Soc. 2024, 146, 17041-53.
50. Li, H.; Yao, B.; Li, M.; et al. Three-dimensional carbon nanotubes buffering interfacial stress of the silicon/carbon anodes for long-cycle lithium storage. ACS. Appl. Mater. Interfaces. 2024, 16, 53665-74.
51. Kawabe, N.; Nakata, Y.; Kashiki, S.; et al. Low-elasticity SW-/MW-CNT hybrid binder for enhanced cycling stability in SiOx-based lithium-ion battery anodes. ACS. Appl. Energy. Mater. 2025, 8, 10717-28.
52. Wang, Y.; Abrego-martinez, J. C.; Barry, A. Y.; Quéméré, S.; Roué, L. Revalorization of graphite fines via carbon nanotube integration for sustainable fast-charging Li-ion battery anodes. J. Power. Sources. 2025, 659, 238445.
53. Chae, S.; Xu, Y.; Yi, R.; et al. A micrometer-sized silicon/carbon composite anode synthesized by impregnation of petroleum pitch in nanoporous silicon. Adv. Mater. 2021, 33, e2103095.
54. Zhang, D.; Lu, J.; Pei, C.; Ni, S. Electrochemical activation, sintering, and reconstruction in energy-storage technologies: origin, development, and prospects. Adv. Energy. Mater. 2022, 12, 2103689.
55. Hovington, P.; Dontigny, M.; Guerfi, A.; et al. In situ scanning electron microscope study and microstructural evolution of nano silicon anode for high energy Li-ion batteries. J. Power. Sources. 2014, 248, 457-64.
Cite This Article
How to Cite
Download Citation
Export Citation File:
Type of Import
Tips on Downloading Citation
Citation Manager File Format
Type of Import
Direct Import: When the Direct Import option is selected (the default state), a dialogue box will give you the option to Save or Open the downloaded citation data. Choosing Open will either launch your citation manager or give you a choice of applications with which to use the metadata. The Save option saves the file locally for later use.
Indirect Import: When the Indirect Import option is selected, the metadata is displayed and may be copied and pasted as needed.
About This Article
Copyright

Data & Comments
Data
0


Comments
Comments must be written in English. Spam, offensive content, impersonation, and private information will not be permitted. If any comment is reported and identified as inappropriate content by OAE staff, the comment will be removed without notice. If you have any queries or need any help, please contact us at support@oaepublish.com.