

fig3
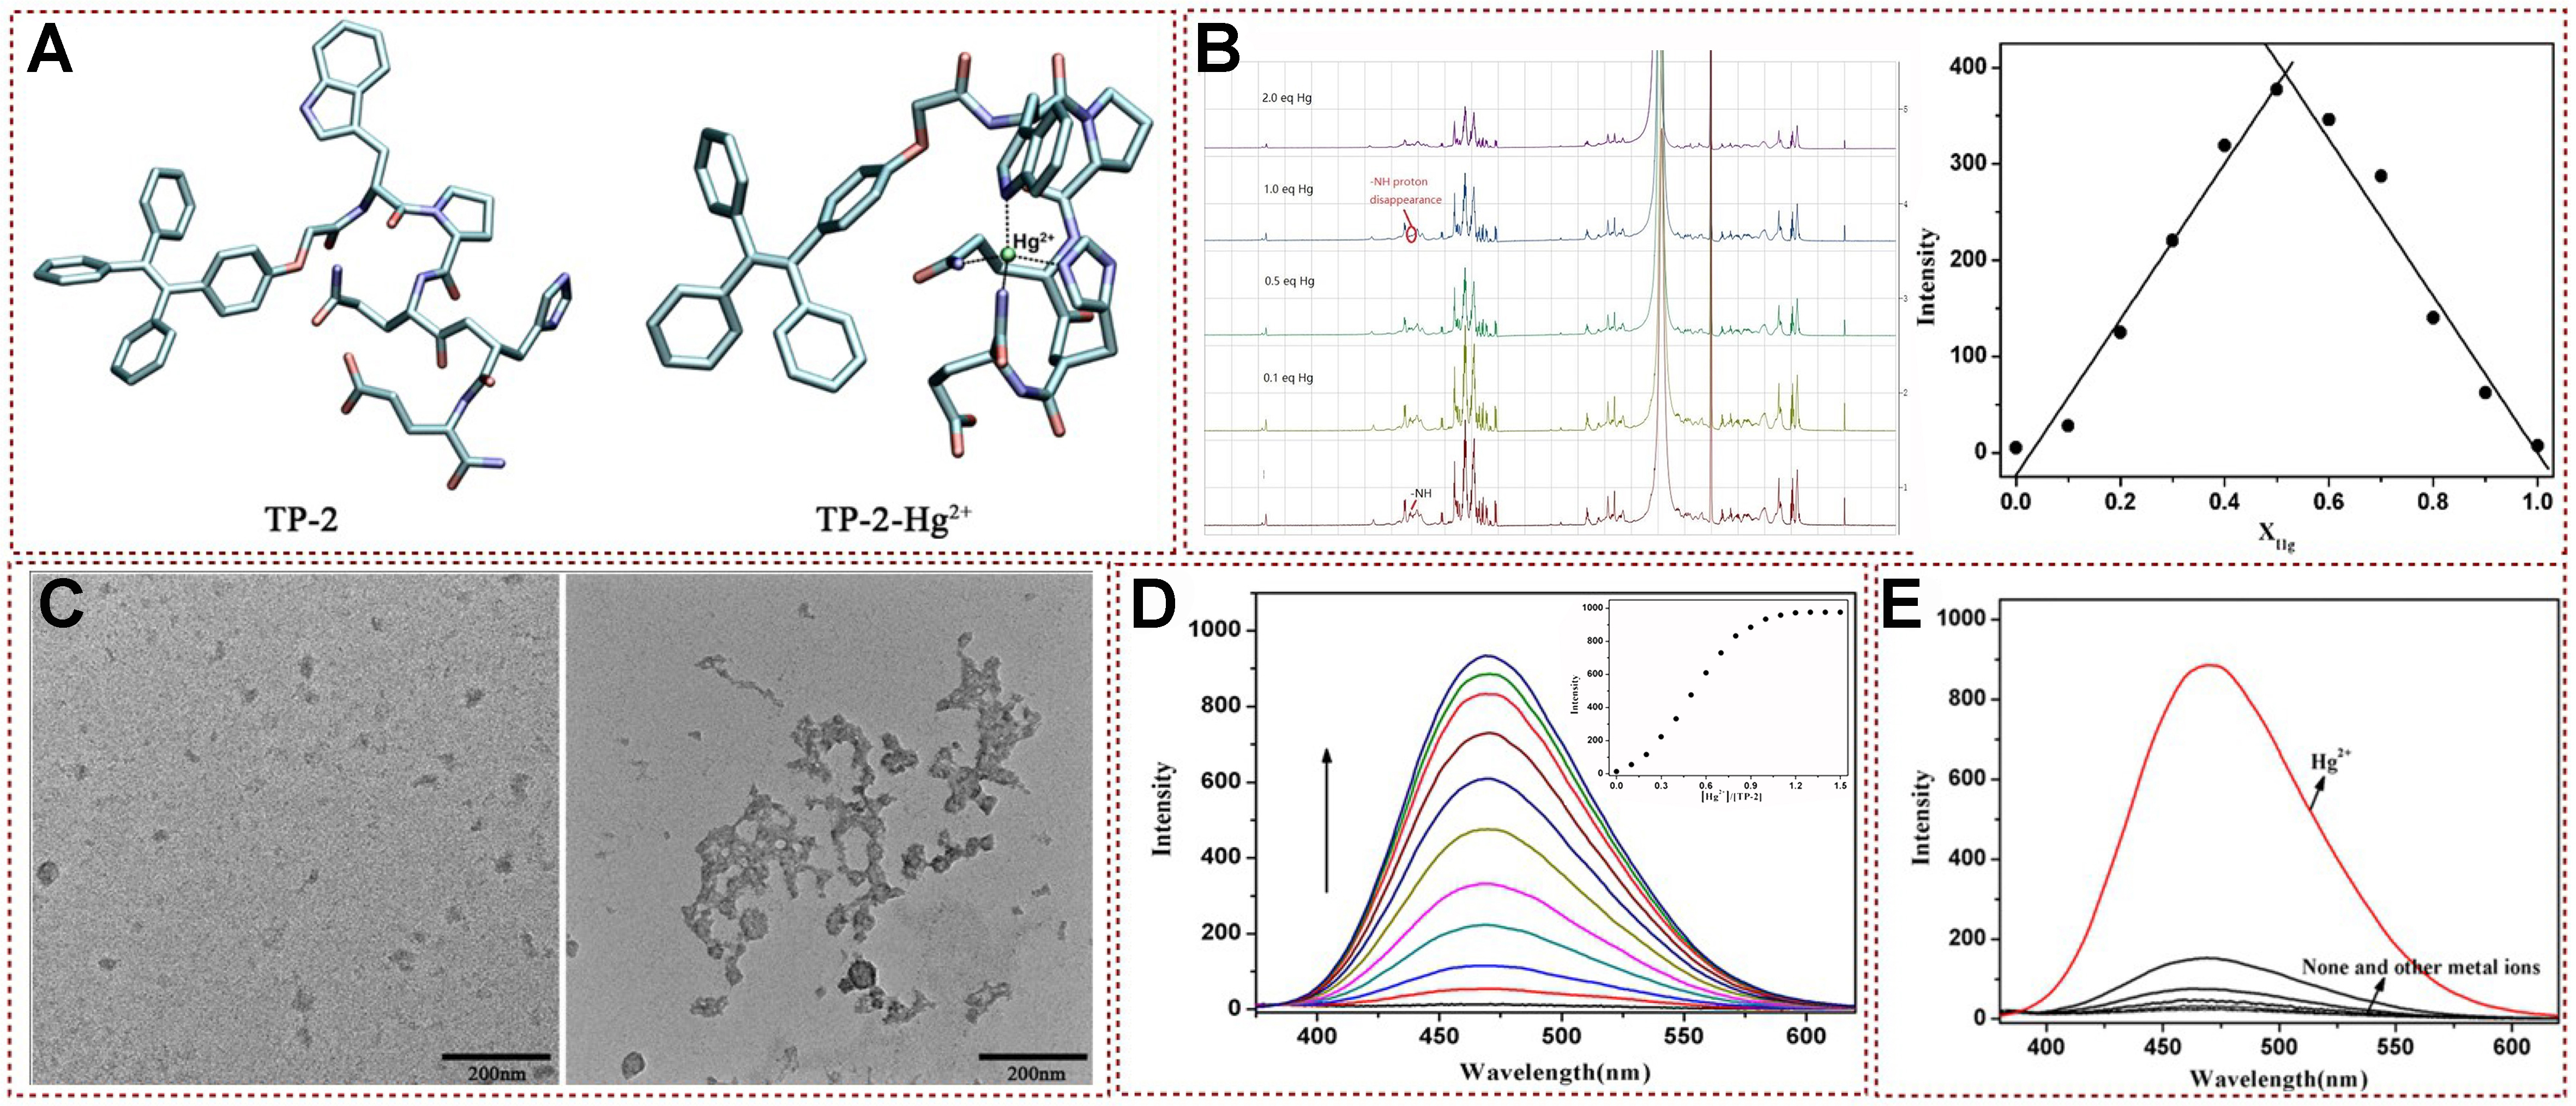
Figure 3. (A) Molecular simulation diagram; (b)The 1H NMR titration experiment of TP-2 with different concentrations of Hg2+ in DMSO-d6 (left) and Job’s plot for determining stoichiometry of TP-2 with Hg2+ in buffer system (right); (C) TEM image of TP-2 in the absence and presence of Hg2+; (D) Fluorescence emission spectrum analysis; (E) Specific detection and recognition experimental results[49]. Copyright 2021, Royal Society of Chemistry. NMR: Nuclear magnetic resonance; TEM: transmission electron microscopy.


