


Understanding the drivers of regional greenhouse gas emissions: a case study of Tatarstan
 0
0 
Abstract
Regional disparities in greenhouse gas (GHG) emissions are substantial across large and economically diverse territories in Russia, making subnational assessments important for the implementation of national climate policy. As a major industrial and energy-producing region in the Volga Federal District, the Republic of Tatarstan provides a relevant case for examining emission dynamics under sustained economic growth. This study investigates the trends and driving forces of GHG emissions generated from fuel combustion in Tatarstan over the period 2005-2022 by applying the logarithmic mean Divisia index (LMDI) decomposition method in both the temporal and sectoral dimensions. The results show that total GHG emissions from fuel combustion increased from 29.56 Mt in 2005 to 36.07 Mt in 2022, representing an overall growth of 22%. The results of the decomposition analysis identify economic activity as the dominant driver of emission growth, contributing to a cumulative increase of 16.50 Mt. In contrast, improvements in energy intensity served as the primary mitigating factor, offsetting emissions by 10.17 Mt. Overall, these findings confirm that economic activity remained the dominant driver of GHG emission growth in the Republic of Tatarstan throughout the entire study period, while improvements in energy intensity functioned as the primary offsetting factor. These conclusions underscore the importance of complementing existing conventional mitigation measures with additional structural and technological solutions aimed at further reducing the carbon intensity of the economy while maintaining long-term economic growth, and they provide analytical support for developing targeted, region-specific climate strategies in highly industrialized regions of Russia.
Keywords
INTRODUCTION
Global atmospheric concentrations of greenhouse gases (GHGs) continue to increase, contributing to climate change and associated phenomena, such as rising surface temperatures, ocean acidification, altered precipitation, melting ice, and positive climate feedbacks[1-5]. A primary consequence of this trend is global warming, which drives a wide range of regional impacts, including the thawing of permafrost in high-latitude regions, shifts in precipitation patterns, and an increased frequency of extreme weather events[6-9]. Notably, the radiative forcing effects of long-lived GHGs have increased by 51.5% between 1990 and 2023[10].
Growing concerns over climate change have intensified academic focus on reducing CO2 emissions. Existing literature primarily examines global, national, and regional emission trends, mitigation pathways, and socio-economic drivers[11-16]. Studies consistently show that economic growth, energy intensity, urbanization, and fossil fuel dependence remain the primary drivers, although their effects exhibit considerable spatial and contextual heterogeneity. For instance, Achakulwisut et al.[17] analyzed global fossil fuel reduction pathways under different mitigation scenarios, while Tan et al.[18] employed a multiscale geographically weighted regression model to uncover the spatially varying impacts of Gross Domestic Product (GDP), urbanization, energy intensity, and energy structure on provincial emissions in China. Furthermore, recent methodological advances include the hybrid Prophet-VMD-LSTM approach for forecasting air-conditioning-related emissions in a Chinese mall[19] and a regional analysis of driving forces in Central Europe[20].
Russia is the world’s fifth-largest emitter, accounting for approximately 5% of total global emissions in 2024[21], with 79% of these emissions originating from the energy sector[22]. Notably, Russia’s total GHG emissions declined by 33.8% [without Land Use, Land-Use Change and Forestry (LULUCF)] in 2023 compared to its 1990 levels[22]. However, regional heterogeneity in emission profiles remains insufficiently investigated due to the country’s vast territory, economic disparities, and complex energy structure.
Russia spans multiple climate zones and possesses a wide range of energy resources and industrial structures, ranging from resource-intensive extraction in Siberia to service-oriented economies in the European part of the country. Climate risks are also unevenly distributed: the southwestern regions are primarily affected by water stress and heatwaves, while the northeastern regions face permafrost degradation and increased wildfire activity[23]. This spatial disparity in both climate vulnerabilities and economic structures underscores the importance of developing region-specific initiatives that complement the national low-carbon development strategy.
In line with this approach, as of 2025, 82 regions of Russia have developed their own climate change adaptation plans[24]. Among these, Moscow, the Republic of Sakha (Yakutia), the Republic of Komi, the Republic of Tatarstan, the Irkutsk and Arkhangelsk regions, and Stavropol Krai have begun implementing low-carbon development practices[25].
The Republic of Tatarstan exemplifies the regional complexity characteristic of highly industrialized regions within the Russian Federation. As a major industrial center, the region derives 47.1% of its gross regional product from industry, especially from the mining and manufacturing sectors[26]. These energy-intensive industries have contributed to the region’s greenhouse gas emissions while simultaneously driving its economic development. While the national energy sector has followed a relatively stable emissions trajectory, with a marginal increase of 1.9% over the period 2016-2021[22], energy-related emissions in the Republic of Tatarstan increased by 28.8% during the same period[26]. This trend reflects a more intensive expansion of energy-related activities at the regional level, primarily driven by fuel combustion in stationary sources, which accounted for 28.7 Mt of the total 31.8 Mt of energy-related emissions in 2021[26].
The Republic of Tatarstan serves as a representative case study and a benchmark for industrially developed Russian regions undergoing the energy transition. By the end of 2023, 100% of the technically feasible level of network gasification was attained in 11 Russian regions, including the Tatarstan, Samara, Orenburg, and Saratov regions[27]. Tatarstan achieved a near-complete natural gas penetration rate of 99.5% in 2025[28], significantly exceeding the national average of 74.7%[29] and demonstrating the effective implementation of federal programs. Concurrently, the republic has developed the district’s largest concentration of high-emission, energy-intensive petrochemical and oil extraction capacities[30]. The widespread conversion to natural gas, combined with sustained industrial growth, has supported the region’s economic development, even as conventional mitigation measures have reached a high level of implementation[26,30,31].
From the perspective of the marginal abatement cost curve (MACC) theory, low-cost abatement options, such as energy efficiency improvements and fuel switching to natural gas, are typically implemented first. Once these measures are largely exhausted, further emission reductions require more capital-intensive technological and structural solutions.
The purpose of this study is to quantify the changes in GHG emissions from fuel combustion in the Republic of Tatarstan over the period 2005-2022 using the logarithmic mean Divisia index (LMDI) decomposition method in both the temporal and sectoral dimensions. The results will support the design of targeted and region-specific approaches to low-carbon development for highly industrialized Russian regions.
Given these factors, Tatarstan’s experience offers high external validity for understanding emission dynamics in other industrially developed Russian regions. Although regional GHG accounting has been conducted since 2014, a comprehensive analysis of the socio-economic and environmental drivers behind energy-related emission trends remains insufficiently represented in scientific literature. This gap justifies the need for the present study, which aims to provide analytical support for the further development of region-specific approaches.
The LMDI decomposition method, originally developed by Ang[32,33], was chosen to analyze GHG emission drivers in the Republic of Tatarstan. Among the main decomposition approaches, such as index decomposition analysis (IDA), structural decomposition analysis (SDA), and production-theoretical decomposition analysis (PDA)[34], the LMDI method provides distinct methodological advantages that align with the data characteristics of this study. SDA requires annual input-output tables at the subnational level, which are rarely available and impose heavy data demands[34-36]. PDA can incorporate technological frontier concepts but often produces structural-effect estimates inconsistent with observed economic realities[34,37]. In contrast, LMDI, a refined IDA variant, requires only moderately disaggregated time-series data on sectoral energy consumption, fuel types, economic output, and emission factors. According to Ang[32], it delivers a perfect decomposition with no residual term, ensures consistent aggregation from subgroups to totals, and robustly handles zero values via a small positive constant. Although logarithmic terms prevent the direct treatment of negative values, such cases are rare in energy and environmental studies.
Consequently, LMDI yields straightforward, policy-relevant results. The data structure of the present research comprises annual time-series data, sectoral energy consumption (2005-2022), and corresponding GHG emissions. This structure aligns with the modest data requirements and analytical strengths of the LMDI approach, making it particularly suitable for the Republic of Tatarstan. These properties have made LMDI the preferred method in recent regional and national carbon emissions studies across both developed and transition economies. LMDI has been widely employed to determine GHG emission drivers across countries[38-44] and regions[45-50]. For example, Miao et al.[51] combined LMDI with a Bass model to identify carbon emission drivers and provide a forward-looking assessment of carbon capture and storage (CCS) technology diffusion and its potential contribution to long-term emission reduction. Expanding this analytical framework, He et al.[52] integrated LMDI with K-means clustering to examine carbon emissions from the Chinese electricity industry.
Existing Russian studies mainly focus on the national level, such as validation the Environmental Kuznets Curve for economy-related emissions[53,54]. Recent sub-national research has examined the impacts of the agricultural and manufacturing sectors on CO2 emissions[55]. Several regional GHG emission inventories and carbon-balance assessments have been produced for Russian federal subjects. For instance, Xiao et al. (2021)[56] provided a dataset of CO2 emissions across Russia’s 82 constituent entities, focusing primarily on emission accounting and its spatial distribution. Similarly, Filimonova et al.[57] assessed greenhouse gas emissions from the energy sector in the Novosibirsk region, while Pakina and Tul’skaya[58] conducted a carbon balance assessment specifically for the Republic of Tatarstan, estimating both anthropogenic CO2 emissions and the carbon sequestration capacity of forests and agricultural lands at the district level. However, these studies concentrate on emission inventories and carbon accounting rather than on identifying and quantifying the underlying socioeconomic and technological driving forces behind emission changes. National-level decomposition studies using similar LMDI-based approaches[59,60] demonstrate that technological improvements in energy efficiency act as the dominant mitigating factor, resulting in a relatively stable national emissions trajectory despite moderate economic growth. In the case of the Republic of Tatarstan, this study examines the extent to which the activity effect driven by economic growth and the energy intensity effect have shaped regional GHG emissions. Attention is given to the interaction between energy intensity improvements and sustained economic activity in the context of the Republic’s advanced industrial structure.
Although national-level decomposition studies on Russia’s GHG emissions exist, research on the driving factors at the level of federal subjects remains relatively scarce. A systematic literature search identified only a small number of subnational decomposition studies. Although no comparable LMDI studies exist for other energy-intensive Volga regions, emission inventories indicate similar industrial profiles[56]. The present analysis provides a detailed case study of emission dynamics in one of the highly industrialized regions of the Russian Federation, which may serve as a useful benchmark for understanding similar processes in comparable subjects. The contribution of this study lies in the application of a six-factor LMDI decomposition to an advanced industrialized region with a high level of gasification and modernization. This approach allows for a more comprehensive examination of the interplay between economic growth and emission trends in such regions.
In view of the scant subnational research in Russia, this study fills the current research gap by conducting a detailed analysis of the Republic of Tatarstan. The region exhibits specific features in its energy-related emissions trajectory that reflect its socio-economic and climatic conditions. First, this study compiles a GHG inventory to examine emission trajectories, emission factors, and dynamic changes in the energy consumption structure and regional economy. Second, the driving forces behind GHG emission changes from fuel consumption are decomposed using the LMDI method, with particular attention to the roles of energy intensity and economic structure, while accounting for the region’s prolonged heating season and substantial industrial production capacities. The six-factor decomposition framework was specifically designed to reflect the socio-economic and industrial characteristics of the Republic of Tatarstan, including its energy-intensive production structure and advanced gasification level. This configuration enables the identification of scale-dominated emission dynamics that may be obscured in studies relying on aggregated data and default emission parameters.
METHODS
Case study area
The Republic of Tatarstan is a highly industrialized region located in the East European Plain, at the confluence of the Volga and Kama rivers. The geographical location of the region is shown in Figure 1. It serves as a key economic center of the Russian Federation with a strong concentration of energy-intensive industries, including petrochemicals and machinery.
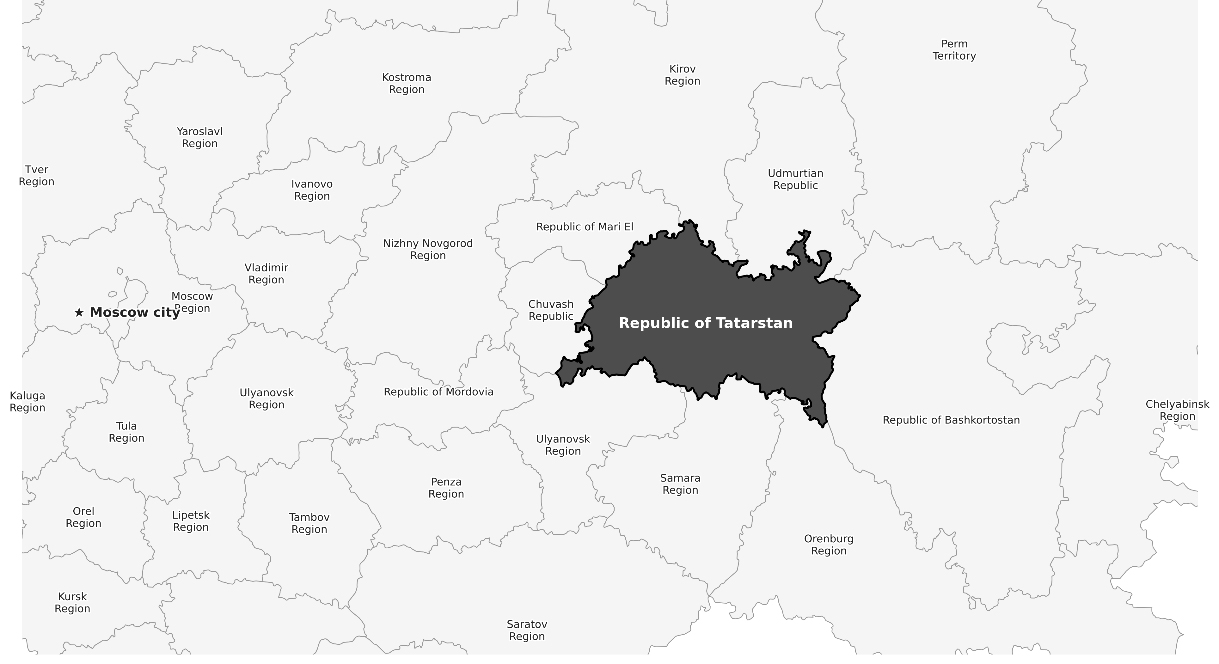
Figure 1. Geographic location of the study area within the Republic of Tatarstan within the Russian Federation. The map was created by the authors using publicly available administrative boundary data from Natural Earth (https://www.naturalearthdata.com, public domain) with Python software.
This region is characterized by a temperate continental climate, with a heating season typically lasting from October to April. This extended heating season drives substantial natural gas consumption in the residential and energy-generation sectors. Notably, Tatarstan was among the first Russian regions to develop a dedicated Climate Adaptation Plan[26].
Emission accounting method
This study focuses on energy-related greenhouse gas emissions, which account for the majority of total emissions in the Republic of Tatarstan[61]. The methodology follows the Guidelines for National Greenhouse Gas Inventories issued by the Intergovernmental Panel on Climate Change (IPCC)[62] and the Guidelines for Conducting a Voluntary Inventory of Greenhouse Gas Emissions in the Constituent Entities of Russia[61].
Moreover, this study adopts country-specific emission factors provided by the Ministry of Natural Resources and Environment of the Russian Federation (MNRE) in addition to the default IPCC values. This choice is critical because the carbon content of Russian fossil fuels, particularly coal from specific mining basins, differs significantly from global averages[56].
The total GHG emissions from fuel combustion are expressed as:
where i and j represent energy types and socio-economic sectors, respectively. In this expression, CEij represents the overall emissions; ADij represents the consumption of fossil fuel type i in sector j; NCVi represents the net caloric value; CCi represents the carbon content or emission coefficient of fuel i; and Oij represents the oxidation efficiency of energy type i in sector j.
This study accounts for direct emissions (Scope 1) generated within the administrative boundaries of the Republic of Tatarstan. Fuels used for non-energy purposes were excluded from the combustion emission calculations, which are consistent with the IPCC guidelines to avoid double counting. Calculations were performed without accounting for the carbon sink capacity of the Land Use, Land-Use Change, and Forestry (LULUCF) sector, as the focus is placed exclusively on emissions from fuel combustion.
Decomposition analysis
To quantify the driving forces behind the changes in GHG emissions in the Republic of Tatarstan, this study employs the LMDI method. The LMDI approach, developed by Ang[32], is widely applied in energy and environmental studies due to its path independence, its ability to handle zero values, and the advantage of leaving no unexplained residual term.
Unlike the classical three- or four-factor Kaya identity commonly used in national studies[63-65], the proposed six-factor framework extends the model by explicitly separating the industrial structure and energy mix effects. The detailed disaggregation of the energy mix captures the implications of the Republic’s highly developed natural gas infrastructure, while the 12-sector industrial structure reflects the heavy concentration of petrochemical processing. These features, which are distinctive to the Republic of Tatarstan, necessitate the use of an extended six-factor framework. This approach provides a more precise understanding of emission drivers in the context of the regional economic structure and energy mix.
Specifically, the total GHG emissions are decomposed into six factors, including economic activity (G), industrial structure (IS), energy intensity (EI), energy mix (M), carbon intensity (CC), and the population effect (P). The decomposition analysis is conducted using Equation (2)[32]. The total GHG emissions are expressed as:
where k denotes the fuel type in each sector (k = 1, 2, 3, representing gas, oil, and solid fuels respectively); i, denotes the industrial sector (i = 1, 2, …, 12). In this Equation, A denotes the Gross Regional Product (GRP), E denotes energy consumption, and C denotes carbon emissions.
The variables in the LMDI model are detailed as follows. P represents the population. G = A/P represents per capita GDP, measuring economic growth and overall affluence. ISi = Ai/A reflects the proportion of the value added by sector i to the total GRP, representing the industrial structure effect. EIi = Ei/Ai represents the energy consumption per unit of GRP in sector i, referring to sectoral energy intensity. Mik = Eik/Ei is the share of fuel type k in the total energy consumption of sector i, representing the energy mix effect. CCk = Cik/Eik represents the carbon emissions coefficient for fuel type k, reflecting carbon intensity of a specific energy source.
The total change in GHG emissions from year t-1 to year t, denoted as ∆Ctot is given by Equation (3):
The impact of each factor is calculated using the following Equations:
The logarithmic mean weight function
Two-layer LMDI decomposition analysis at industrial level
To uncover the internal driving forces within the two most carbon-intensive sectors, the decomposition analysis is extended to a second layer. This two-layer approach applies the six-factor LMDI framework separately to the energy supply sector and the transportation and storage sector, replacing the gross regional product with sector-specific physical activity indicators. Owing data availability, this sub-sectoral analysis covers only the period 2017-2022.
The GHG emissions for the energy supply CE and transportation and storage CT sectors are expressed as follows:
where k denotes the fuel type in each sector (k = 1, 2, 3, representing gas, oil, and solid fuels respectively); while j and m represent the industrial sub-sectors for the energy supply and transportation sectors, respectively (j = 1, 2, m = 1, 2, … 5). In these Equations, E denotes energy consumption, and C denotes carbon emissions, and Q signifies the activity level of each sub-sector.
Specifically, the two-layer approach distinguishes electricity generation from heat production in the energy supply sector and separates passengers from freight transport, as well as road, rail, and water modes in the transportation sector. The activity levels are defined according to the following criteria:
Qj represents electricity produced (GWh) for the sub-sector “Electric power generation, transmission and distribution”, and heat output (thousand Gcal) for the sub-sector “Production of steam and hot water”.
Qm denotes road freight turnover (thousand t·km) for the sub-seсtors “Freight transport by road and removal services” and “Freight rail transport” road passenger turnover (thousand passenger·km) for the sub-sectors “Other passenger land transport” and “Passenger rail transport, interurban”, and water transport activity (internal water freight turnover in thousand t·km) for the sub-sector “Water transport”.
The variables in the LMDI model are detailed as follows. P represents the population. G = Q/P represents per capita physical output, which measures the intensity of sectoral activity relative to population size. ISj = Qj/Q or ISm = Qm/Q represent the sub-sectoral structure effect, reflecting the share of a specific activity within the total sectoral output. EIj = Ej/Qj or EIm = Em/Qm represent physical energy intensity, measuring the energy efficiency of the technological process. Mjk = Ejk/Ej or Mmk = Emk/Em is the share of fuel type k in the total energy consumption of sub-sector j and m, representing the energy mix effect. CCk = Cjk/Ejk or CCk = Cmk/Emk reflects the carbon emissions coefficient for fuel type k, reflecting the carbon intensity of a specific energy source.
The changes in GHG emissions within these two sectors, ∆CE and ∆CT are calculated using the corresponding sub-sector weights and the physical activity indicator Q, following the logic of Equations (3-10).
Data sources, treatment and limitations
Data used in this study were derived from various sources. Energy, economic, and demographic data were collected from the Unified Interdepartmental Statistical Information System (UISIS) and the Russian Federal State Statistics Service (Rosstat)[63,64,66-68]. Primary energy activity data were obtained from statistical form No. 4-TER (“Information on the use of fuel and energy resources”) from UISIS. This reporting form covers medium and large enterprises, which ensures high data reliability for both the industrial and power generation sectors.
Fuels supplied to the residential sector were assumed to be fully combusted, while fuels transferred to other enterprises were excluded to maintain precise administrative boundaries. Emission factors were sourced from the MNRE Guidelines for Conducting a Voluntary Inventory of Greenhouse Gas Emissions in the Constituent Entities of Russia[61] and are presented in Supplementary Table 1. These country-specific coefficients reflect the actual carbon content of various fuels consumed in the region and are recommended for use in national and regional greenhouse gas inventories.
Sectoral economic output data and physical output data were collected from Rosstat, while gross regional product data were sourced from UISIS. To ensure temporal comparability, all monetary values were adjusted to constant 2021 prices in Russian rubles using the official Rosstat GDP deflators[65]. The values were then converted to constant 2021 U.S. dollars using the average annual RUB/USD exchange rate for 2021 published by the Central Bank of Russia[69]. All raw data are publicly available through Rosstat and the Bank of Russia. Economic sectors were classified according to the official Russian classification of economic activities[70] as presented in Supplementary Table 2.
Several research limitations exist in this study. First, specific data processing procedures were applied to address structural breaks in official statistics. As Russian regional statistics did not systematically disaggregate final energy consumption by detailed economic activities before 2016, for the period 2005-2016, a proportional allocation method based on sectoral GRP shares was employed (Section 1 of the Supplementary Materials). The full calculation process of monetary adjustments and data conversion is reported in Section 2 of the Supplementary Materials. Second, core energy data are mandatorily reported only by medium and large enterprises; small businesses are not covered. Third, while the period 2014-2022 provides the most consistent high-detail statistical data on fuel consumption[30], the 2005-2022 time series was chosen to provide a long-term perspective by utilizing the aforementioned allocation methods. Consequently, future studies might incorporate additional data on small businesses to achieve an even more granular emission accounting framework.
To assess the robustness of the decomposition results, a targeted uncertainty and sensitivity analysis was performed. Sectoral energy consumption was perturbed at three levels (±5%, ±10%, and ±20%), using both one-at-a-time and simultaneous approaches. The analysis demonstrated the overall robustness of the decomposition outcomes. At the ±5% and ±10% perturbation levels, deviations in the cumulative change of GHG emissions were minimal, ranging from 0.07% to 1.45%. Under the more stringent ±20% scenario, deviations increased to 8.44% (simultaneous) and 13.04% (one-at-a-time). Importantly, the activity and energy intensity effect remained the most stable, with variations below 2.5% even at the ±10% perturbation level. The directional signs and hierarchical ranking of all effects were consistently maintained across nearly all tested scenarios.
In addition, the inherent limitations of the LMDI method, specifically the treatment of zero values and properties of the logarithmic weighting function, generated negligible impacts, with deviations below 0.06% in all scenarios.
RESULTS
Temporal trends and structure of GHG emissions
The temporal evolution of carbon emissions from 2005 to 2022 are presented in Figures 2 and 3. Total emissions increased from 29.56 Mt CO2eq in 2005 to 36.07 Mt CO2eq in 2022, representing a cumulative growth of 22%, with an average annual growth rate of 1.17%. This trend largely aligns with the dynamics of the gross regional product, reflecting the strong correlation between economic growth and energy consumption in the industrialized economy of the Republic of Tatarstan.
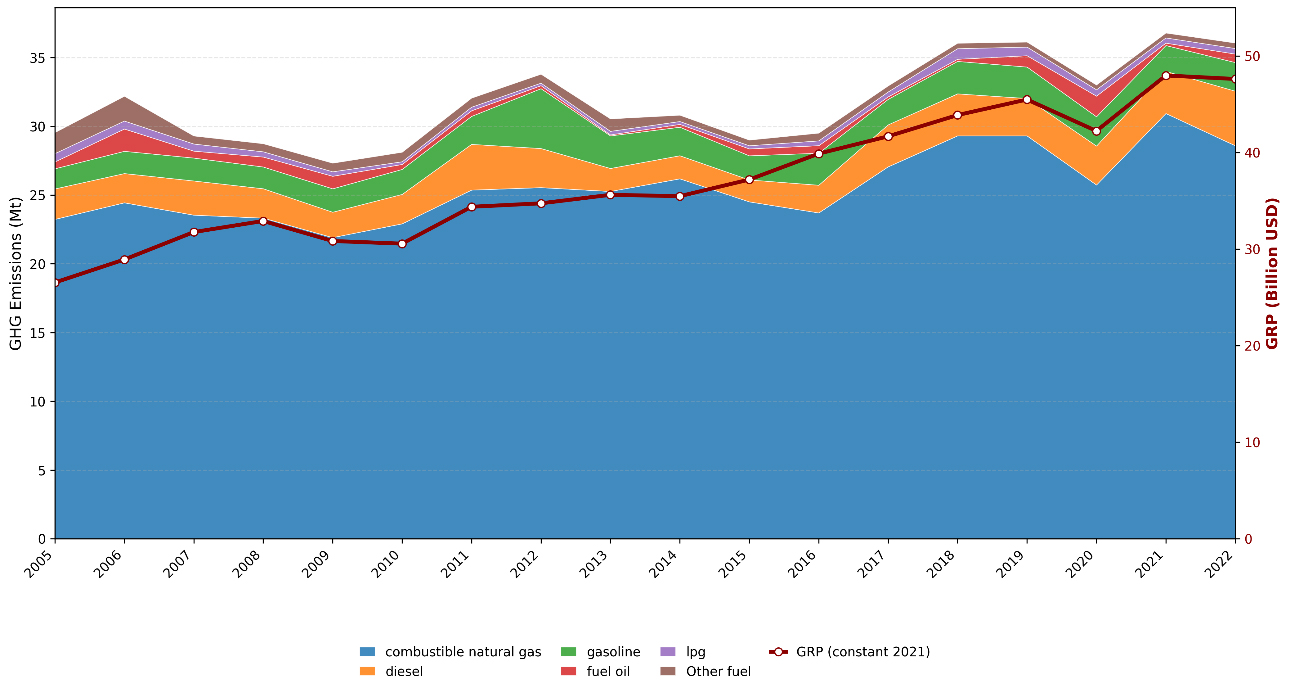
Figure 2. CO2eq emissions by fossil fuel type (2005-2022) in the Republic of Tatarstan. GHG: Greenhouse gase; GRP: gross regional product.
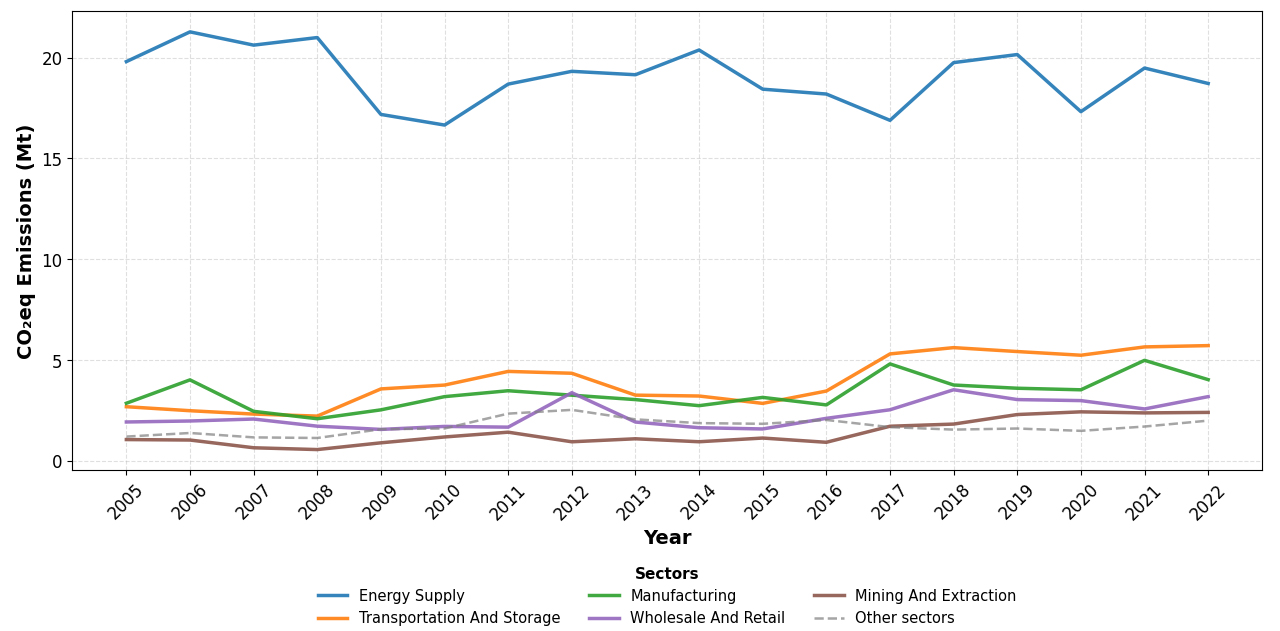
Figure 3. Sectoral CO2eq emissions in Tatarstan (2005-2022).
The temporal evolution of emissions is categorized into three phases based on the growth rates and economic activity. First, between 2005-2012, annual carbon emissions steadily increased from 29.56 Mt to 33.8 Mt at an average annual rate of 1.9%, primarily driven by the post-2000 industrial recovery the expansion of the energy supply sector, which was accompanied by increased natural gas consumption. Second, annual carbon emissions experienced slight fluctuations between 2013 and 2016, ranging from 29 Mt to 30 Mt, coinciding with regional GDP stagnation following the 2014 global oil price decline [Figure 2]. Third, a rebound occurred, with emissions rising from 32.95 Mt in 2017 to a peak of 36.80 Mt in 2021 before a slight decline to 36.07 Mt in 2022.
This post-2017 rebound was driven by a combination of structural factors and the post-pandemic economic recovery. It was facilitated by the commissioning of large-scale petrochemical capacities between 2019 and 2022, including an aromatics production complex, a heavy coker gas oil hydrotreater, a catalytic cracking unit, and an olefins complex. These investments supported energy-intensive processes in the energy supply and manufacturing sectors. Concurrently, the global oil price recovery (2017-2019) and the sharp post-2020 price surge stimulated higher output in oil refining and petrochemicals. Thus, the 2017-2022 period reflects the intersection of industrial investment cycles and energy price dynamics.
From a fuel structure perspective [Figure 2], combustible natural gas remains the dominant source of carbon emissions, consistently accounting for 78%-84% of the total throughout the study period. Its absolute volume increased from 23.24 Mt in 2005 to 28.60 Mt in 2022. This dominance is a consequence of the near-complete gasification of the energy sector in the Republic of Tatarstan. In contrast, solid fuel emissions declined sharply from 0.13 Mt in 2005 to 0.04 Mt in 2022. These changes in the fuel mix were driven primarily by the long-term shift toward natural gas.
Sectoral emissions exhibit notable differences [Figure 3]. The energy supply sector remained the largest contributor throughout the period, with emissions fluctuating between 16.5 and 20.2 Mt CO2eq over the period. Detailed analysis for the period 2017-2022 reveals that heat and steam production accounted for the bulk of emissions (9.3-11.2 Mt CO2eq) which originated almost entirely from natural gas.
The transportation and storage sector demonstrated the fastest growth, increasing from 2.7 Mt in 2005 to 5.7 Mt in 2022, particularly after 2015. Within this sector, road freight transport was the main contributor owing to diesel and gasoline consumption, while water transport exhibited markedly lower carbon intensity.
Manufacturing exhibited moderate growth from 2.8 Mt to 4.0 Mt, while agriculture, mining, and other sectors remained marginal contributors, each accounting for less than 2.5 Mt annually.
Driving forces of GHG emission changes
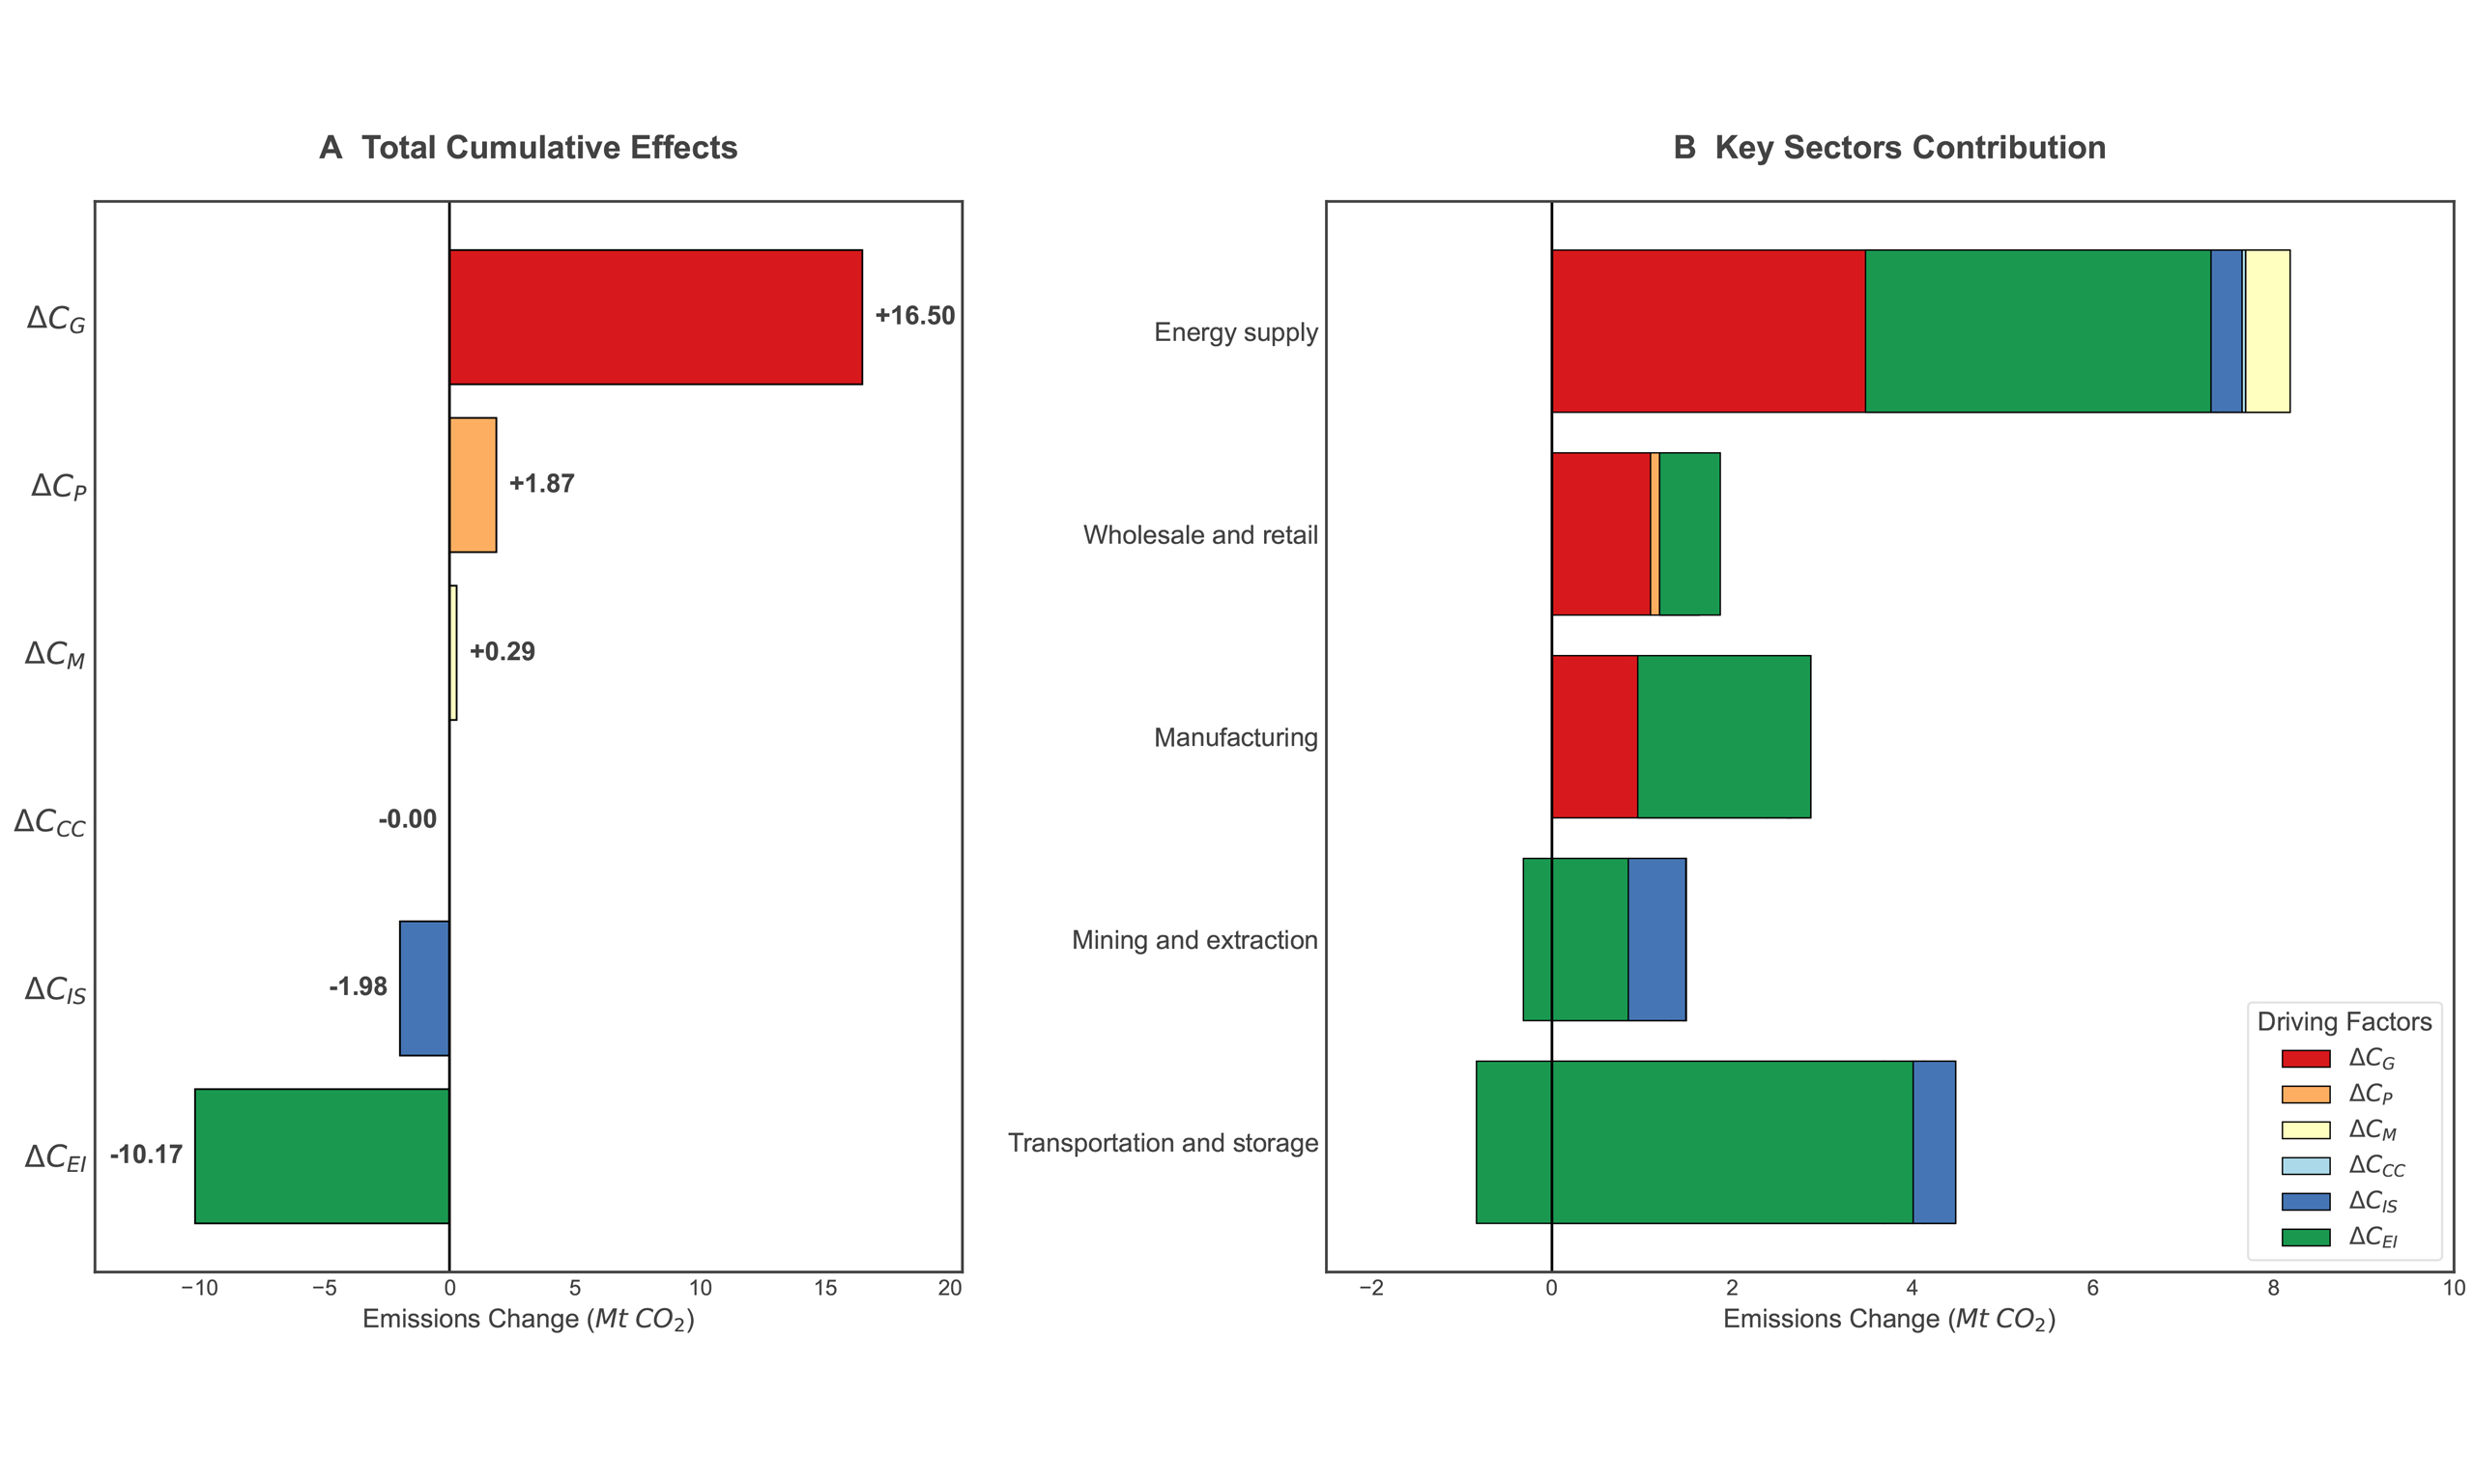
Cumulative decomposition analysis results are presented in Table 1; annual dynamics appear in the Supplementary Materials [Supplementary Table 3]. Total GHG emissions in the region increased by 6.51 Mt over the study period. This growth was predominantly driven by the activity effect, which contributed 16.50 Mt and represented the dominant positive driver each year. This effect is consistent with the region’s highly industrialized economic structure, where energy-intensive sectors such as petrochemicals, chemicals, and oil extraction account for a substantial share of the gross regional product.
Cumulative LMDI decomposition analysis results for GHG emissions in Tatarstan by sector and factor, 2005-2022 (Mt CO2eq)
| Sector | ∆CP | ∆CG | ∆CIS | ∆CEI | ∆CM | ∆CCC |
| Agriculture, forestry and fishing | 0.04 | 0.28 | -0.33 | 0.42 | 0.03 | 0.00 |
| Construction | 0.02 | 0.16 | -0.19 | 0.23 | 0.04 | 0.00 |
| Education, health and other services | 0.01 | 0.06 | 0.00 | 0.01 | -0.01 | 0.00 |
| Energy supply | 0.81 | 7.37 | -0.34 | -3.83 | -0.49 | -0.04 |
| Information and communication | 0.00 | 0.01 | 0.00 | 0.11 | 0.00 | 0.00 |
| Manufacturing | 0.27 | 2.39 | 0.26 | -1.92 | -0.04 | -0.01 |
| Mining and extraction | 0.14 | 1.33 | -0.64 | -1.16 | 0.03 | -0.01 |
| Other | 0.01 | 0.13 | 0.16 | 0.11 | 0.02 | 0.00 |
| Transportation and storage | 0.44 | 3.68 | -0.47 | -4.84 | 0.34 | 0.02 |
| Water and waste management | 0.00 | 0.01 | 0.00 | 0.03 | 0.00 | 0.00 |
| Wholesale and retail | 0.13 | 1.09 | -0.44 | 0.67 | 0.37 | 0.03 |
| Total | 1.87 | 16.5 | -1.98 | -10.17 | 0.29 | 0.00 |
As shown by the cumulative decomposition, the activity effect alone would have led to a significantly larger increase in emissions in the absence of mitigating factors. In contrast, the energy intensity effect emerged as the primary mitigating factor, offsetting emissions by 10.17 Mt. This substantial reduction reflects efficiency gains achieved in the energy supply and transportation sectors. These gains were supported by technological modernization, including the near-complete utilization of associated petroleum gas (98.36% in recent years)[71], deployment of high-efficiency combined-cycle gas turbine technologies, systematic replacement of outdated equipment[26], and commissioning of pyrolysis gas recovery systems[71]. These improvements align with regional energy-efficiency programs and have visibly reduced the overall energy intensity of the economy.
The industrial structure effect contributed to -1.98 Mt, and the energy mix effect added +0.29 Mt. Population growth added +1.87 Mt, while the carbon intensity effect was close to zero.
Sectoral decomposition further shows that the largest efficiency gains were observed in the transportation and storage sector as well as the energy supply sector. In the transportation and storage sector, the energy intensity effect reduced GHG emissions by 4.84 Mt, more than offsetting the activity-driven increase of 3.68 Mt [Figure 4], mainly through fleet modernization, a shift toward natural gas and Liquefied Petroleum Gas (LPG), and improved operational efficiency. Similar efficiency improvements were observed in the energy supply sector.
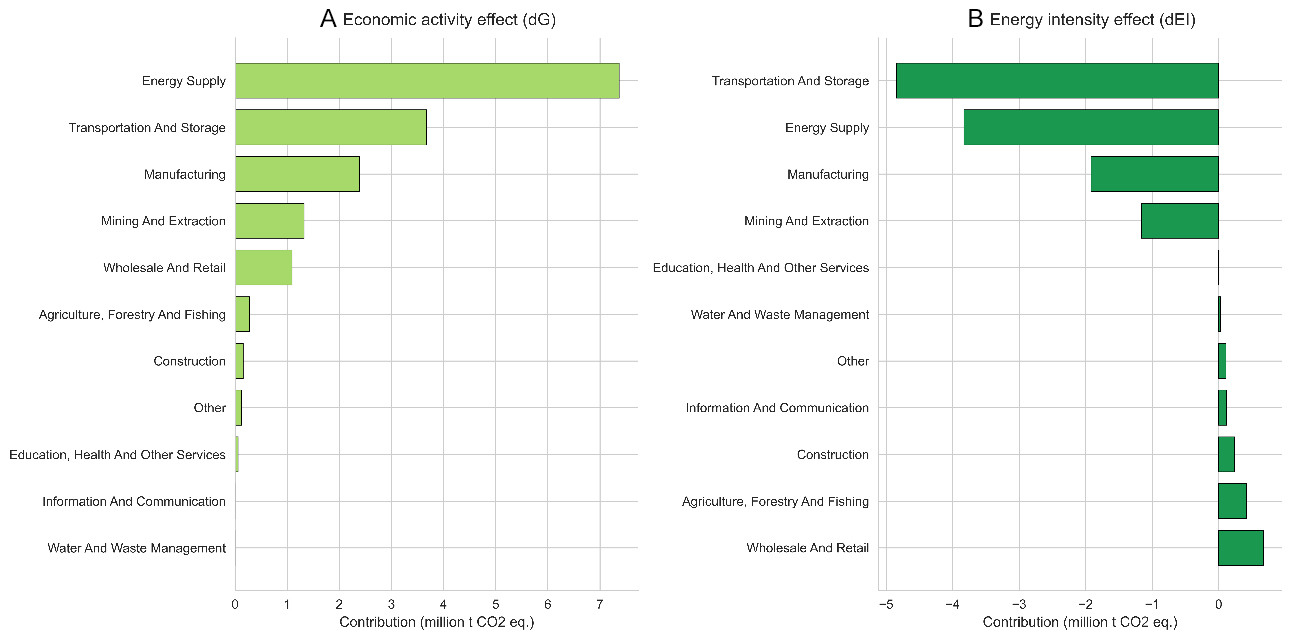
Figure 4. Sectoral contributions to key LMDI factors (2005-2022). LMDI: Logarithmic mean Divisia index.
Population growth exerted a relatively minor influence on total emissions, contributing +1.87 Mt over the entire period. This corresponds to a 4%-5% increase in the population of Tatarstan and is nearly an order of magnitude smaller than the contribution of the activity effect.
From a temporal perspective, the driving factors exhibited distinct patterns across different stages. During the 2008-2009 global financial crisis, the activity effect temporarily reduced emissions by 1.86 Mt. A similar short-term decline occurred during the 2019-2020 COVID-19 pandemic, when the activity effect lowered emissions by 2.68 Mt. These reductions proved transitory and were followed by strong rebounds in subsequent years.
Two-layer LMDI decomposition analysis of key sectors
A more detailed breakdown within these key sectors is presented in Figure 5. Decomposition results are listed in Supplementary Tables 4 and 5. Within the energy supply sector, the electric power generation, transmission, and distribution sub-sector recorded a negative intensity effect of -1.66 Mt during 2017-2022. This reduction was associated with the adoption of high-efficiency combined-cycle gas turbines and the modernization of generation facilities in line with federal and regional energy-efficiency programs. In contrast, the production of steam and hot water showed a positive intensity effect of +0.68 Mt, reflecting different rates of technological modernization across the sub-sectors of the energy supply system.
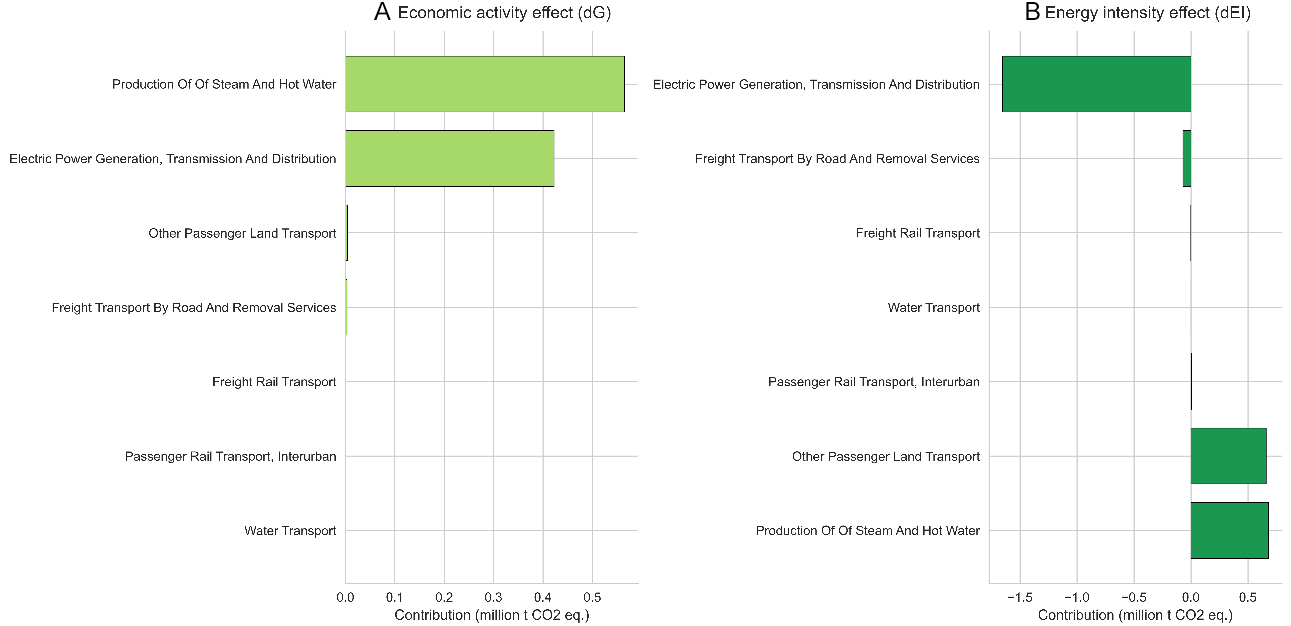
Figure 5. Sectoral contributions of sub-sectors related to the energy and transportation sectors to key LMDI factors (2017-2022). LMDI: Logarithmic mean Divisia index.
In the transportation sector, the intensity effect was +0.66 Mt in the «other passenger land transport» and -0.07 Mt in the «freight transport by road and removal services» sub-sector. Structural shifts further supported emission reductions in passenger land transport, while the rail (freight and passenger) and water transport sub-sectors contributed only marginally, reflecting their stable operations and lower emission intensity per unit of activity.
DISCUSSION
The LMDI decomposition results demonstrate a strong correlation between economic growth and GHG emissions in the Republic of Tatarstan. Specifically, the activity effect associated with gross regional product growth contributed to a cumulative +16.50 Mt CO2eq and remained the dominant positive driver throughout the study period.
This study contributes to the LMDI literature by providing a detailed single-region examination of emission driver dynamics in one of the most industrialized regions of the Russian Federation. This approach offers a level of insight and granularity that is difficult to achieve in national-level LMDI studies or multi-regional assessments covering all constituent entities of Russia.
The results show that, despite substantial gains already made in energy efficiency and gasification, the activity effect continues to exert an influence on emissions. These findings align with national-level evidence of a U-shaped relationship between economic growth and CO2 emissions in the Russian Federation[53], as well as with analyses highlighting the influence of electricity production on emission dynamics across Russian regions[55], including the Volga Federal District. This pattern underscores the importance of complementing conventional mitigation measures with additional structural and technological transformations aimed at further reducing the carbon intensity of the economy to achieve the country’s carbon neutrality target by 2060.
As one of the most industrialized regions of the Russian Federation, the Republic of Tatarstan possesses a strong industrial base, a highly developed natural gas infrastructure, and advanced technological capabilities. These advantages have already enabled substantial gains in energy efficiency and fuel switching. From the perspective of the marginal abatement cost curve theory, the region has reached an advanced stage of fossil-fuel infrastructure development in which the most cost-effective energy efficiency improvements and fuel-switching measures have already been largely implemented. In this context, regional emissions remain sensitive to the scale of economic activity, necessitating further structural and technological solutions to reduce carbon intensity while maintaining sustained economic growth.
Building on the LMDI decomposition results, which indicate the dominant role of the activity effect associated with GRP growth, this study proposes the following targeted policy recommendations. These measures are designed to complement existing mitigation efforts by leveraging the Republic of Tatarstan’s industrial potential, advanced energy infrastructure, and natural endowments, including locally identified wind resources.
In the energy supply sector, further efficiency improvements can be achieved through the gradual replacement of aging combined heat and power (CHP) units with more efficient technologies, the wider deployment of advanced cogeneration systems, and the installation of modern boilers. Pilot projects[72,73] on low-grade heat recovery and industrial symbiosis could also contribute to reducing the energy intensity of the heat supply.
Regarding the transport sector, differentiated strategies should be implemented for the passenger and freight segments. In passenger land transport, a balanced approach combining electrification and gaseous fuels is recommended. Priority could be given to expanding Compressed Natural Gas/ Liquefied Natural Gas (CNG/LNG) infrastructure for municipal and intercity buses through targeted subsidies and public procurement programs, while simultaneously piloting and scaling battery electric buses on urban routes with high daily mileage predictability, supported by the development of charging infrastructure. For road freight transport, targeted support is needed for the deployment of low-carbon heavy-duty vehicles, including those using biofuels and hydrogen technologies. In short- to medium-term, the wider adoption of compressed and liquefied natural gas in municipal and heavy-duty fleets offers a practical pathway, especially given the existing capabilities of local automotive manufacturers that are already developing hydrogen prototypes[73].
Finally, the Republic of Tatarstan’s natural advantages provide additional opportunities for diversifying its energy mix. For instance, wind measurement campaigns in the Kamsko-Ustyinsky, Rybnaya Sloboda, and Spassky districts have identified promising sites for wind power development[72]. These options can enhance the flexibility and resilience of the existing energy system without requiring large-scale structural changes.
Effective implementation of decarbonization measures in the Republic of Tatarstan can be supported by the further strengthening of regional environmental management systems. Key priorities include the development of a comprehensive GHG monitoring framework built upon the existing Volga Carbon Polygon by integrating remote sensing, ground-based measurements, and real-time industrial emission tracking. To ensure successful implementation, it is essential to further develop green financing mechanisms, introduce targeted support measures for low-carbon technologies, and promote closer collaboration between government bodies, industry, and scientific institutions.
CONCLUSION
This study evaluates both the sectoral and temporal drivers of greenhouse gas emissions in the Republic of Tatarstan from 2005 to 2022. The analysis shows that economic activity was the primary driver of emissions growth, particularly within the energy supply and transportation sectors, while improvements in energy intensity served as the most significant mitigating factor. The industrial structure and energy mix made comparatively smaller contributions to emission changes. These results are consistent with the structural features of the region’s highly industrialized economy.
Future research could focus on acquiring more granular, enterprise-level energy consumption data to overcome current statistical limitations and to further investigate holistic, sector-specific decarbonization pathways.
DECLARATIONS
Authors’ contributions
Conceptualization, methodology, data curation, investigation, formal analysis, visualization, writing - original draft: Demianenko, I.
Conceptualization, supervision, writing - review & editing: Geng, Y.
Availability of data and materials
The data supporting the findings of this study are available within this Article and its Supplementary Materials. Further data is available from the corresponding author upon reasonable request.
AI and AI-assisted tools statement
Not applicable.
Financial support and sponsorship
This study is financially supported by National Natural Science Foundation of China (Grant No: 72561147302; 72088101).
Conflicts of interest
Geng, Y. is the Editor-in-Chief of the Carbon Footprints journal. He had no involvement in the review or editorial process of this manuscript, including but not limited to reviewer selection, evaluation, or the final decision, while the other author has declared that he has no conflicts of interest.
Ethical approval and consent to participate
Not applicable.
Consent for publication
Not applicable.
Copyright
© The Author(s) 2026.
Supplementary Materials
REFERENCES
1. Lamb, W. F.; Wiedmann, T.; Pongratz, J.; et al. A review of trends and drivers of greenhouse gas emissions by sector from 1990 to 2018. Environ. Res. Lett. 2021, 16, 073005.
2. Intergovernmental Panel on Climate Change (IPCC). Global warming of 1.5 °C: IPCC special report on impacts of global warming of 1.5 °C above pre-industrial levels in context of strengthening response to climate change, sustainable development, and efforts to eradicate poverty; Cambridge University Press, 2022.
3. Noonan, S. H. C.; Birrell, C.; Fisher, R.; Fabricius, K. E. Progressive changes in coral reef communities with increasing ocean acidification. Commun. Biol. 2025, 8, 1518.
4. Feng, J.; Paynter, D.; Menzel, R.; Kramer, R. A strong constraint on radiative forcing of well-mixed greenhouse gases. Nature 2026, 652, 105-11.
5. Schuur, E. A.; Abbott, B. W.; Commane, R.; et al. Permafrost and climate change: carbon cycle feedbacks from the warming arctic. Annu. Rev. Environ. Resour. 2022, 47, 343-71.
6. Liu, Q.; Fu, C.; Xu, Z.; Ding, A. Global warming intensifies extreme day-to-day temperature changes in mid-low latitudes. Nat. Clim. Chang. 2025, 16, 69-76.
7. Masyagina, O. V.; Menyailo, O. V. The impact of permafrost on carbon dioxide and methane fluxes in Siberia: a meta-analysis. Environ. Res. 2020, 182, 109096.
8. Slawson, J. S.; Plink-bjorklund, P.; Reichler, T.; Baldassare, D. More intermittent mid-latitude precipitation accompanied extreme early Palaeogene warmth. Nat. Geosci. 2025, 19, 120-7.
9. Fu, Y.; Wu, Q. Recent emerging shifts in precipitation intensity and frequency in the global tropics observed by satellite precipitation data sets. Geophys. Res. Lett. 2024, 51, e2023GL107916.
10. World Meteorological Organization. WMO Greenhouse Gas Bulletin (No. 20): The State of Greenhouse Gases in the Atmosphere Based on Global Observations through 2023, 2024. https://library.wmo.int/viewer/69057/download?file=GHG-20_en.pdf&type=pdf&navigator=1 (accessed 2026-05-13).
11. Sun, L.; Liu, W.; Li, Z.; et al. Spatial and structural characteristics of CO2 emissions in East Asian megacities and its indication for low-carbon city development. Appl. Energy. 2021, 284, 116400.
12. Arvanitopoulos, T.; Bulian, S.; Wilson, C.; Jordan, A. J.; Tosun, J.; Vasilakos, N. Climate policy portfolios that accelerate emission reductions. Nat. Commun. 2026, 17, 1989.
13. Jiang, J.; Shi, S.; Raftery, A. E. Mitigation efforts to reduce carbon dioxide emissions and meet the Paris Agreement have been offset by economic growth. Commun. Earth. Environ. 2025, 6, 823.
14. Li, S.; Cui, C.; Meng, J.; et al. The heterogeneous driving forces behind carbon emissions change in 30 selective emerging economies. Patterns 2023, 4, 100760.
15. Guo, D.; Geng, Y.; Xu, H.; Triolo, P. Global copper tailings distribution and projection. Nat. Sustain. 2026.
16. Leal Filho, W.; Barbir, J.; Carpio-vallejo, E.; Dobri, A.; Voronova, V. Decarbonising the plastic industry: a review of carbon emissions in the lifecycle of plastics production. Sci. Total. Environ. 2025, 999, 180337.
17. Achakulwisut, P.; Erickson, P.; Guivarch, C.; Schaeffer, R.; Brutschin, E.; Pye, S. Global fossil fuel reduction pathways under different climate mitigation strategies and ambitions. Nat. Commun. 2023, 14, 5425.
18. Tan, S.; Zhang, M.; Wang, A.; Zhang, X.; Chen, T. How do varying socio-economic driving forces affect China’s carbon emissions? New evidence from a multiscale geographically weighted regression model. Environ. Sci. Pollut. Res. 2021, 28, 41242-54.
19. Zhou, M.; Yu, J.; Quan, W.; Meng, W. Research on predicting carbon emissions from air conditioning systems using Prophet-VMD-LSTM: a case study of a mall in northwest China. Energy. Build. 2026, 358, 117197.
20. Al-lami, A. Török, Á. Regional forecasting of driving forces of CO2 emissions of transportation in Central Europe: an ARIMA-based approach. Energy. Rep. 2025, 13, 1215-24.
21. Olhoff, A.; Bataille, C.; Christensen, J.; et al. Emissions Gap Report 2024: No more hot air … please! With a massive gap between rhetoric and reality, countries draft new climate commitments; United Nations Environment Programme, 2024. https://www.undp.org/sites/g/files/zskgke326/files/2025-01/egr2024.pdf (accessed 2026-05-13).
22. Romanovskaya, A. A.; Nakhutin, A. I.; Ginzburg, V. A.; et al. National inventory report: anthropogenic emissions by sources and removals by sinks of greenhouse gases for 1990-2023. Part 1: Federal Service for Hydrometeorology and Environmental Monitoring (Roshydromet); Yu. A. Izrael Institute of Global Climate and Ecology (IGCE), 2025. https://unfccc.int/sites/default/files/resource/RUS_NIR_2025_v1_rev_2025-04-18.pdf (accessed 2026-05-13).
23. Chernokulsky, A.; Makarov, I.; Aniskina, T.; et al. Heuristic relative assessment of climate risks in Russian regions. Sci. Total. Environ. 2025, 987, 179721.
24. Russian Gazette. Ministry of Economic Development: 82 regions of the Russian Federation have plans for climate change adaptation, 2025. (in Russian).https://rg.ru/2025/10/13/minekonomrazvitiia-u-82-regionov-rf-est-plany-po-adaptacii-k-izmeneniiu-klimata.html (accessed 2026-05-13).
25. SakhalinMedia. Climate practices in Sakhalin Oblast will be applied nationwide. 2025. (in Russian). https://sakhalinmedia.ru/news/2335659/ (accessed 2026-05-13).
26. Ministry of Ecology and Natural Resources of the Republic of Tatarstan. Action plan for the implementation of the low-emission socio-economic development strategy of the Republic of Tatarstan until 2050, 2023. (in Russian). https://eco.tatarstan.ru/file/pub/pub_3692081.pdf (accessed 2026-05-13).
27. PJSC Gazprom. Gazprom Group’s Social impact report 2023, 2023. https://sustainability.gazpromreport.ru/en/2023/ (accessed 2026-05-13).
28. State Council of the Republic of Tatarstan. Gasification level of the Republic of Tatarstan reached 99.5% (Press Release), 2025. (in Russian). https://gossov.tatarstan.ru/index.htm/news/3660.htm (accessed 2026-05-13).
29. PJSC Gazprom. Gazprom Group’s Social impact report 2024, 2024. https://sustainability.gazpromreport.ru/en/2024/ (accessed 2026-05-13).
30. Romanovskaya, A. A. Development of the Russian system of calculation-based monitoring of anthropogenic flows of climate-active substances. K6. Anthropogenic Emissions: Cadastre; Institute of Global Climate and Ecology named after Academician Yu. A. Izrael (IGCE), 2026. (in Russian). http://www.igce.ru/books/ (accessed 2026-05-13).
31. Green Finance and Investment. Mechanisms to Prevent Carbon Lock-in in Transition Finance; Green Finance and Investment; OECD Publishing, 2023. https://www.oecd.org/content/dam/oecd/en/publications/reports/2023/09/mechanisms-to-prevent-carbon-lock-in-in-transition-finance_cde6a38e/d5c49358-en.pdf (accessed 2026-05-13).
32. Ang, B. The LMDI approach to decomposition analysis: a practical guide. Energy. Policy. 2005, 33, 867-71.
33. Ang, B. LMDI decomposition approach: a guide for implementation. Energy. Policy. 2015, 86, 233-8.
34. Wang, H.; Yang, Y. Decomposition analysis applied to energy and emissions: a literature review. Front. Eng. Manag. 2023, 10, 625-39.
35. Zhao, Q.; Pan, C.; Zhang, Z.; et al. An inter-regional input-output table series of China from 1987-2017 with integrated carbon emission data. Sci. Data. 2024, 11, 1335.
36. Su, B.; Ang, B. Structural decomposition analysis applied to energy and emissions: frameworks for monthly data. Energy. Econ. 2023, 126, 106977.
37. Liu, B.; Meng, L.; Nie, B.; Shi, J.; Li, Y. Regional disparities and drivers of carbon emissions in China: a temporal-spatial production-theoretical decomposition analysis. Sci. Prog. 2023, 106, 00368504231163145.
38. Akyürek, Z. LMDI decomposition analysis of energy consumption of Turkish manufacturing industry: 2005-2014. Energy. Eff. 2020, 13, 649-63.
39. Alajmi, R. G. Factors that impact greenhouse gas emissions in Saudi Arabia: decomposition analysis using LMDI. Energy. Policy. 2021, 156, 112454.
40. Peng, H.; Kan, S.; Meng, J.; et al. Emission accounting and drivers in South American countries. Appl. Energy. 2024, 358, 122528.
41. Jeong, K.; Kim, S. LMDI decomposition analysis of greenhouse gas emissions in the Korean manufacturing sector. Energy. Policy. 2013, 62, 1245-53.
42. Koilakou, E.; Hatzigeorgiou, E.; Bithas, K. Carbon and energy intensity of the USA and Germany. a LMDI decomposition approach and decoupling analysis. Environ. Sci. Pollut. Res. 2022, 30, 12412-27.
43. Gu, J.; Jiang, S.; Zhang, J.; Jiang, J. An analysis of the decomposition and driving force of carbon emissions in transport sector in China. Sci. Rep. 2024, 14, 30177.
44. Bianco, V.; Cascetta, F.; Nardini, S. Analysis of the carbon emissions trend in European Union. A decomposition and decoupling approach. Sci. Total. Environ. 2024, 909, 168528.
45. Pan, X.; Guo, S. Decomposition analysis of regional differences in China’s carbon emissions based on socio-economic factors. Energy 2024, 303, 131932.
46. Li, J.; Ma, Z.; Sun, H.; Chen, W. Driving factor analysis and dynamic forecast of industrial carbon emissions in resource-dependent cities: a case study of Ordos, China. Environ. Sci. Pollut. Res. 2023, 30, 92146-61.
47. Colinet Carmona, M. J.; Román Collado, R. LMDI decomposition analysis of energy consumption in Andalusia (Spain) during 2003-2012: the energy efficiency policy implications. Energy. Eff. 2015, 9, 807-23.
48. Jiang, H.; Geng, Y.; Tian, X.; Zhang, X.; Chen, W.; Gao, Z. Uncovering CO2 emission drivers under regional industrial transfer in China’s Yangtze River Economic Belt: a multi-layer LMDI decomposition analysis. Front. Energy. 2020, 15, 292-307.
49. Jiang, B.; Sun, L.; Zhang, X.; Li, H. X.; Huang, B. The impacts of driving variables on energy-related carbon emissions reduction in the building sector based on an extended LMDI model: a case study in China. Environ. Sci. Pollut. Res. 2023, 30, 124139-54.
50. Qiao, D.; Luo, Y.; Chu, Y.; Zhang, H.; Zhao, F. Decomposition of agriculture-related non-CO2 greenhouse gas emissions in Chengdu: 1995-2020. J. Clean. Prod. 2024, 434, 140125.
51. Miao, Y.; Lu, H.; Cui, S.; et al. CO2 emissions change in Tianjin: the driving factors and the role of CCS. Appl. Energy. 2024, 353, 122122.
52. He, Y.; Xing, Y.; Zeng, X.; et al. Factors influencing carbon emissions from China’s electricity industry: analysis using the combination of LMDI and K-means clustering. Environ. Impact. Assess. Rev. 2022, 93, 106724.
53. Kilinc-ata, N.; Likhachev, V. L. Validation of the environmental Kuznets curve hypothesis and role of carbon emission policies in the case of Russian Federation. Environ. Sci. Pollut. Res. 2022, 29, 63407-22.
54. Yang, X.; Lou, F.; Sun, M.; Wang, R.; Wang, Y. Study of the relationship between greenhouse gas emissions and the economic growth of Russia based on the Environmental Kuznets Curve. Appl. Energy. 2017, 193, 162-73.
55. Pavel, T.; Amina, A.; Oleg, K. The impact of economic development of primary and secondary industries on national CO2 emissions: the case of Russian regions. J. Environ. Manage. 2024, 351, 119881.
56. Xiao, H.; Zhao, W.; Shan, Y.; Guan, D. CO2 emission accounts of Russia’s constituent entities 2005-2019. Sci. Data. 2021, 8, 172.
57. Filimonova, I. V.; Komarova, A. V.; Novikov, A. Yu. Determining the structure and dynamics of greenhouse gas emissions in the energy sector in the Novosibirsk region. Ekologiya Promyshlennogo Proizvodstva 2023. (in Russian). http://www.ipgg.sbras.ru/ru/science/publications/publ-opredelenie-struktury-i-dinamiki-vybrosov-44753-2023 (accessed 2026-05-13).
58. Pakina, A. A.; Tul’skaya, N. I. Assessment of carbon intensity of the Tatarstan economy for environmental management. Lomonosov Geogr. J. 2021, 2, 110-5.https://vestnik5.geogr.msu.ru/jour/article/view/846?locale=en_US (accessed 2026-05-13).
59. Bashmakov, I.; Myshak, A.; Bashmakov, V. A.; et al. Russian energy balance, energy efficiency, and energy-related GHG emission accounting system. Energy. Eff. 2023, 16, 67.
60. Bashmakov, I.; Myshak, A. Russian energy efficiency accounting system. Energy. Eff. 2014, 7, 743-59.
61. Kodeks CJSC. Guidelines for conducting a voluntary inventory of greenhouse gas emissions in the constituent entities of Russia. 2015. (in Russian). https://eipc.center/pdf/analitic/raspr_minprir_ros_16_04_2015_n_15.pdf (accessed 2026-05-13).
62. 2006 IPCC Guidelines for National Greenhouse Gas Inventories, Volume 2: Energy, 2006. https://www.ipcc-nggip.iges.or.jp/public/2006gl/vol2.html (accessed 2026-05-13).
63. The Unified Interdepartmental Statistical Information System of Russia (UISIS). Fuel and energy sources consumed from 2005 to 2016, 2016. (in Russian).https://fedstat.ru/indicator/37264 (accessed 2026-05-13).
64. The Unified Interdepartmental Statistical Information System of Russia (UISIS). Fuel and energy sources consumed from 2017 to 2022, 2022. (in Russian). https://fedstat.ru/indicator/63010 (accessed 2026-05-13).
65. Federal State Statistics Service (Rosstat). National Accounts of the Russian Federation, 2023. (in Russian). https://www.rosstat.gov.ru/statistics/accounts (accessed 2026-05-13).
66. Russian Federal State Statistics Service. Energy balance in Russian Federation (2005-2021), 2023. (in Russian). https://www.rosstat.gov.ru/enterprise_industrial (accessed 2026-05-13).
67. Federal State Statistics Service for the Republic of Tatarstan. Republic of Tatarstan: Statistical Yearbook 2022, 2023. (in Russian). https://16.rosstat.gov.ru/publication_collection (accessed 2026-05-13).
68. Federal State Statistics Service for the Republic of Tatarstan. Republic of Tatarstan: Statistical Yearbook 2021, 2022. (in Russian). https://16.rosstat.gov.ru/publication_collection (accessed 2026-05-13).
69. Central Bank of the Russian Federation (Bank of Russia). Statistical Database. https://cbr.ru/eng/ (accessed 2026-05-13).
70. Federal Agency for Technical Regulation and Metrology (Rosstandart). Russian Classification of Economic Activities code ОK 029–2014 (OKVED 2 NACE Rev. 2), 2014. (in Russian). https://rosstat.gov.ru/storage/mediabank/VRGUndRA/OKVED.pdf (accessed 2026-05-13).
71. Federal State Statistics Service for the Republic of Tatarstan. Main Socio-Economic Development Indicators of the Republic of Tatarstan in 2024, 2024 (in Russian). https://mert.tatarstan.ru/file/mert/File/%D0%98%D1%82%D0%BE%D0%B3%D0%B8%20%D1%81%D0%BE%D1%86%D0%B8%D0%B0%D0%BB%D1%8C%D0%BD%D0%BE-%D1%8D%D0%BA%D0%BE%D0%BD%D0%BE%D0%BC%D0%B8%D1%87%D0%B5%D1%81%D0%BA%D0%BE%D0%B3%D0%BE%20%D1%80%D0%B0%D0%B7%D0%B2%D0%B8%D1%82%D0%B8%D1%8F%20%D0%A0%D0%B5%D1%81%D0%BF%D1%83%D0%B1%D0%BB%D0%B8%D0%BA%D0%B8%20%D0%A2%D0%B0%D1%82%D0%B0%D1%80%D1%81%D1%82%D0%B0%D0%BD%20%D0%B2%202024%20%D0%B3%D0%BE%D0%B4%D1%83.pdf (accessed 2026-05-13).
72. Ministry of Ecology and Natural Resources of the Republic of Tatarstan. State Report on the State of Natural Resources and Environmental Protection of the Republic of Tatarstan in 2022; 2023. (in Russian). https://eco.tatarstan.ru/gosdoklad-2022.htm (accessed 2026-05-13).
73. Ministry of Ecology and Natural Resources of the Republic of Tatarstan. State Report on the State of Natural Resources and Environmental Protection of the Republic of Tatarstan in 2024; 2025. (in Russian). https://eco.tatarstan.ru/gosdoklad-2024.htm (accessed 2026-05-13).
Cite This Article
How to Cite
Download Citation
Export Citation File:
Type of Import
Tips on Downloading Citation
Citation Manager File Format
Type of Import
Direct Import: When the Direct Import option is selected (the default state), a dialogue box will give you the option to Save or Open the downloaded citation data. Choosing Open will either launch your citation manager or give you a choice of applications with which to use the metadata. The Save option saves the file locally for later use.
Indirect Import: When the Indirect Import option is selected, the metadata is displayed and may be copied and pasted as needed.
About This Article
Copyright

Data & Comments
Data
0


Comments
Comments must be written in English. Spam, offensive content, impersonation, and private information will not be permitted. If any comment is reported and identified as inappropriate content by OAE staff, the comment will be removed without notice. If you have any queries or need any help, please contact us at support@oaepublish.com.