


Exploring the carbon emission reduction potentials of low-carbon technologies in China’s copper industry
 0
0 Abstract
Primary copper (Cu) production is highly carbon-intensive because mining, smelting, and refining require substantial energy inputs, posing a major challenge to the industry’s low-carbon transition. Although low-carbon technologies are widely regarded as essential for decarbonization, the costs, benefits, and emission-reduction effects associated with different levels of technology adoption remain unclear, thereby hindering the development of effective decarbonization strategies for the Cu industry. This study evaluates 44 low-carbon technologies for primary Cu production and identifies optimal technology packages and adoption pathways for China's Cu industry. The analysis yields three main findings. (1) At the technical level, molten-salt heat storage and exchange technology demonstrates substantial mitigation potential and strong economic performance, making it a priority option for low-carbon technological transformation. (2) At the firm level, firms with strong investment capacity for low-carbon technologies (≤ 2,600 CNY/tCu) can adopt the most comprehensive technology packages, contributing approximately 62% of the cumulative carbon emission reductions (CERs) in China’s Cu industry from 2025 to 2050. These firms are therefore expected to play a leading role in sectoral decarbonization. (3) At the industry level, deploying technology packages tailored to firms with different investment capacities could enable China’s Cu industry to achieve cumulative CERs of approximately 190 Mt CO2-eq by 2050, with a corresponding cumulative investment cost of approximately 20 billion CNY. This study provides decision support for screening and implementing low-carbon technologies in the Cu industry.
Keywords
INTRODUCTION
Copper (Cu) is a key material for the electrification transition, and demand is increasing as renewable energy, energy storage systems, and grid expansion are being integrated[1]. However, this growth in demand intensifies pressure on the copper industry to transition to a low-carbon pathway. This contradiction is especially pronounced in China, the world’s largest producer and consumer of refined copper, where existing capacity is still dominated by pyrometallurgical processes that entail high energy consumption and carbon intensity. Therefore, identifying carbon emission sources from an industry-chain perspective becomes critical. The copper industry chain comprises mining and beneficiation, smelting, processing, and recycling. Among these, mining, beneficiation, and smelting are highly energy- and carbon-intensive, posing major constraints on the industry’s low-carbon transition[2]. Therefore, promoting the deployment of low-carbon technologies across these processes is critical to achieving deep emission reductions[2]. More importantly, however, most deep decarbonization technologies involve significant upfront capital expenditures and retrofitting investments. If their deployment does not account for firms’ financial constraints, the resulting emissions-reduction potential may be overestimated. Therefore, differences in investment capabilities at the enterprise level are becoming a decisive factor in the implementation of emissions-reduction measures[3].
Existing studies have outlined technological assessments for emissions-reduction in the copper industry at different scales. At the micro-level of individual technological units, Kulczycka et al. quantified the trade-off between reductions in direct combustion emissions and increases in indirect electricity emissions during smelting technology upgrades, emphasizing the need for synergistic decarbonization of production processes and energy systems[4]; Similarly, Maghsoudizadeh et al. investigated oxygen-enriched combustion and hydrogen-natural gas co-firing in flash smelting using an integrated modeling framework, demonstrating that while these strategies can substantially reduce emissions, they also lead to higher operating costs[5]. Beyond combustion-related technologies, research has focused on process integration, resource synergies, and energy flow optimization. For example, Wang et al.[6] and Hao et al.[7], respectively, validated the energy-saving potential of deep waste heat recovery and sensible heat recovery from slag. At the same time, Klaffenbach et al. systematically reviewed the routes for comprehensive utilization of copper slag and the associated engineering and environmental constraints[8]. Building on these studies, Zhou et al. further quantified the environmental performance of copper slag in scenarios such as mine backfilling and material substitution through life-cycle assessment[9]. At the macro-industry level, research has shifted towards emissions accounting and scenario simulation. These studies commonly use optimization models to quantify the potential to reduce emissions in the Chinese copper industry[10,11]. Prior studies have identified key emission hotspots[12,13] and outlined idealized pathways for sectoral transformation through strategies such as copper recycling and demand-side management[14,15]. Moreover, research on technology diffusion suggests that large-scale deployment is strongly shaped by cost dynamics, policy frameworks, and other uncertainties, meaning that technological availability does not necessarily translate into actual adoption[16]—an insight consistent with the conceptual framework of this study.
Although substantial evidence has been accumulated regarding the technological feasibility and sectoral emissions-reduction potential, a critical gap remains in translating technological potential into practical transformation pathways. This is largely because existing research rarely considers differences in firms’ financial capacity to invest in low-carbon technology upgrades, and often overlooks the synergies and trade-offs among technologies. Consequently, technology transformation pathways need to address not only which technologies should be adopted, but also who will adopt them, in what combinations and sequences, and under what financial constraints.
To address this gap, this study proposes a Firm-level Budget-Constrained Technology Package Decision (FBTD) model. The model identifies optimal technology packages for firms with different investment budgets and simulates technology pathways that balance economic performance and emission reductions. This study provides strong analytical support for the copper industry’s low-carbon transition.
METHODOLOGY
Figure 1 illustrates the technical roadmap of this study, comprising three layers: the input layer, the FBTD model layer, and the output layer. The details of each layer are described as follows:
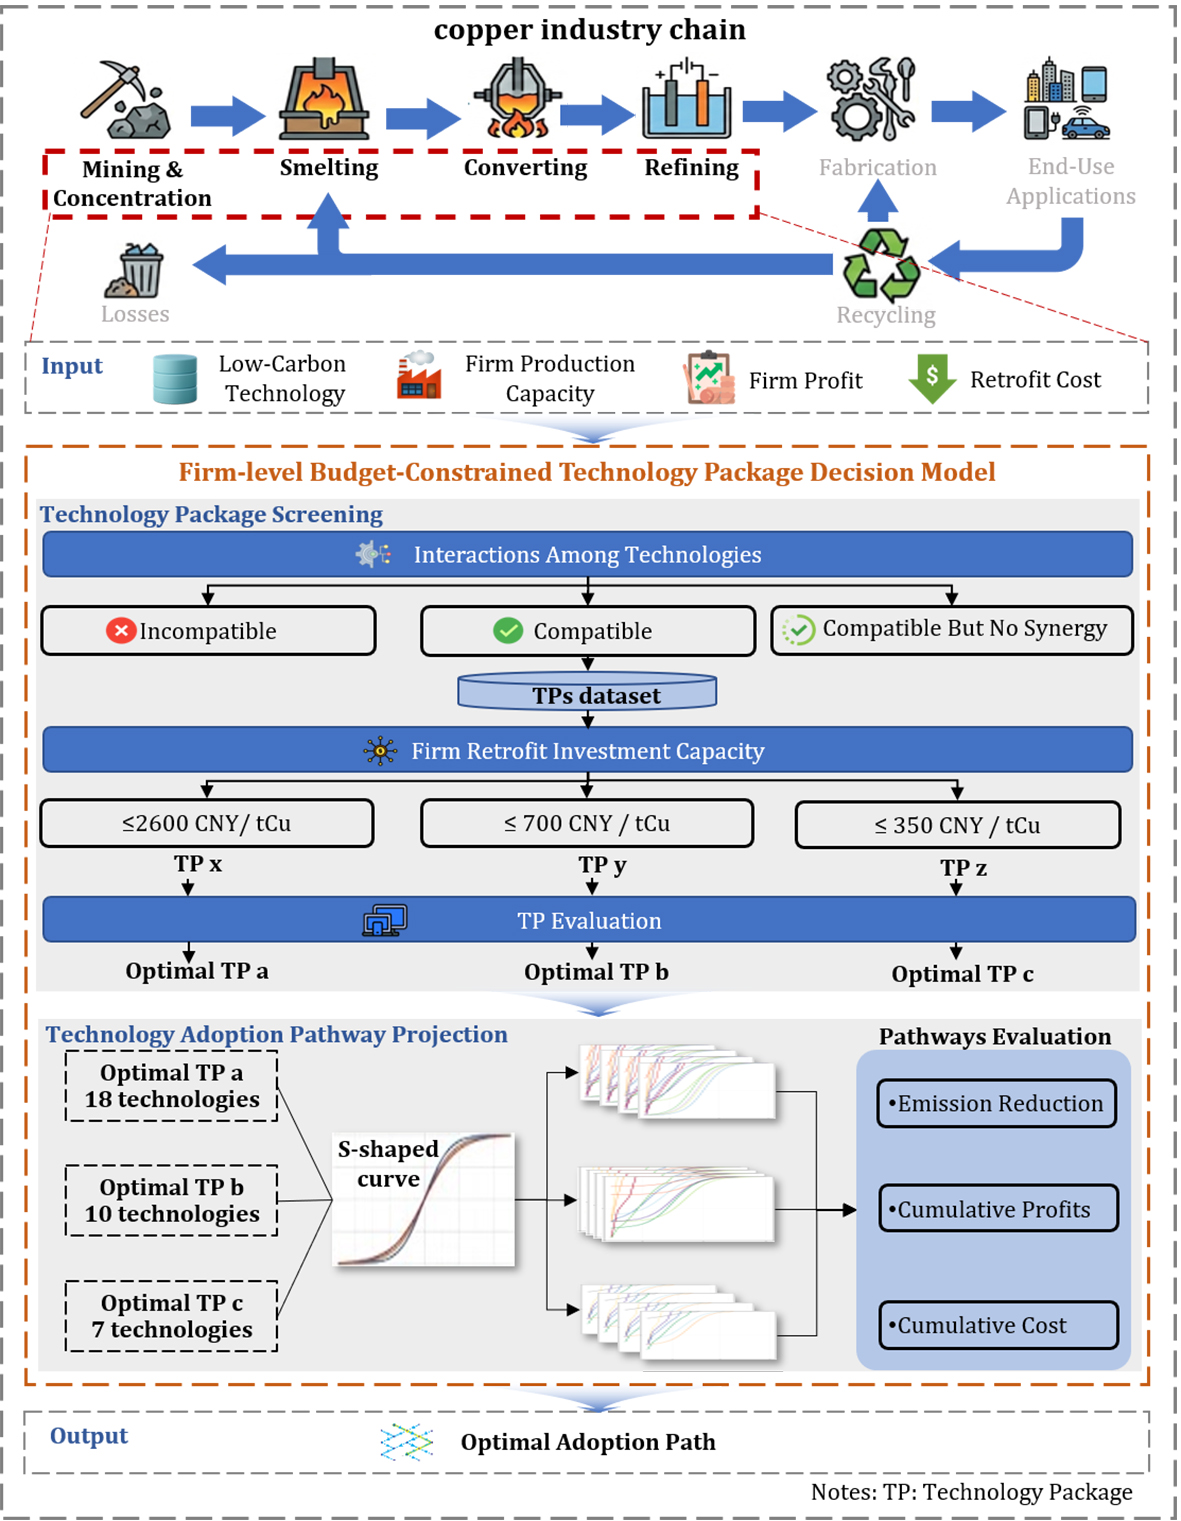
Figure 1. Technical roadmap.
(1) Input layer: Based on authoritative data sources, this study compiles an inventory of 44 low-carbon technologies. Key parameters for each technology, including emissions-reduction intensity, investment cost, and economic benefits, are uniformly quantified to enable a comprehensive and consistent evaluation framework.
(2) FBTD model layer: This model comprises two components:
(a) Technology package selection module. This module identifies combinations of low-carbon technologies with synergistic emissions-reduction effects based on their interrelationships, and selects optimal technology packages for firms with varying investment capacities.
(b) Technology diffusion pathway prediction module. This module simulates the adoption trajectories of different firm types from 2026 to 2050 and calculates the cumulative emissions reductions, costs, and benefits of each pathway, thereby identifying the optimal technology pathway for each firm type.
(3) Output layer: Finally, the optimal technology pathways of different firm types are aggregated to represent the optimal technology pathway for the entire industry.
System boundary
The spatial scope of this study is China, and the temporal scope spans from 2025 to 2050. The research focuses on primary copper production, which comprises two main stages: mining and beneficiation (including extraction, transportation, crushing, grinding, and flotation) and smelting (including smelting, converting, refining, and waste heat recovery).
Carbon emission accounting encompasses both direct emissions from fuel combustion and industrial processes (Scope 1) and indirect emissions associated with purchased electricity (Scope 2). To identify the optimal decarbonization pathway under stable production capacity, this study assumes that low-carbon technologies are deployed through the retrofitting of existing facilities. This assumption ensures that current production levels are not substantially disrupted.
Secondary copper pathways are not explicitly included in the model for two reasons. First, data on secondary copper production are limited. Second, China’s policies favor the co-processing of copper-bearing secondary resources within existing smelting systems.
Technology package assessment and screening
This study develops a low-carbon technology inventory using a two-step identification approach based on process-stage analysis and matching of technology-specific decarbonization mechanisms. First, the copper industry chain, covering mining and beneficiation as well as smelting processes, is systematically decomposed to identify key energy consumption and carbon emission nodes at each process stage. The results indicate that the identified processes account for more than 95% of total life-cycle carbon emissions, thereby ensuring comprehensive coverage of major emission sources.
Based on this, each emission node is matched with at least one low-carbon technology, either at the mature application stage or the industrial demonstration stage, according to its specific energy-use characteristics and emission mechanisms. This approach effectively avoids underestimating mitigation potential by omitting critical technologies.
Furthermore, the 44 low-carbon technologies included in this study are derived from authoritative national technology promotion catalogs and relevant official sources. All selected technologies are supported by verifiable engineering application cases, thereby ensuring their reliability and practical feasibility. During the screening process, several additional low-carbon technologies were identified; however, they were excluded due to data availability constraints. Nevertheless, the constructed technology inventory is considered to cover the vast majority of feasible mitigation technologies currently underpinning emission reduction efforts in China’s copper industry.
Evaluation metrics for low-carbon technologies
This study evaluates individual low-carbon technologies using five core parameters, summarized in Table 1. The technology inventory, along with the initial parameter values [Supplementary Table 1], is primarily compiled from authoritative sources, including the National Industrial Energy Conservation and Carbon Reduction Technology Application Guidelines and Case Studies, the Catalog of Green and Low-Carbon Advanced Technology Demonstration Projects, and the National Catalog of Key Low-Carbon Technologies for Promotion, among others. Furthermore, the technical characteristics of the identified technologies, along with the corresponding sources of parameter data, are systematically summarized in Supplementary Table 2.
Definition and calculation of technology parameters
| Parameter | Description | Calculation method |
| Capital investment cost | One-time capital expenditure required for core equipment | Estimated by aggregating the costs of key equipment based on technology catalogs, market quotations, or procurement information |
| Change in energy cost per ton of copper | Change in unit energy cost relative to the original process after technology adoption | Set to zero for energy-saving technologies; for technologies that introduce additional energy-consuming equipment, annual energy consumption is calculated based on equipment power and operating hours, and allocated per ton of copper |
| CO2 mitigation intensity | CO2 emission reduction per unit of cathode copper production | If mitigation data are directly available, values are calibrated to the baseline plant; otherwise, reductions are calculated from energy or material savings using corresponding emission factors |
| Cost savings per ton of copper | Operating cost savings or additional economic benefits per unit output after technology adoption | Derived from energy or material savings data, calibrated to the baseline plant, and converted into monetary terms |
| Adoption rate | Share of production capacity that has adopted the technology among comparable firms | Estimated based on industry reports, technology catalogs, and publicly disclosed firm-level information |
Due to substantial heterogeneity in process configurations and production conditions across firms, the emissions-reduction potential and economic performance of the same low-carbon technology may vary considerably. Direct adoption of parameters reported in technology catalogs or demonstration projects may therefore introduce systematic biases when applied across different firms and operating conditions. To address this issue, this study develops a baseline copper plant scenario representing the prevailing technological level in China [Supplementary Table 3]. Among these parameters, primary copper production capacity is derived from data collected from more than 40 enterprises [Supplementary Table 4]. The remaining parameters in the baseline scenario (e.g., furnace capacity, flue gas emissions, and the number of motors) are obtained from company annual reports and tender documents. This baseline scenario is used to harmonize the estimation of emissions-reduction and economic parameters. Specifically, when emissions-reduction data are reported directly in the literature, they are consistently recalibrated against the baseline scenario. When only changes in energy or material consumption are available, these values are converted under baseline conditions into unit-product CO2 mitigation intensity (TR_EI, tCO2-eq/tCu) and unit-product economic benefits (TR_EM, CNY/tCu).
Identification of technology relationships
To realistically assess the synergistic mitigation potential of low-carbon technologies, this study identifies inter-technology relationships based on their underlying mechanisms and functional roles within the production process. Three types of relationships are distinguished [Supplementary Figure 1]: complementary relationships, in which multiple technologies can be deployed jointly and independently; mutually exclusive relationships, in which certain options cannot be applied simultaneously; and constraining relationships, in which technologies can be deployed in parallel but whose mitigation effects are coupled and therefore may deviate from simple additivity.
This study identifies two types of operational constraints. First, combustion optimization and waste heat recovery technologies are mutually constraining. Combustion optimization reduces energy consumption by improving combustion efficiency and lowering flue gas temperatures. However, effective waste heat recovery typically requires sufficiently high flue gas temperatures; consequently, reductions in exhaust temperature can weaken the performance of waste heat recovery systems. Second, a constraining relationship also exists between combustion optimization technologies and carbon capture technologies. While combustion optimization reduces fuel consumption and CO2 emissions at the source, it may also alter the CO2 concentration and flow rate of the flue gas, thereby affecting the absorption efficiency and operational stability of carbon capture systems.
Quantifying constraining relationships, however, generally requires detailed plant-level operating parameters and system integration data. At present, publicly available data on coupled system operation remains limited. Consequently, this study does not quantitatively assess constraining relationships. Nevertheless, this limitation does not affect the identification of the two key relationship types—complementary and mutually exclusive—on which the subsequent analysis is based. As industry data and system integration experience continue to accumulate, future studies may further quantify constraining relationships through empirical analysis.
Firm-specific screening of optimal technology packages
Based on the identified inter-technology relationships, this study develops a library of technology packages, each comprising 2-20 individual technologies. The number of feasible technology packages reaches several hundred million combinations [Supplementary Figure 2]. Each technology package is evaluated using four key indicators: capital cost, operating cost, emission reduction intensity, and economic benefit. Benefiting from the FBTD model’s large-scale data-processing capabilities, these four indicators can be systematically quantified for all technology packages. The assessment assumes that under conditions of technological compatibility, individual technologies within a given package operate independently and that their economic and emissions-reduction effects are additive. Accordingly, for any given technology package, each indicator is calculated as the sum of the corresponding values of all constituent technologies, as defined in
where EP denotes the technology package-level indicators, including capital investment cost, energy cost per ton of copper, CO2 mitigation intensity, and cost savings per ton of copper, and EPi represents the corresponding indicator of the i-th individual technology within the package.
To characterize firms’ financial capacity for technology retrofitting, this study compiles cost data from 53 historical retrofit projects sourced from corporate annual reports, together with information on firm-level profits and production capacity [Supplementary Table 5]. Retrofit investment cost per ton of copper is adopted as a proxy for firms’ investment capacity. Based on this metric, firms are classified into three categories: Type I (≤ 2,600 CNY/tCu), Type II (≤ 700 CNY/tCu), and Type III (≤ 350 CNY/tCu). This indicator represents the upper bound of a firm’s investment capacity, and therefore cannot be exceeded. The production-capacity data for all sampled firms account for approximately 70% of China’s total copper smelting capacity and are therefore considered representative of the industry.
In the technology package selection module, this study identifies optimal technology packages for different firm types using the following approach: for each firm type, the maximum investment level observed in historical retrofit projects is used as the budget constraint. Technology packages that satisfy this budget constraint are first identified as feasible candidates. Subsequently, the candidate packages are evaluated using a dual-objective framework that prioritizes both high CO2 mitigation intensity and strong economic performance. Accordingly, a normalized weighted scoring method is applied to rank the candidate packages (Equation 2), with higher scores indicating more favorable technology packages.
where Si denotes the composite score of technology package i, Ri represents the economic benefit indicator of the technology package, Ei denotes the CO2 mitigation intensity indicator, and WRi and WEi represent the weights assigned to economic benefits and emissions mitigation, respectively.
Assessment of firm-level technology adoption potential
Under China’s carbon peaking and carbon neutrality targets, explicit policy support is expected to accelerate the deployment of low-carbon technologies in the copper industry. Within this policy context, this study assumes that all categories of low-carbon technologies have the potential for sustained long-term diffusion and may eventually reach saturation levels of adoption during 2026-2050. This assumption should not be interpreted as a projection of future market shares. Rather, it is intended to characterize the upper limits of potential technology adoption. These limits reflect what firms with different levels of investment capacity could achieve under combined policy and economic constraints.
CO2 mitigation intensity and total emissions reduction accounting
In simulating technology diffusion, Module 2 of the FBTD model builds upon the optimal technology packages identified in Module 1 to simulate diffusion pathways. The simulation uses firm types as the basic analytical units to model the diffusion trajectories of low-carbon technologies over the period 2026-2050. Because technology adoption typically follows an evolutionary pattern characterized by slow initial uptake, rapid acceleration, and eventual saturation, a logistic function is employed to characterize technology diffusion rates, as given by
where At,i denotes the adoption rate of individual technology i in year t, Amin represents the initial adoption rate in the base year, Amax denotes the maximum achievable adoption rate of the technology, t is the time variable, tm is the midpoint of the curve, representing the inflection point of adoption growth, and g is the growth rate.
Changes in CO2 mitigation intensity for each firm type in year t are driven by increases in the adoption rates of individual technologies, as determined by
where CEIt denotes the CO2 mitigation intensity of a given firm type in year t, TREIi represents the CO2 mitigation intensity of individual technology i relative to the baseline copper plant. By combining firm-type-specific capacity shares with national primary copper production, the total CO2 emissions reductions achieved by firm type w in year t can be calculated using
where CEw,t denotes the total CO2 emissions reduction achieved by firm type w in year t, SCw represents the capacity share of firm type w, and Dt represents China’s primary copper smelting output in year t.
Cost and benefit accounting
To compare the economic impacts of different technology adoption pathways, this study distinguishes costs into cumulative capital expenditure (CAPEX) and cumulative energy-related operating expenditure (OPEX). Economic benefits are measured as cumulative cost savings resulting from improvements in energy and material efficiency.
First, the scale of technology adoption across different firm types must be determined. The diffusion scale of technology i within firm type w is defined as follows:
where Scalei,t,w denotes the adoption scale of technology i for firm type w in year t, and SCCw represents the number of firms in firm type w, A2025,i represents the adoption rate of technology i in 2025.
CAPEX denotes the one-time equipment investment associated with technology diffusion and increases only during periods of rising adoption: it ceases to grow once adoption rates stabilize. In contrast, OPEX represents annual energy costs that persist over time based on the existing technology stock and therefore accumulate continuously. As adoption increases, additional OPEX arises from newly adopted capacity beginning the year of deployment and continuing in subsequent years, resulting in a dynamic accumulation process driven jointly by existing and incremental adoption. The CAPEX and cumulative operating (energy) cost are calculated as follows:
where CAPEXi,2050,w denotes the CAPEX of technology i up to 2050 for firm type w, Max represents the maximum value over the period 2025-2050, COSTi refers to the equipment cost of technology i, OPEXi,2050,w denotes the cumulative operating (energy) cost of technology i up to 2050 for firm type w, and Ei represents the energy cost per ton of copper associated with technology i.
The cumulative economic benefits, which follow the same accumulation pattern as OPEX and increase over time with rising technology adoption rates, are calculated using:
where CMw,2050 denotes the cumulative economic benefit of firm type w up to 2050, and TREMi represents the cost savings per ton of copper associated with technology i.
Screening and scoring of optimal adoption pathways
The technology adoption scenarios described above cover the full range of possible diffusion pathways. However, some of these scenarios represent idealized conditions and are therefore not practically feasible. Drawing on historical annual investment levels observed in firms’ retrofit projects, this study screens adoption pathways that are financially attainable under firms’ investment constraints
where RSi denotes the composite score of adoption pathway i, Ri represents cumulative CO2 emissions reductions, Rmin and Rmax denote the minimum and maximum cumulative CO2 emissions reductions among all possible diffusion pathways, respectively. Bi denotes cumulative economic benefits, Bmin and Bmax denote the minimum and maximum cumulative economic benefits among all possible diffusion pathways, respectively. Ci represents cumulative costs, Cmin and Cmax denote the minimum and maximum cumulative costs among all possible diffusion pathways, respectively.
Emissions mitigation scenario setting for China’s copper industry
The core objective of technological emissions reduction is to increase the penetration of low-carbon technologies across firms’ production capacity. Data on China’s primary copper production from 2026 to 2050 are derived from the study by Dong et al.[18]. To compare emissions-reduction outcomes under different technology adoption scenarios—namely, natural evolution, realistically achievable deployment, and the potential upper limit—this study defines three corresponding scenarios. Detailed parameters are presented in Table 2.
Key parameter settings
| Firm type | Dimension | CPS | CCS | IS |
| Type I firm | Capacity share | 50% | 50% | 50% |
| Total investment in technological upgrades (billion CNY) | / | 17 | 17 | |
| Annual investment in technological upgrades (billion CNY) | / | 2 | 2 | |
| Type II firm | Capacity share | 34% | 34% | 34% |
| Total investment in technological upgrades (billion CNY) | / | 3.5 | 11.5 | |
| Annual Investment in Technological Upgrades (billion CNY) | / | 1.8 | 1.4 | |
| Type III firm | Capacity share | 16% | 16% | 16% |
| Total investment in technological upgrades (billion CNY) | / | 1 | 5.5 | |
| Annual investment in technological upgrades (billion CNY) | / | 300 | 600 |
Current policy scenario (CPS): Under this scenario, the current policy framework is maintained without additional strengthening of technological incentives or mandatory regulatory constraints. Emissions reductions primarily result from increased substitution of recycled copper and gradual improvements in process management, thereby representing a natural evolution pathway. The future development trajectory of copper-containing products is assumed to continue along current trends[18].
Capital-constrained scenario (CCS): This scenario incorporates firms’ financial constraints and assumes deployment of economically feasible optimal technology packages, with diffusion rates determined by the financial capacity of different firm types. It represents the achievable level of emissions reduction under current economic conditions.
Ideal scenario (IS): In this scenario, all firms are assumed to possess the same financial capacity as Type I firms and therefore deploy the corresponding optimal technology packages. This scenario represents the upper limit of emissions reduction achievable under full realization of current economic potential and is used to assess the gap between potential and practical outcomes.
RESULTS AND DISCUSSION
Carbon emission reduction and economics of individual technologies
The 44 low-carbon technologies exhibit substantial heterogeneity in CO2 mitigation intensity, costs, and economic benefits [Figure 2]. Overall, waste heat recovery technologies demonstrate the highest mitigation potential. Among them, molten-salt thermal storage and heat-exchange technology achieves a mitigation intensity of approximately 0.63 tCO2-eq/tCu. This performance is primarily attributable to molten-salt systems’ ability to stably recover heat under flue gas conditions characterized by high dust loads and temperature fluctuations. As a result, waste heat utilization efficiency increases from roughly 30% to more than 90%. The associated cost is approximately 135 CNY/tCu, while the cost savings are around 300 CNY/tCu, indicating strong cost-effectiveness.
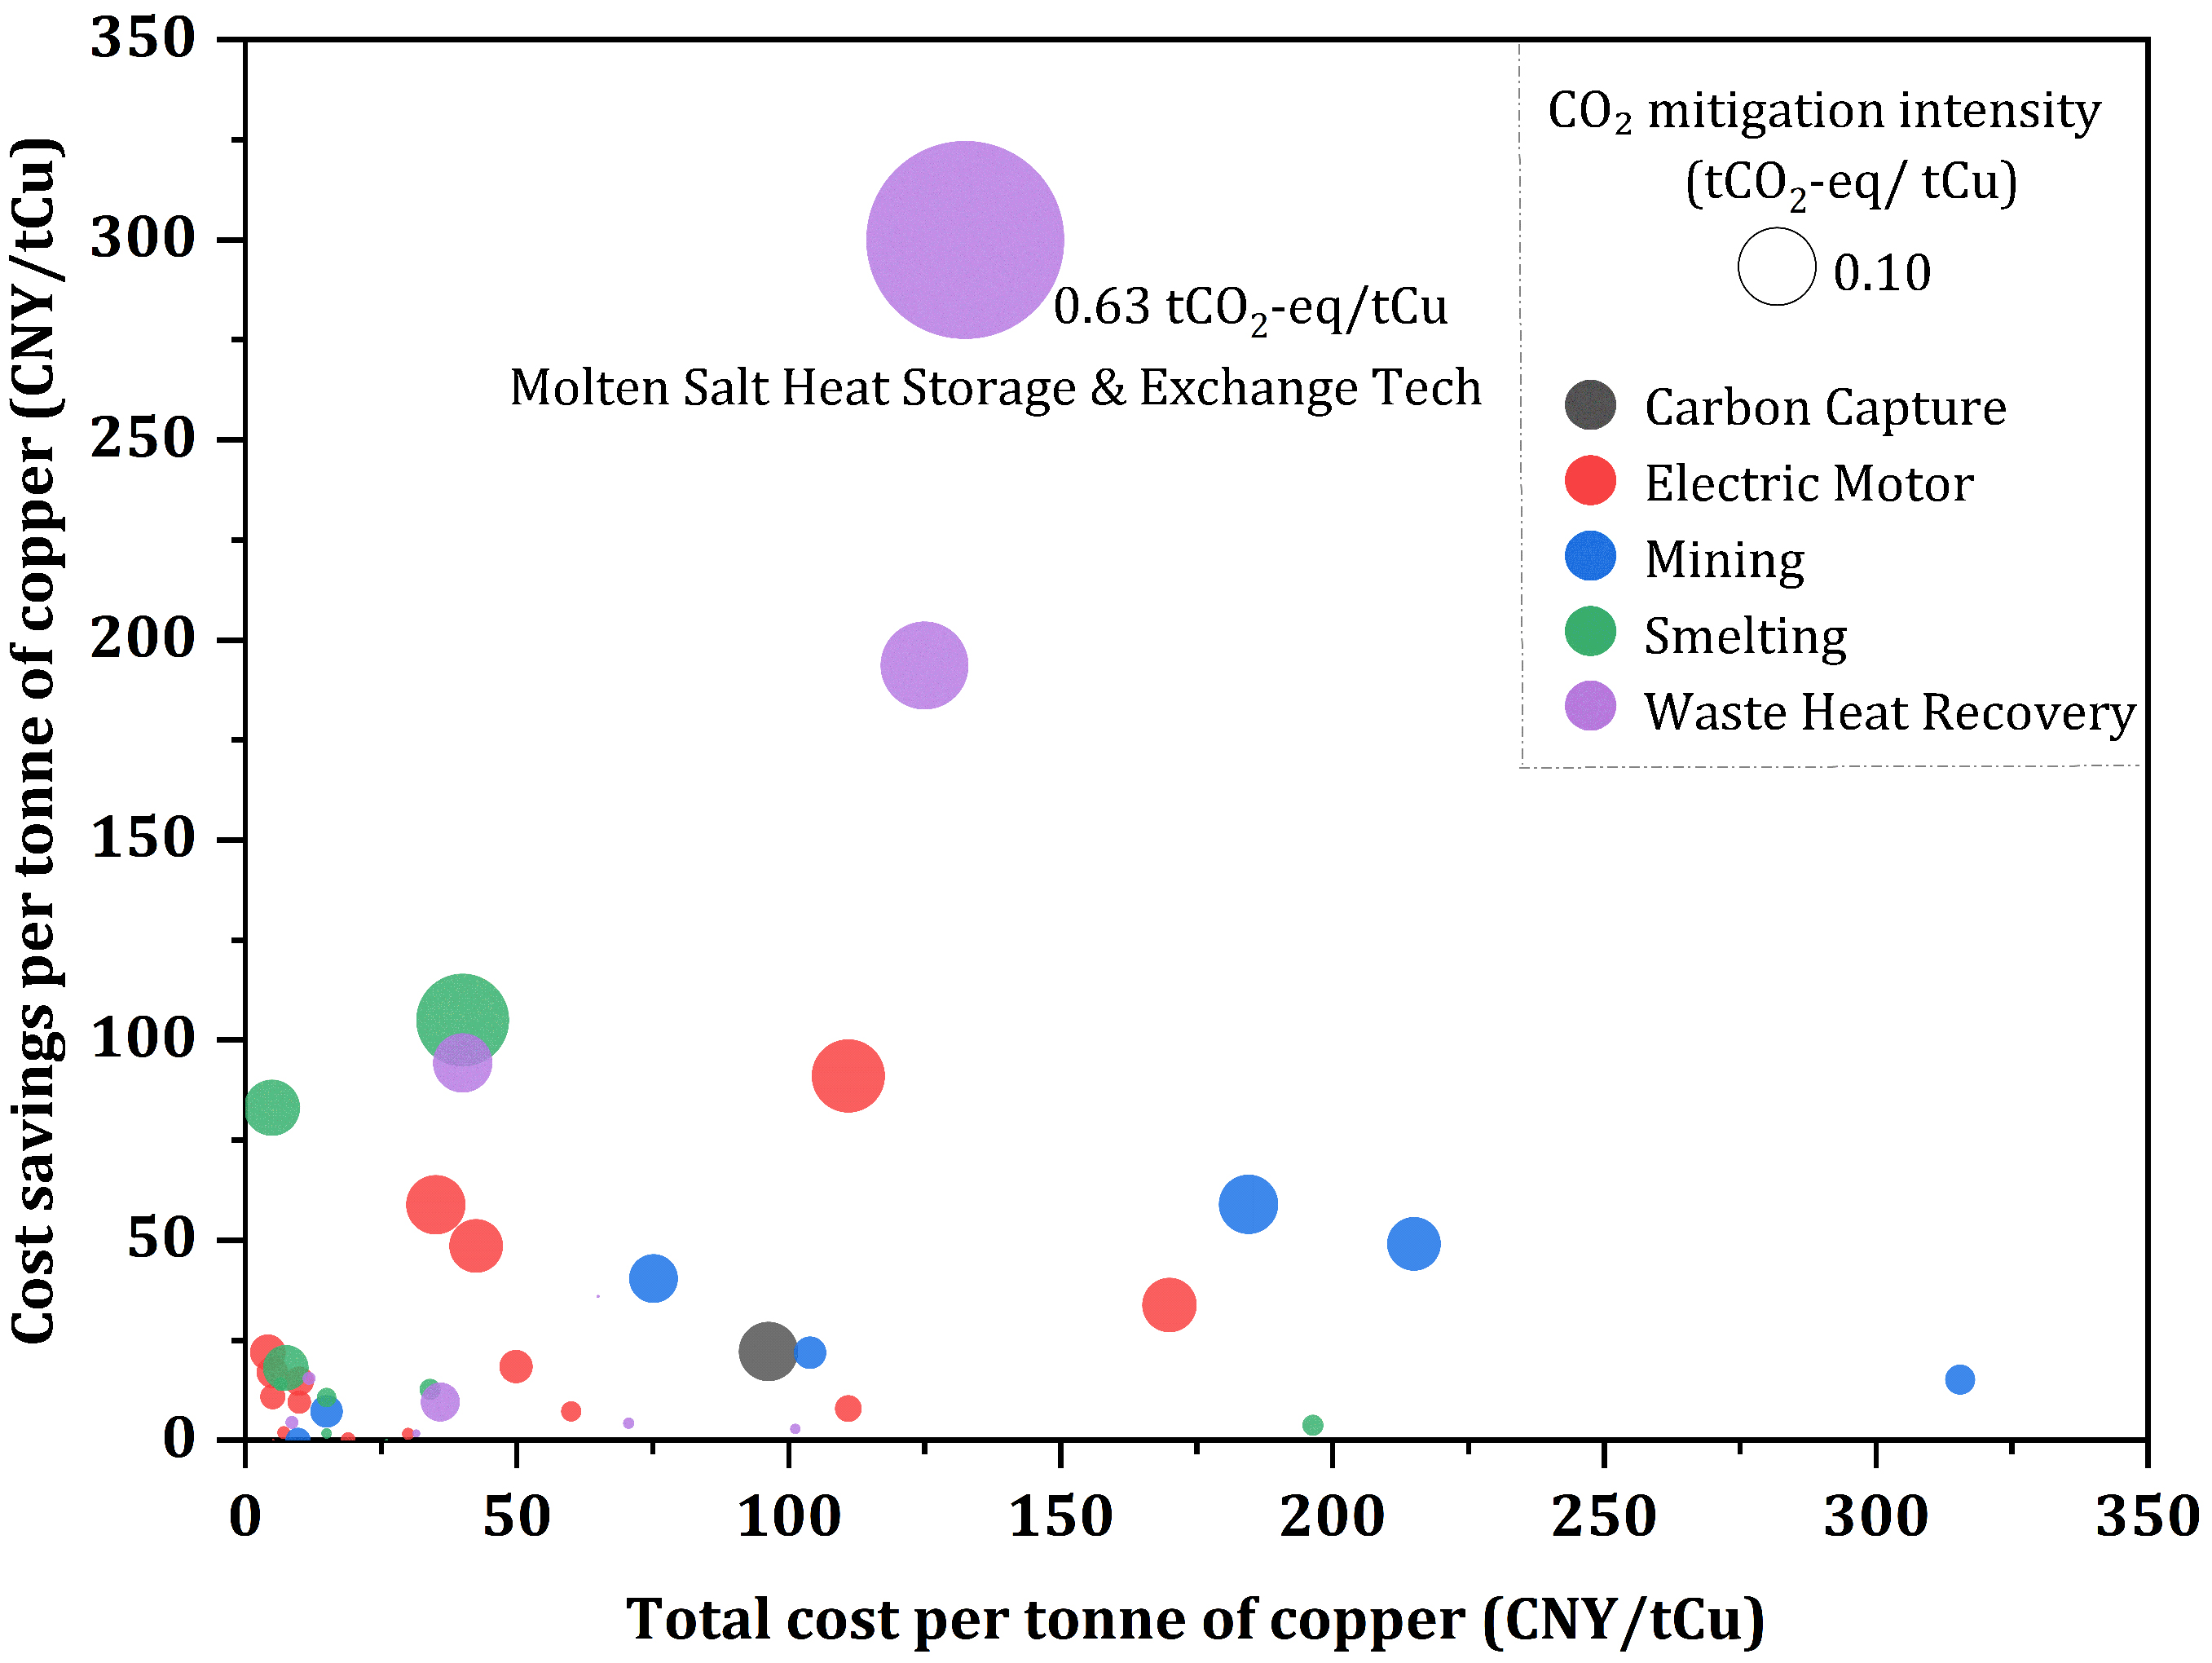
Figure 2. Comparison of costs, benefits, and CO2 mitigation intensity across individual technologies (Bubble size indicates CO2 mitigation intensity).
For copper slag heat recovery, two technologies are considered: gas-quenching high-temperature slag waste heat recovery and the multi-stage slag waste heat recovery system based on CaO-adsorbed gasification. These technologies exhibit mitigation intensities of approximately 0.125 and 0.056 tCO2-eq/tCu, respectively, with corresponding cost savings of about 190 and 95 CNY/tCu. The cost differential between the two technologies primarily stems from the need for an auxiliary power-generation unit in the former, whereas the latter enables heat recovery via a CaO/CaCO3 chemical looping process.
In the smelting and refining stage, electrolytic copper technology operating at a current density of 380 A/m2 enhances current efficiency and reduces electricity consumption, resulting in a mitigation intensity of approximately 0.14 tCO2-eq/tCu. This technology generates economic benefits of approximately
Electricity-intensive processes in the mining and beneficiation stage also offer substantial mitigation opportunities. Technologies such as high-pressure grinding rolls, IsaMill horizontal stirred media mills, and 600 m3 super flotation cells can achieve moderate emissions reductions (approximately
Comparison of optimal technology packages
Within the large-scale technology package library, the FBTD model identifies optimal technology packages for the three firm types under different capital constraints [Table 3]. A clear gradient pattern emerges, with greater capital availability enabling more comprehensive technology packages and deeper emissions reductions.
Comparison of optimal technology packages across different firm types
| Technology category and specific technology | Type I firms | Type II firms | Type III firms |
| Mining and beneficiation | |||
| · Electric mining truck | • | ||
| · High-pressure roller mill | • | ||
| · Isa Mill (horizontal stirred media mill) | • | ||
| · Super flotation cell (600 m3) | • | ||
| · Low-carbon explosives | • | • | |
| · Metal component-filled retaining walls and sealing technology | • | • | |
| Smelting | |||
| · Oxygen-enriched combustion technology | • | • | • |
| · Intelligent boiler control technology | • | • | • |
| · Gas-electric dual-drive technology for copper smelting | • | ||
| · 380 A/m2 current-density electrolytic copper technology | • | ||
| · Hydrogen anode furnace | • | ||
| Power systems | |||
| · Metallurgical motor system energy-saving control | • | • | • |
| · Permanent-magnet system for grinding mills | • | • | • |
| · Digital technology for pump energy efficiency | • | • | • |
| Resource recovery | |||
| · Molten-salt heat storage and exchange tech | • | • | • |
| · Gas-quenching copper slag heat recovery | • | • | • |
| · High-efficiency energy-saving technology for circulating water | • | ||
| Carbon capture and utilization | |||
| · CO2 mineralization for carbon-negative panel production | • | • | |
| Evaluation indicators | |||
| · CO2 mitigation intensity (tCO2-eq/tCu) | 1.43 | 1.08 | 0.77 |
| · Cost savings per ton of copper (CNY/tCu) | 1,182 | 830 | 590 |
| · Total cost per ton of copper (CNY/tCu) | 1,680 | 630 | 326 |
For Type I firms, the optimal technology package consists of 18 technologies, requiring an investment of approximately 1,680 CNY/tCu. This package achieves a mitigation intensity of 1.43 tCO2-eq/tCu and generates approximately 1,180 CNY/tCu in cumulative energy-saving and by-product-related benefits. The portfolio exhibits a whole-chain, multi-module synergistic mitigation structure. In the smelting stage, priority technologies include oxygen-enriched combustion, intelligent boiler control, gas-electric dual-drive systems for copper smelting, and electrolytic copper technology operating at a current density of 380 A/m2. Resource recovery is further strengthened through the deployment of molten-salt heat storage and exchange technology and gas-quenching copper slag heat recovery. On the power-system side, the package incorporates several energy-efficiency measures, including metallurgical motor system energy-saving control, permanent-magnet systems for grinding mills, digital pump energy efficiency technologies, and high-efficiency circulating-water energy-saving technologies. In the mining and beneficiation stage, additional measures include electric mining trucks, High-Pressure Grinding Rolls (HPGR), IsaMill, and
Under tighter budget constraints, Type II firms adopt a moderate-investment, highly cost-effective technology package, with an investment of approximately 630 CNY/tCu. This package delivers a mitigation intensity of 1.08 tCO2-eq/tCu and generates approximately 830 CNY/tCu in cumulative economic benefits. The portfolio is primarily driven by energy efficiency improvements and resource recovery. It centers on key technologies such as molten-salt heat storage and exchange, gas-quenching copper slag heat recovery, and oxygen-enriched combustion. To enhance cost-effectiveness while maintaining retrofit feasibility, selected auxiliary measures are incorporated, including permanent-magnet systems for grinding mills and intelligent boiler control technology. These measures ensure high emissions-reduction returns per unit of investment.
For Type III firms, capital constraints result in a technology package centered on resource recovery and complemented by energy-efficiency improvements. With an investment of 326 CNY/tCu, this package achieves a mitigation intensity of 0.77 tCO2-eq/tCu and generates approximately 590 CNY/tCu in cumulative economic benefits. In this case, molten-salt heat storage and exchange technology constitutes the primary mitigation pathway, supplemented by permanent-magnet systems for grinding mills, intelligent boiler control technology, and oxygen-enriched combustion technology. This configuration reflects a pragmatic strategy in which capital-constrained firms prioritize high-return technologies, while supplementing them with low-cost measures.
Analysis of optimal adoption pathways across firm types
Figure 3 shows the optimal technology diffusion pathways under combined constraints related to emissions reduction, cost, and economic benefits. Type I firms (accounting for approximately 50% of industry capacity) follow a “broad-coverage combination” pathway. Beginning in 2026, these firms prioritize the deployment of molten-salt heat storage and exchange technology, which accounts for approximately 30% of cumulative emissions reductions while requiring only about 10% of total investment. By around 2030, technologies such as gas-quenching copper slag heat recovery, electrolytic copper technology operating at a current density of 380 A/m2, high-efficiency circulating-water energy-saving technologies, and energy-efficiency optimization measures will diffuse rapidly and reach saturation. Together, these technologies contribute approximately 40% of cumulative emissions reductions while accounting for around 50% of cumulative costs. High-cost technologies are generally postponed until after 2040. By 2050, Type I firms are expected to achieve cumulative emissions reductions of approximately 117.0 Mt CO2-eq.
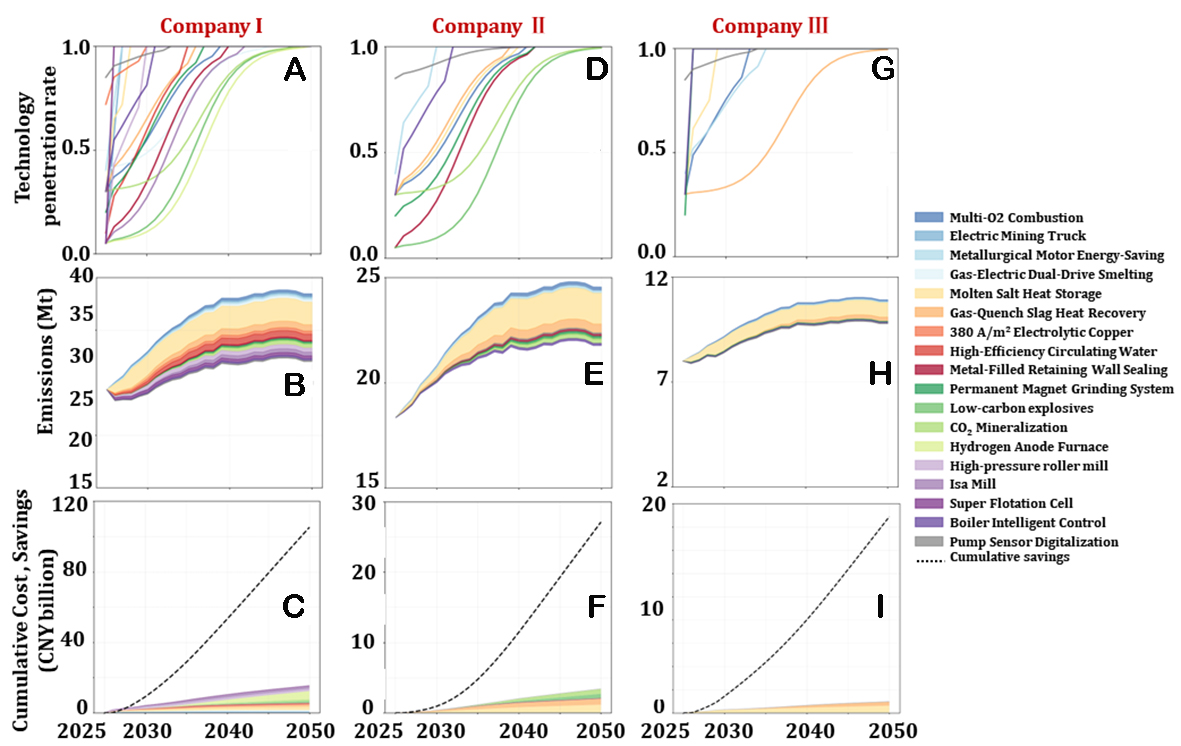
Figure 3. Optimal technology adoption pathways (A, D, G), emissions reduction potential (B, E, H), and cost and benefit (C, F, I) across three firm types.
Type II firms (accounting for approximately 34% of industry capacity) experience slower overall technology diffusion due to their relatively limited capital for technological upgrading. The fastest-diffusing technologies, such as motor- system energy-efficiency technologies and intelligent boiler control systems, reach saturation by around 2030. By contrast, most other technologies, including oxygen-enriched combustion, copper slag heat recovery, and molten-salt heat storage and exchange, gradually reach saturation around 2040. Consequently, this category achieves relatively limited reductions in emissions during the early stages of diffusion. However, its mitigation effect becomes increasingly significant after 2040 as technology adoption expands further. Overall, molten-salt heat storage and exchange technology and gas-quenching copper slag heat recovery contribute approximately 80% of cumulative emissions reductions while accounting for about 60% of cumulative costs, making them the dominant mitigation technologies for Type II firms. By 2050, Type II firms are expected to achieve cumulative emissions reductions of approximately 53.9 Mt CO2-eq.
Type III firms (accounting for approximately 16% of industry capacity) face more severe capital constraints and therefore follow a diffusion pathway centered primarily on heat recovery technologies, supplemented by incremental energy-efficiency improvements. Molten-salt heat storage and exchange technology dominates the overall mitigation effect and reaches saturation by around 2028. After 2030, technologies focused on combustion optimization and energy-efficiency improvement will gradually diffuse. Due to financial constraints, the adoption of copper slag heat recovery progresses slowly and does not reach saturation until 2050. Molten-salt heat storage and exchange technology contributes approximately 90% of cumulative emissions reductions while accounting for around 80% of cumulative costs. By 2050, Type III firms are expected to achieve cumulative emissions reductions of approximately 18.9 Mt CO2-eq.
However, uncertainty in the results primarily arises from two sources. First, uncertainty in enterprise-level investment data for technology retrofits may affect the robustness of technology pathway selection. Second, uncertainty in technical parameters may lead to variations in optimal technology pathways in terms of emissions-reduction potential, costs, and economic benefits. To address these issues, this study conducts sensitivity analyses of firms’ economic conditions [Supplementary Figures 4 and 5] and uncertainty analyses of technical parameters [Supplementary Figures 6 and 7].
Carbon emission reduction pathways in China’s copper industry
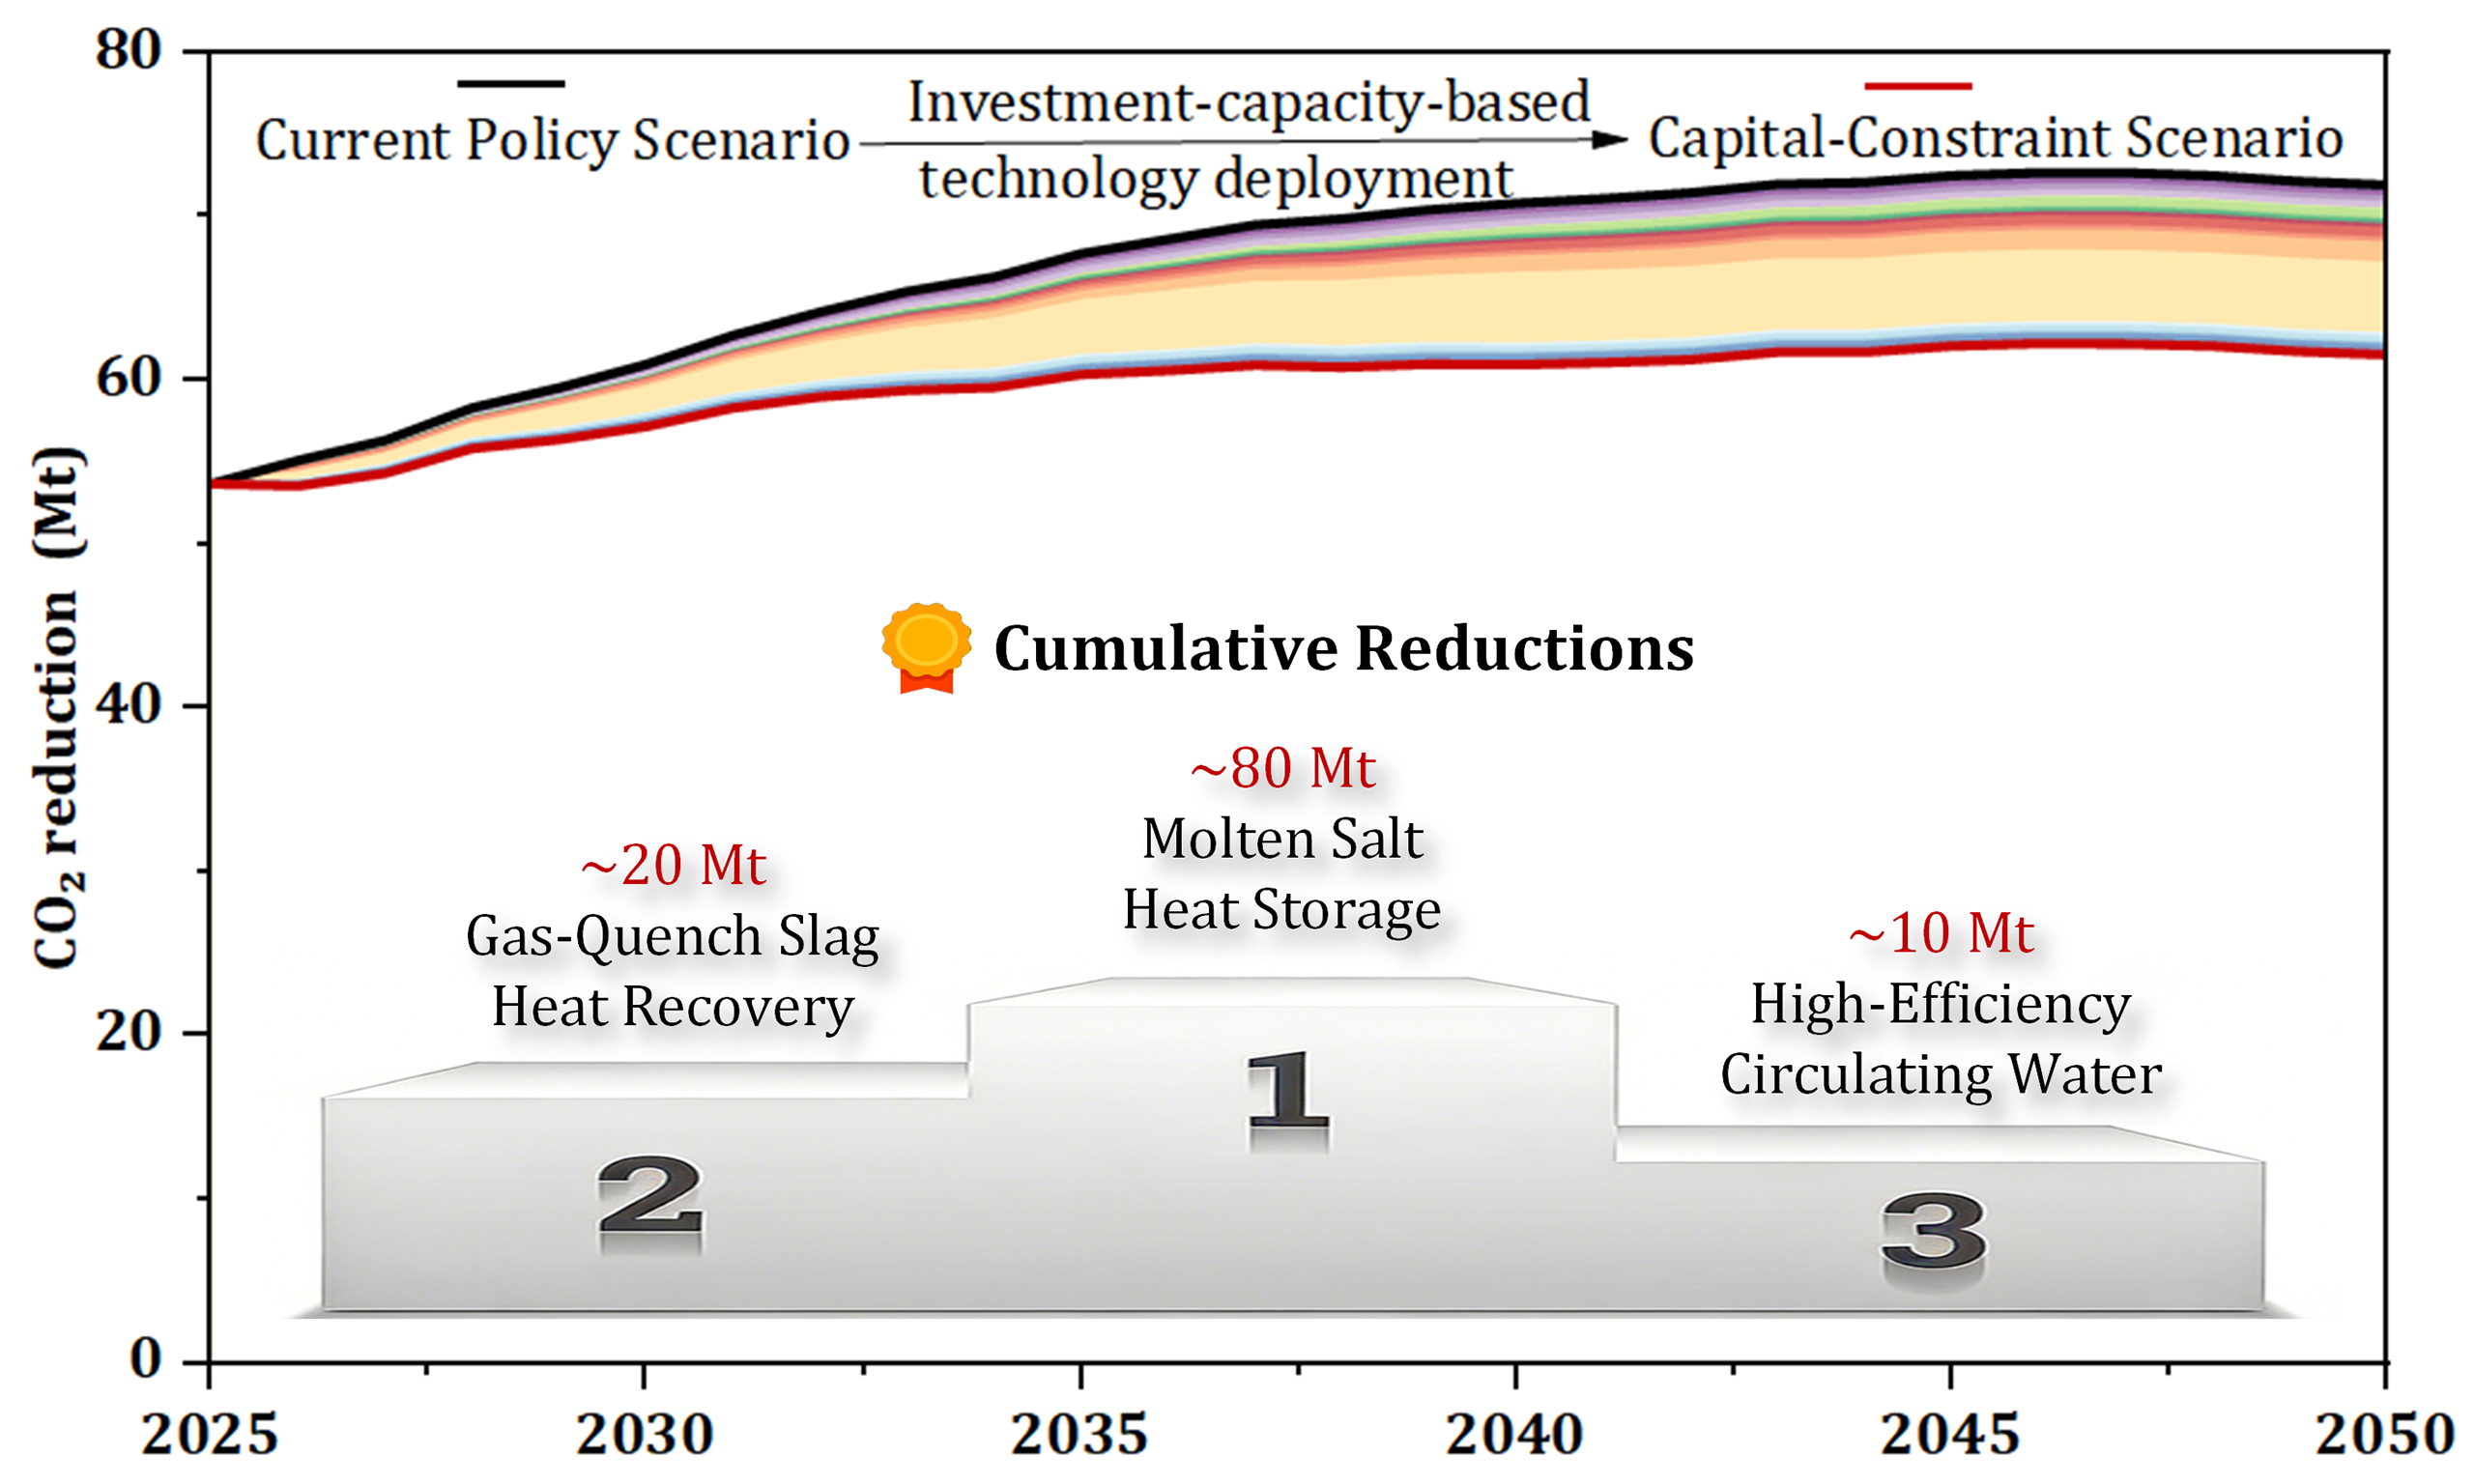
Figure 4 illustrates the carbon-emission trajectories of China’s copper industry under three scenarios from 2025 to 2050. Overall, all three trajectories exhibit an initial increase followed by gradual stabilization. Among the scenarios, carbon emissions are highest under the Current Policy Scenario, followed by the Capital-Constrained Scenario, whereas the Ideal Scenario achieves the lowest emissions levels.
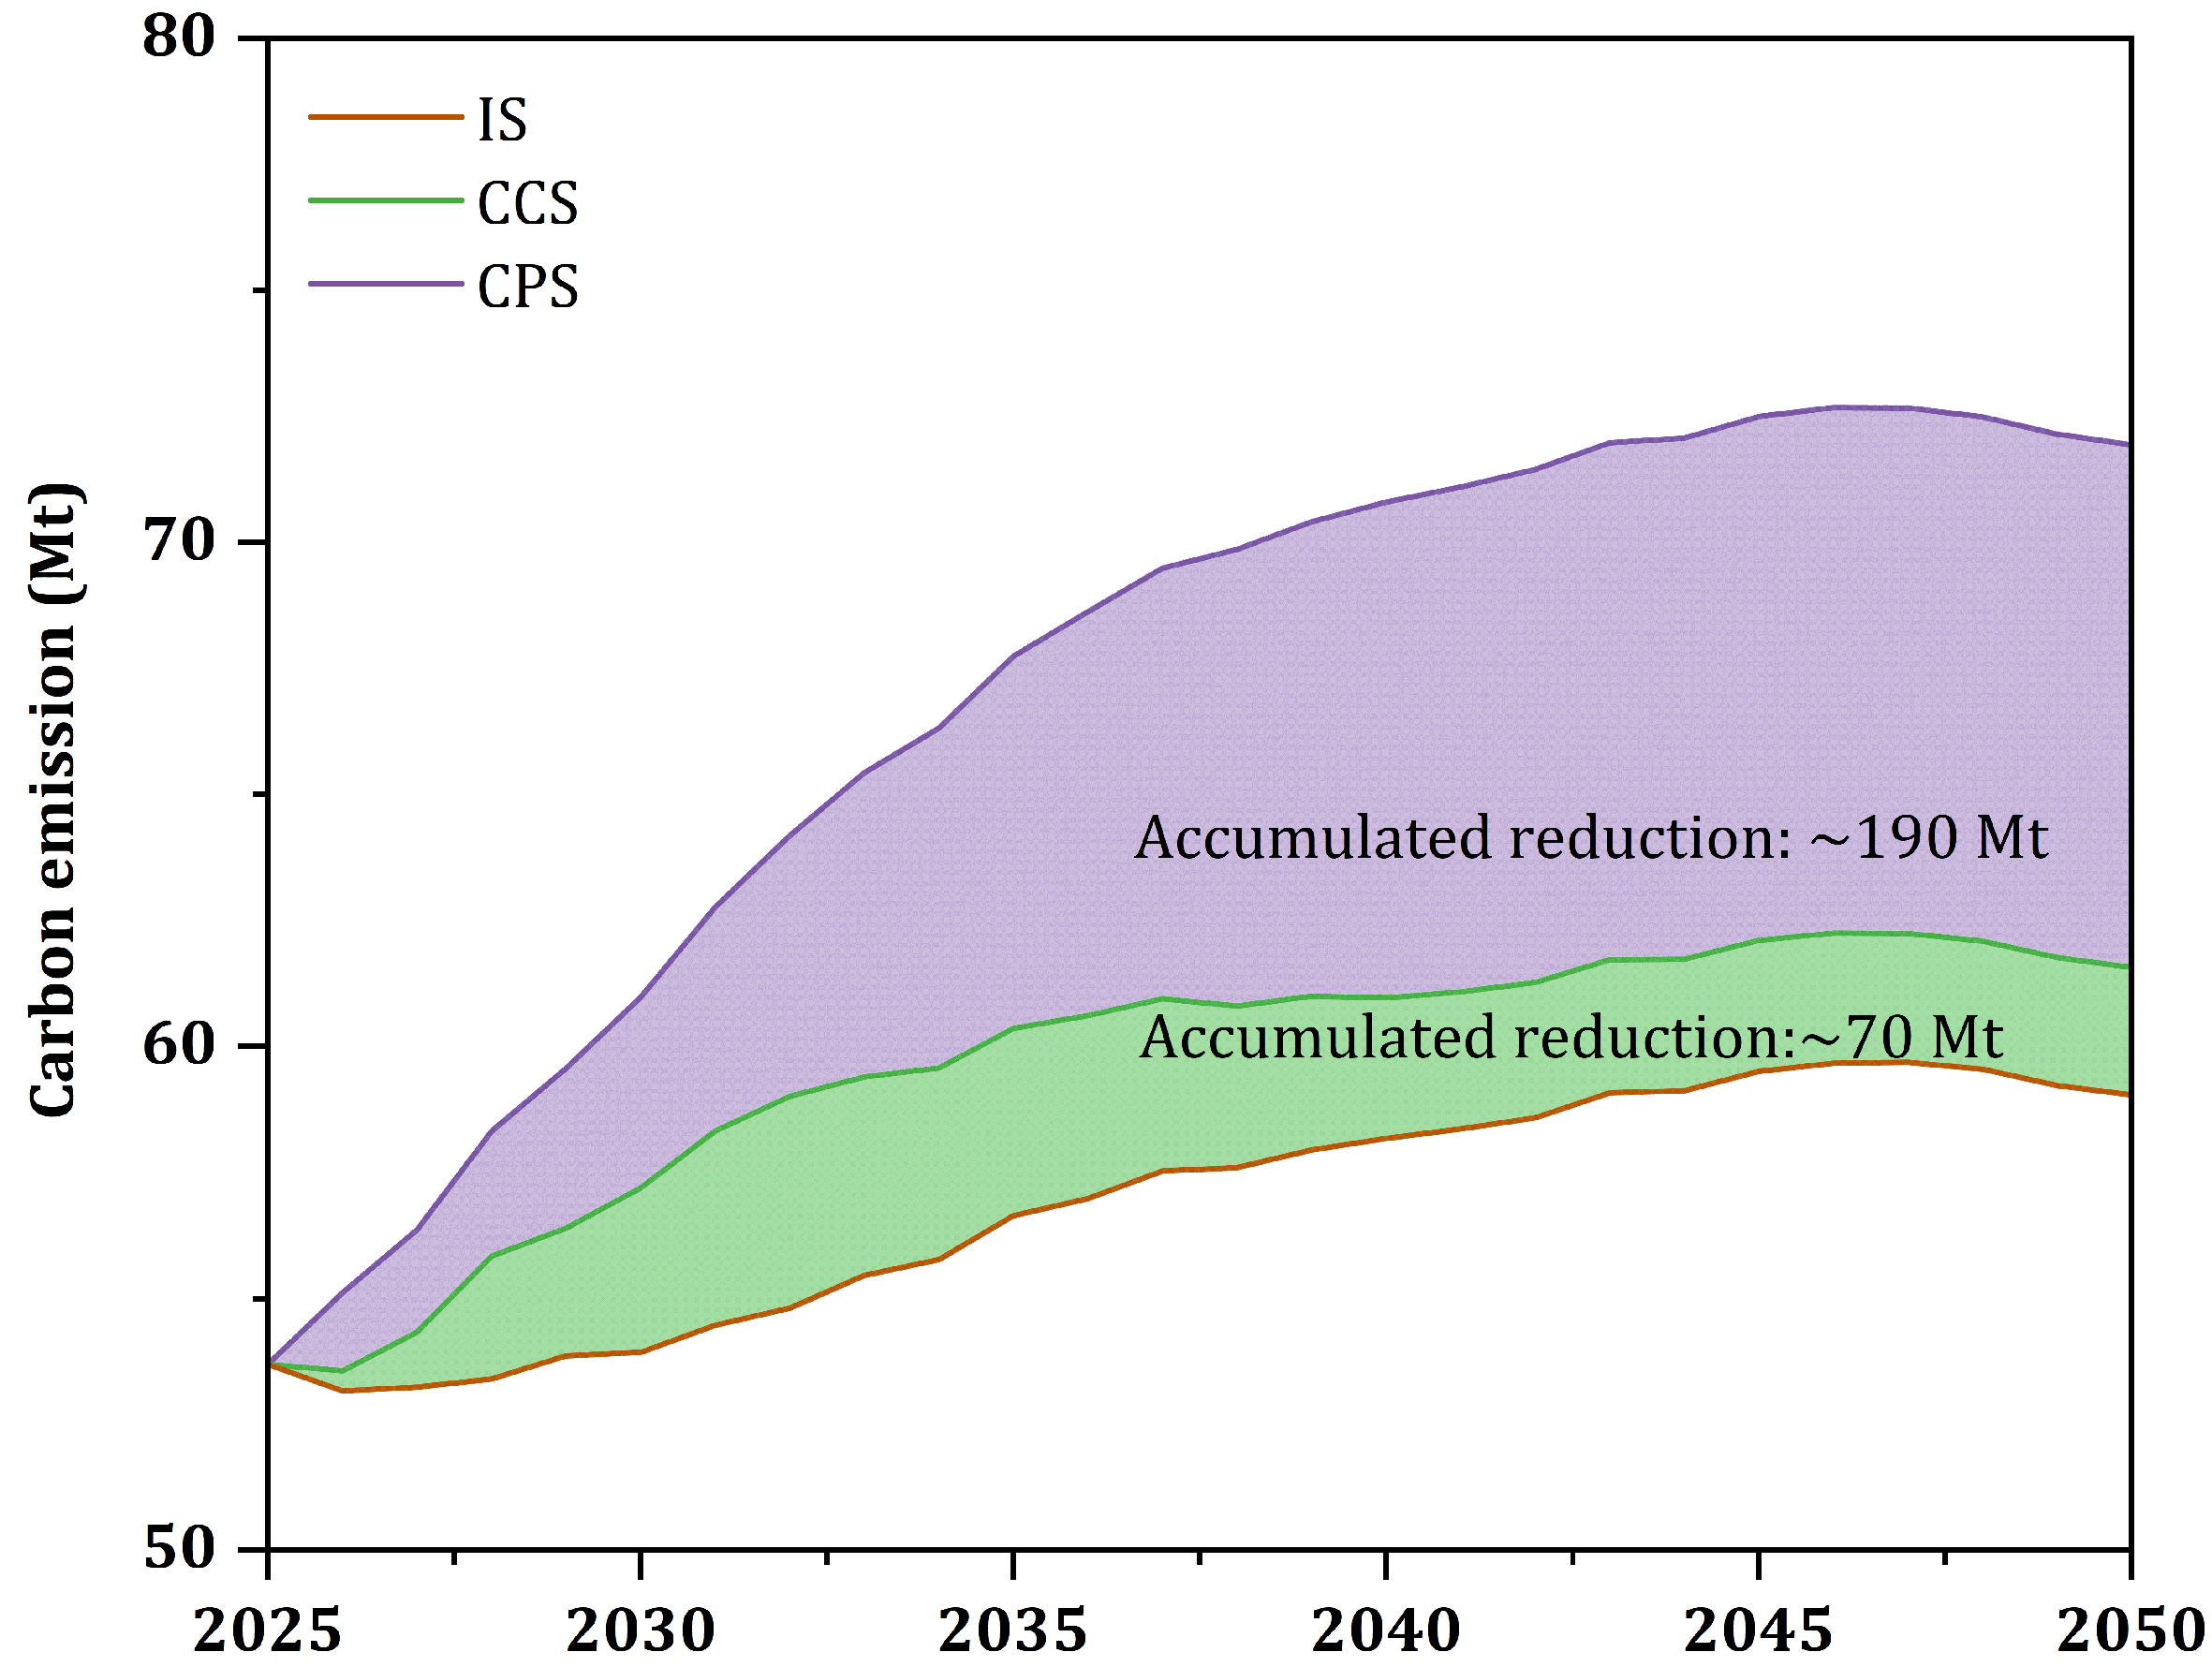
Figure 4. Carbon emissions of China’s copper industry from 2025 to 2050.
Between 2026 and 2050, the emissions gap between the Current Policy Scenario and the Capital-Constrained Scenario widens progressively. This trend mainly reflects the continued growth of primary copper output alongside the gradual emergence of mitigation effects from low-carbon technologies under the Capital-Constrained Scenario. As a result, cumulative emissions reductions under the Capital-Constrained Scenario are approximately 190 Mt CO2-eq greater than those under the Current Policy Scenario.
These results indicate that substantial emissions reductions could be achieved if China’s copper industry undergoes decarbonization under current economic conditions. However, the Capital-Constrained Scenario assumes that firms adopt low-carbon technologies to the maximum extent permitted by their financial capacity and therefore does not necessarily reflect actual implementation outcomes. This finding suggests that the principal barrier to emissions reductions in the industry is not technological availability but rather insufficient financial capacity, which constrains firms’ ability to deploy comprehensive and efficient low-carbon technology solutions in a timely manner.
Policy implications and limitations
Policy implications: This study examines how firms’ financial constraints shape the deployment of low-carbon technologies and their associated mitigation potential, offering insights into decarbonization strategies at both the firm and industry levels. The results indicate that firms’ investment capacity for technological upgrading significantly affects the industry’s overall emissions-reduction performance. This finding is consistent with the well-established concept of the energy-efficiency investment gap. Even when projects are theoretically profitable, financing barriers and risk aversion can delay or prevent investment decisions, leading to suboptimal adoption of cost-effective mitigation measures[19]. In response to these constraints, firms may shift decision-making from individual technologies to integrated technology packages, following a deployment strategy that prioritizes cash flow stability and phased implementation. Specifically, energy-efficiency measures with short payback periods and predictable returns can be deployed first, while the resulting operational savings can subsequently finance more capital-intensive deep retrofits. This self-financing portfolio strategy may represent a near-optimal approach for firms operating under both financial constraints and uncertainty[19].
At the policy level, a pronounced gap exists between the technical mitigation potential of low-carbon technologies and their deployable potential under real economic conditions. This gap underscores the critical importance of financial support mechanisms and institutional design in unlocking decarbonization potential in energy-intensive industries. Accordingly, effective climate strategies for heavy industrial sectors such as steel and non-ferrous metals cannot rely solely on uniform technical benchmarks or technology-neutral targets. Instead, they should prioritize policy mechanisms that alleviate firms’ financial constraints and accelerate the diffusion of low-carbon technologies across firms with different investment capacities.
Accordingly, governance frameworks should focus on reducing financing barriers and sharing investment risks. Policy instruments such as interest-subsidized loans, enhanced credit guarantees, and tax incentives linked to verified emissions-reduction performance can reduce upfront investment costs and mitigate information asymmetry, thereby accelerating the adoption of cost-effective low-carbon technologies[20]. On the market side, standardized arrangements such as energy performance contracting (EPC) and long-term power purchase agreements (PPAs) can help reduce firms’ upfront investment burdens and stabilize expectations regarding long-term returns[21,22]. Furthermore, for high-cost technologies such as CCUS, early-stage deployment risks should be jointly addressed through government-led demonstration projects and shared infrastructure development, thereby enabling risk-sharing during the initial phase[23].
Limitations: Although this study identifies the upper bound of technological mitigation potential under firm-level financial constraints, real-world technology deployment is shaped not only by economic factors but also by a range of multidimensional non-economic influences. For example, national policies and regulatory stringency, carbon pricing mechanisms, corporate strategies and risk preferences, market competition structures, and access to financing may all significantly influence technology diffusion pathways. Due to the scope and methodological limitations of this study, these non-economic factors are not explicitly modeled or quantitatively assessed. Future research could build upon this framework by incorporating key dimensions such as institutional environments, firm behavior, and market structure into an integrated analytical framework. Such efforts would provide a more comprehensive understanding of the real-world diffusion mechanisms of low-carbon technologies and their overall implications for emissions-reduction performance.
CONCLUSIONS
This study compiles 44 low-carbon technologies across the copper industry and classifies them into five categories: carbon capture, electric motors, mining, smelting, and waste heat recovery. For each technology, the emissions-reduction potential, deployment cost, and cost-saving benefits are systematically evaluated. The results reveal substantial heterogeneity in emissions-reduction potential and economic performance across technologies. Comparative evaluation indicates that waste heat recovery technologies constitute a key decarbonization pathway for the copper industry, particularly molten-salt heat storage and exchange technology, which demonstrates strong mitigation potential and favorable economic performance. These findings suggest that firms should adopt an integrated decision-making framework that jointly considers investment costs, emissions-reduction effectiveness, and economic returns to identify optimal technology configurations under specific decarbonization targets.
Building on this technology-level assessment, this study develops a Firm-level Budget-Constrained Decision (FBTD) model to identify optimal technology packages that jointly maximize emissions reductions and economic returns while satisfying financial constraints. The results show that Type I firms, benefiting from stronger financial capacity, can deploy up to 18 technologies within their investment constraints and contribute approximately 62% of cumulative emissions reductions during 2025-2050, thereby playing a dominant role in sectoral decarbonization. This finding reveals pronounced heterogeneity in mitigation contributions across firms and underscores the pivotal role of capital-intensive enterprises in scaling up low-carbon technologies. Enabling these firms to serve as anchors for technology diffusion and system-wide decarbonization is therefore critical to accelerating China’s copper industry transition.
Extending the analysis to the industry level, this study further constructs a Capital-Constrained Scenario (CCS) by integrating the optimal technology pathways of the three firm types. The results indicate that cumulative emissions reductions under the CCS could reach approximately 190 Mt CO2-eq by 2050. By comparison, the IS could achieve an additional 70 Mt CO2-eq in cumulative emissions reductions. This gap highlights that financial constraints constitute a major barrier to deeper decarbonization. Therefore, achieving more ambitious emissions-reduction targets will require targeted policy support and innovative financing mechanisms for Type II and Type III firms to alleviate financial constraints and strengthen their technological deployment capacity.
From a methodological perspective, the FBTD model serves as a general analytical framework for the optimal selection of low-carbon technologies under enterprise budget constraints, with its core focus on technology-adoption decision-making under financial constraints. Accordingly, the model demonstrates strong methodological generalizability and is not restricted to the copper industry. It can therefore be extended to support deployment of low-carbon technologies in other energy-intensive sectors, such as the steel and aluminum industries. However, when applying the model to other sectors, the input parameters should be appropriately adjusted to reflect industry-specific characteristics and operational conditions.
DECLARATIONS
Authors’ contributions
Writing - original draft, methodology, visualization: Lv, Y.; Liu, M.
Conceptualization, writing - review and editing: Wang, Q. C.
Review and supervision, writing - review and editing: Liu, Y.
Data collection: Wang, P.
Review and supervision, writing - review and editing: Chen, W. Q.
Availability of data and materials
Data and Supplementary Materials are available from the corresponding authors upon reasonable request.
AI and AI-assisted tools statement
Not applicable.
Financial support and sponsorship
This work was funded by Foreign Cooperation Project of Fujian Provincial Science and Technology Department (No. 2026I0047), Strategic Priority Research Program of the Chinese Academy of Sciences (No. XDB1380300), National Natural Science Foundation of China (Nos. 72525006 and 42271298), and National Key Research and Development Program of China (No. 2024YFE0208700).
Conflicts of interest
Chen, W. Q. is the Guest Editor of the Special Topic "Material-Energy-Resource Circularity and Carbon/Resource Footprints in Urban-Industrial Systems" in the Carbon Footprints. He had no involvement in the review or editorial process of this manuscript, including but not limited to reviewer selection, evaluation, or the final decision, while the other authors have declared that they have no conflicts of interest.
Ethical approval and consent to participate
Not applicable.
Consent for publication
Not applicable.
Copyright
© The Author(s) 2026.
Supplementary Materials
REFERENCES
1. Li, B.; Wang, L.; Zhang, L.; Wu, H.; Yuan, Z. Navigating copper demand-supply dynamics for China's energy transition: pathways to sustainable supply. Energy 2025, 330, 136913.
2. Gu, Y.; Yang, H.; Wu, Y.; et al. Regulation mechanism for designing decarbonization pathways in the copper industry toward carbon neutrality. Environ. Sci. Technol. 2023, 58, 1518-30.
3. Hao, J.; Dou, Z.; Zhang, T.; Wang, K. A review of comprehensive utilization of copper slag of China. In: Lazou A, Daehn K, Fleuriault C, Gökelma M, Olivetti E, Meskers C, editors. REWAS 2022: developing tomorrow’s technical cycles. Cham: Springer International Publishing; 2022. pp. 355-65.
4. Kulczycka, J.; Lelek, Ł.; Lewandowska, A.; Wirth, H.; Bergesen, J. D. Environmental impacts of energy‐efficient pyrometallurgical copper smelting technologies: the consequences of technological changes from 2010 to 2050. J. Ind. Ecol. 2015, 20, 304-16.
5. Maghsoudizadeh, M.; Ameri, M.; Jahanshahi Javaran, E. Performance enhancement of the flash furnaces in copper industries via 4E analysis using hydrogen–natural gas blended fuel and oxygen-enriched air. J. Clean. Prod. 2025, 525, 146556.
6. Wang, C.; Ma, M.; Li, Y.; Deng, J.; Fang, H. Optimization and feasibility analysis of waste heat recovery procedures in copper plant based on the collaborative analysis of T-Q-C diagram. Energy 2025, 326, 136330.
7. Hao, J.; Dou, Z.; Zhang, T.; Wan, X.; Wang, K. Energy conservation and emission reduction through utilization of latent heat of copper slag for iron and copper recovery. J. Clean. Prod. 2024, 436, 140602.
8. Klaffenbach, E.; Montenegro, V.; Guo, M.; Blanpain, B. Sustainable and comprehensive utilization of copper slag: a review and critical analysis. J. Sustain. Metall. 2023, 9, 468-96.
9. Zhou, H.; Basarir, H.; Poulet, T.; Li, W.; Kleiv, R. A.; Karrech, A. Life cycle assessment of recycling copper slags as cement replacement material in mine backfill. Resour. Conserv. Recycl. 2024, 205, 107591.
10. Wu, Y.; Zeng, S.; Cai, J.; Zhong, Z. A study on the potential and cost of carbon reduction from low carbon technologies in the Chinese copper industry. Adv. Manag. Appl. Econ. 2024, 15, 109-29.
11. Gao, R.; Shi, Y.; Cao, C.; et al. Assessment of carbon emissions and reduction potential in China's copper smelting industry. J. Ind. Ecol. 2024, 28, 1626-40.
12. Lu, T.; Tikana, L.; Herrmann, C.; Ma, Y.; Jia, J. Environmental hotspot analysis of primary copper production in China and its future improvement potentials. J. Clean. Prod. 2022, 370, 133458.
13. Shahraki, H.; Einollahipeer, F.; Abyar, H.; Erfani, M. Assessing the environmental impacts of copper cathode production based on life cycle assessment. Integr. Environ. Assess. Manag. 2024, 20, 1180-90.
14. Giurco, D.; Petrie, J. Strategies for reducing the carbon footprint of copper: new technologies, more recycling or demand management? Miner. Eng. 2007, 20, 842-53.
15. Zhang, X.; Wang, H.; Ma, H. Paths and methods for achieving carbon peaking and carbon neutrality in the copper industry. Min. Metall. 2024, 33, 456-65. Available from: http://ky.bgrimm.cn/ysjsky/ch/reader/view_abstract.aspx?file_no=20240207001&flag=1 [Last accessed on 20 May 2026].
16. Nemet, G.; Greene, J.; Müller-Hansen, F.; Minx, J. C. Dataset on the adoption of historical technologies informs the scale-up of emerging carbon dioxide removal measures. Commun. Earth. Environ. 2023, 4, 397.
17. Dung, H. T.; Do, D. T.; Nguyen, V. T. Comparison of multi-criteria decision making methods using the same data standardization method. J. Mechan. Eng. 2022, 72, 57-72.
18. Dong, D.; Tukker, A.; Steubing, B.; et al. Assessing China’s potential for reducing primary copper demand and associated environmental impacts in the context of energy transition and “Zero waste” policies. Waste. Manag. 2022, 144, 454-67.
19. Bremer, L.; Den Nijs, S.; De Groot, H. L. The energy efficiency gap and barriers to investments: Evidence from a firm survey in The Netherlands. Energy. Econ. 2024, 133, 107498.
20. Jin, X.; Qi, H.; Huang, X. Green financial regulation and corporate strategic ESG behavior: evidence from China. Financ. Res. Lett. 2024, 65, 105581.
21. Cebekhulu, B. M.; Mathaba, T. N.; Mbohwa, C. Identifying trends and research gaps in ESCO research: a systematic literature review. Energy. Strategy. Rev. 2024, 55, 101516.
22. Mittler, C.; Bucksteeg, M.; Staudt, P. Review and morphological analysis of renewable power purchasing agreement types. Renew. Sustain. Energy. Rev. 2025, 211, 115293.
Cite This Article
How to Cite
Download Citation
Export Citation File:
Type of Import
Tips on Downloading Citation
Citation Manager File Format
Type of Import
Direct Import: When the Direct Import option is selected (the default state), a dialogue box will give you the option to Save or Open the downloaded citation data. Choosing Open will either launch your citation manager or give you a choice of applications with which to use the metadata. The Save option saves the file locally for later use.
Indirect Import: When the Indirect Import option is selected, the metadata is displayed and may be copied and pasted as needed.
About This Article
Special Topic
Copyright

Data & Comments
Data
0


Comments
Comments must be written in English. Spam, offensive content, impersonation, and private information will not be permitted. If any comment is reported and identified as inappropriate content by OAE staff, the comment will be removed without notice. If you have any queries or need any help, please contact us at support@oaepublish.com.