



A goal programming approach for balancing life-cycle carbon burden and lean value in Industry 4.0 portfolio selection
 0

Abstract
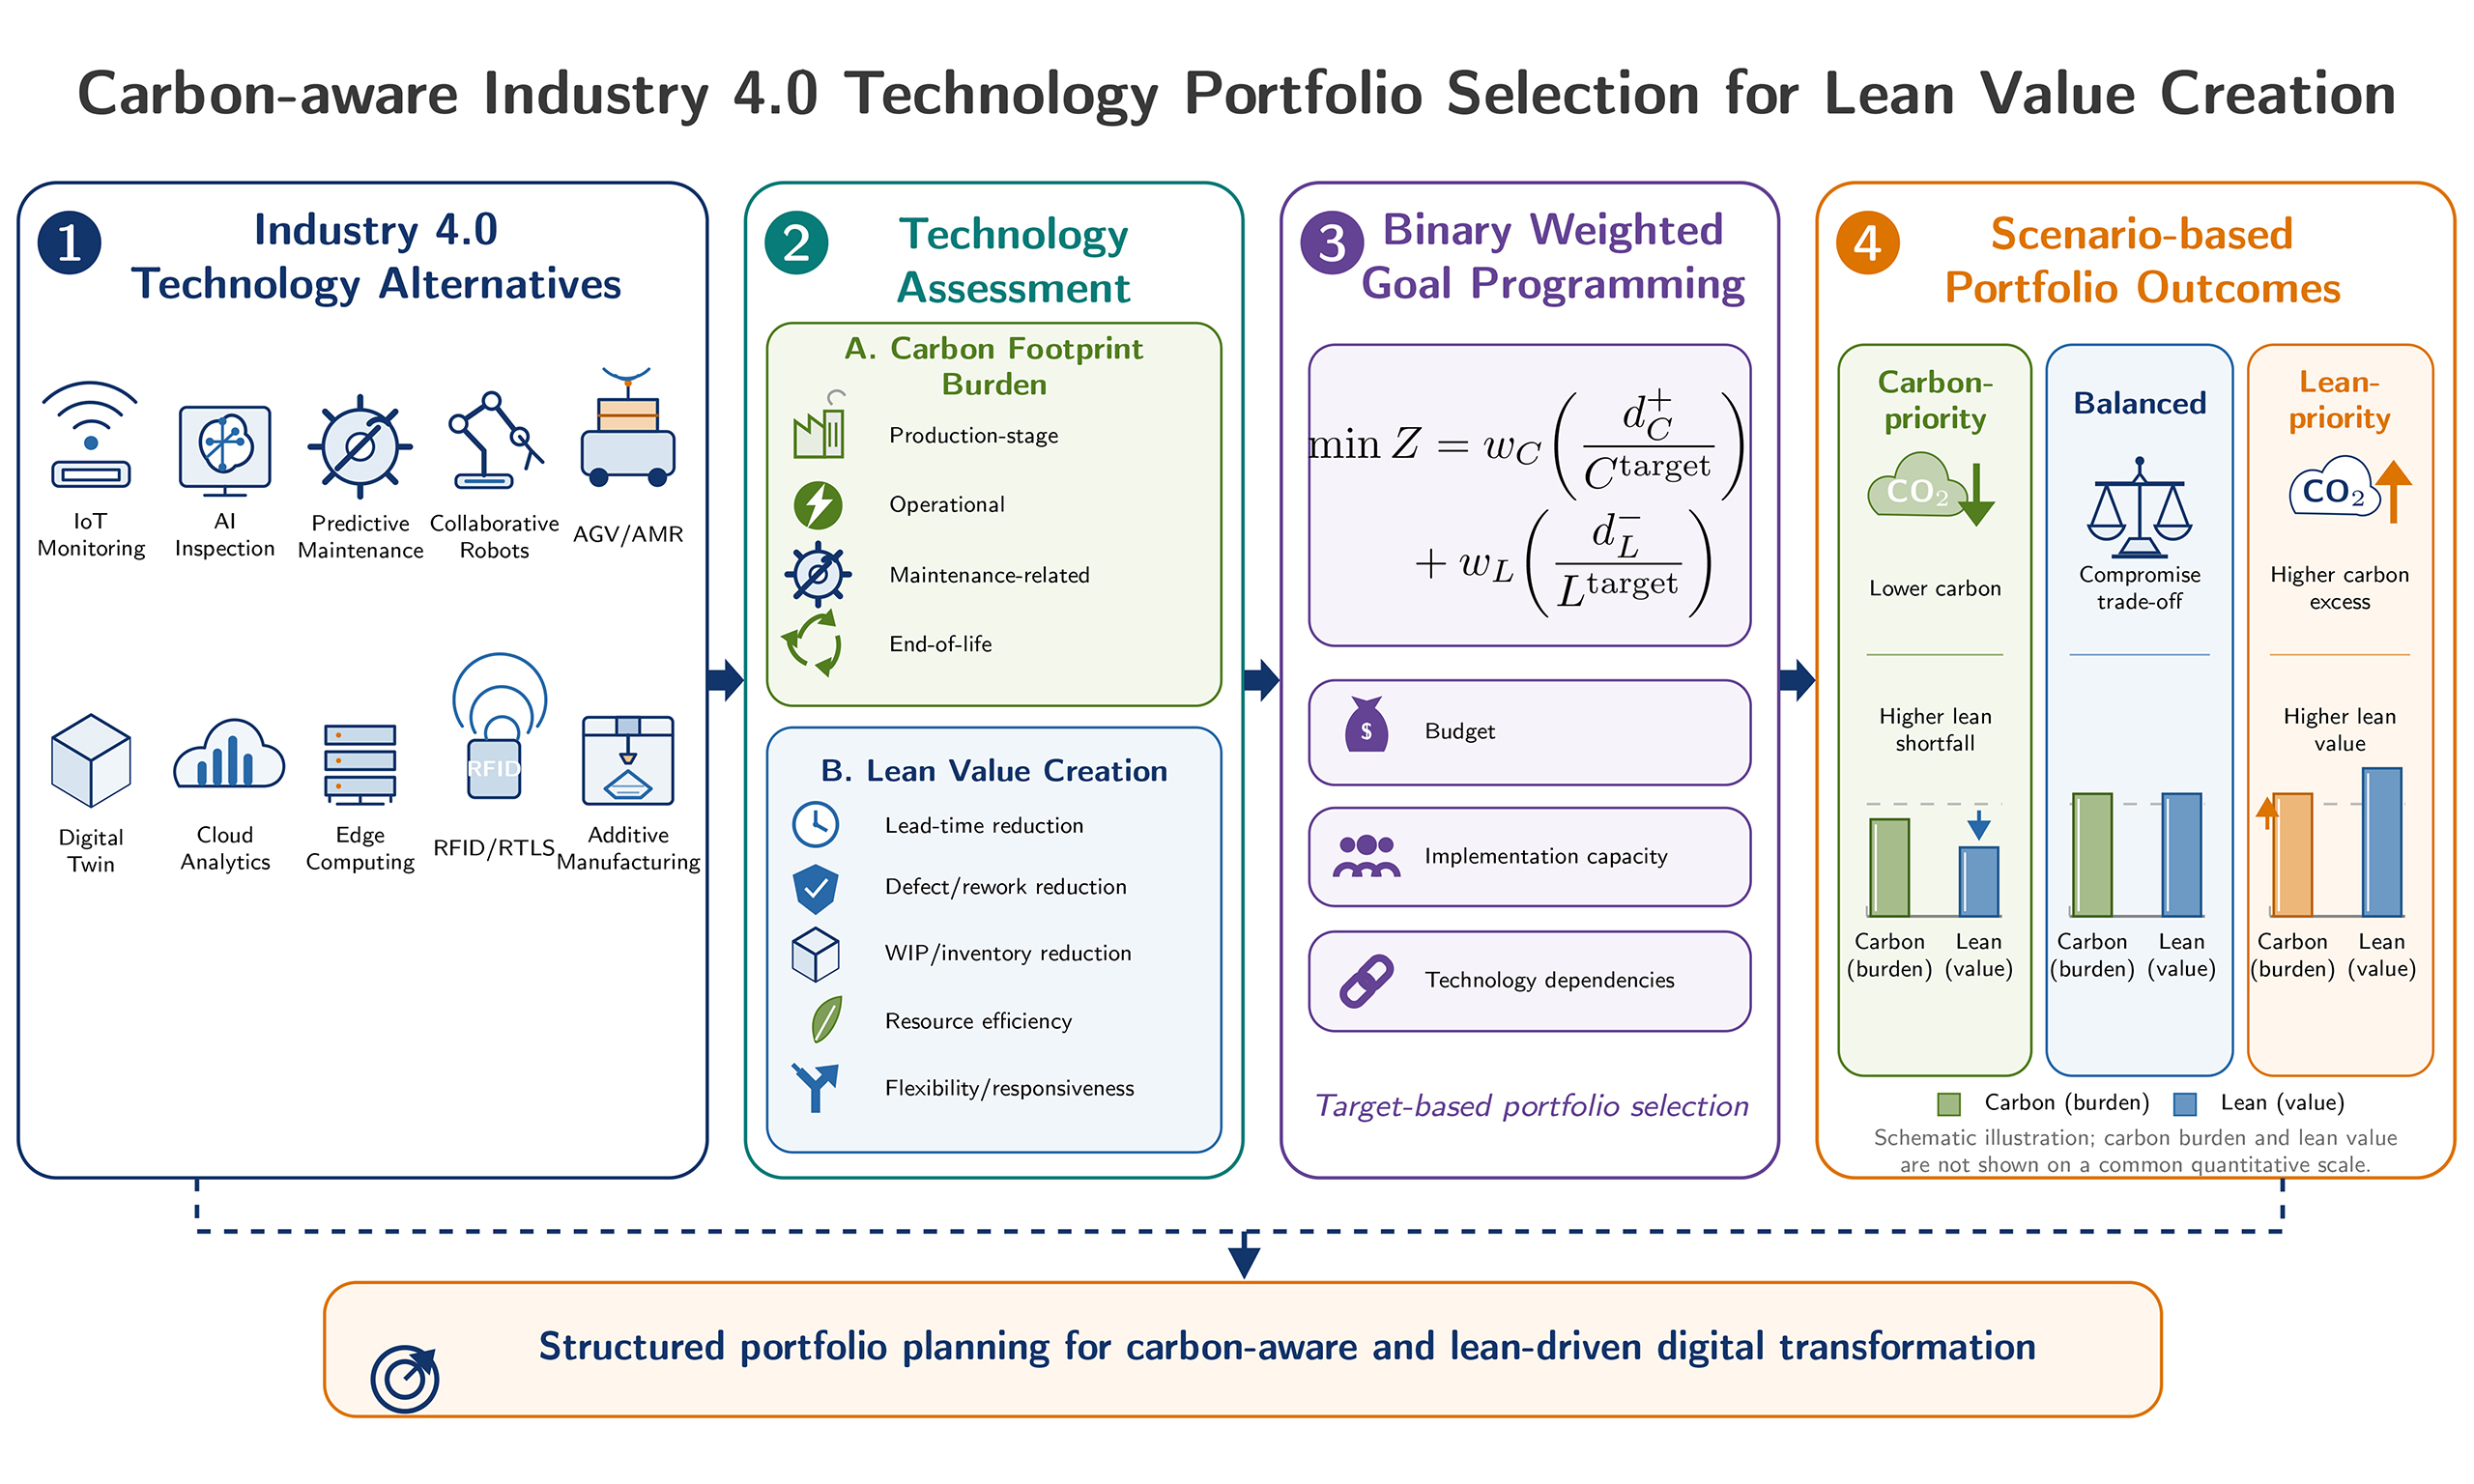
The rapid diffusion of Industry 4.0 technologies creates a dual decision challenge for firms: these technologies can support lean-oriented value creation while also increasing the carbon footprint associated with hardware, energy use, data processing, maintenance, and digital infrastructure. This study develops a multi-objective framework for selecting an Industry 4.0 technology portfolio that balances lean value creation against carbon control. A binary weighted goal programming model minimizes normalized deviations from predefined carbon and lean value targets while considering technology-attributable, life-cycle-oriented carbon burden, investment cost, implementation difficulty, multidimensional lean value contribution, and technology dependencies. The carbon boundary covers production, operation, maintenance, and end-of-life burdens attributable to the technologies themselves; technology-enabled avoided emissions are not credited. Unlike ranking-oriented multi-criteria decision-making approaches, the framework constructs feasible technology portfolios under explicit target, resource, and dependency constraints. An illustrative numerical application evaluates carbon-priority, balanced, and lean-priority strategies, revealing distinct trade-offs between carbon excess and lean value shortfall. Sensitivity and robustness analyses further examine the effects of managerial settings and parameter uncertainty on portfolio selection. By integrating environmental and lean objectives within a single optimization framework, the study contributes to sustainable and lean operations research and provides a structured decision-support tool for carbon-aware and lean-oriented Industry 4.0 investment planning.
Keywords
INTRODUCTION
The emergence of Industry 4.0 has fundamentally transformed production and service systems through the integration of advanced technologies such as artificial intelligence (AI), robotics, cloud computing, and cyber-physical systems[1-3]. These technologies enable firms to achieve higher productivity, flexibility, and value creation[4]. At the same time, their adoption may introduce additional environmental burdens through hardware production, electricity consumption, data processing, maintenance, and supporting digital infrastructure[5,6]. Recent studies therefore point to a dual effect: digital technologies may support energy efficiency, waste reduction, predictive maintenance, and other operational improvements, while these operational benefits may be accompanied by technology-attributable life-cycle carbon burdens[7-11].
This tension is particularly relevant when firms must decide which Industry 4.0 technologies to adopt under limited financial and organizational resources. Existing studies frequently address this decision through multi-criteria decision-making (MCDM) approaches that assess or rank alternative technologies according to economic, technical, organizational, and sustainability criteria[12-15]. Such approaches provide valuable prioritization support, but they do not generally formulate the decision as a resource-constrained portfolio problem in which combinations of technologies are selected jointly under explicit aspiration levels and technology dependencies. Moreover, environmental considerations are often represented as broad sustainability criteria rather than as the technology-attributable carbon burden associated with the selected portfolio[16]. This leaves a need for a prescriptive framework that integrates operational value creation and carbon considerations at the portfolio level.
Lean value creation provides an appropriate operational perspective for this decision because Industry 4.0 technologies can support improvements in lead time, quality, work-in-process and inventory, resource efficiency, flexibility, and responsiveness[17-19]. These improvements, however, should not automatically be interpreted as measured carbon reductions, since the technologies that enable them may themselves require energy-intensive computing, digital infrastructure, and hardware resources[20,21]. The resulting decision problem therefore involves balancing lean-oriented value creation against technology-attributable carbon burden while also respecting investment, implementation-capacity, and technological-dependency conditions.
Goal programming (GP) is well suited to such a target-based decision setting because it minimizes deviations from decision-maker-specified aspiration levels for competing objectives[22,23]. GP itself is an established methodology and has been applied to project and portfolio decisions as well as low-carbon and sustainable operations problems[24-27]. The contribution of this study is integrative and problem-oriented rather than methodological: it formulates a binary weighted GP framework that brings together technology-attributable, life-cycle-oriented carbon burden, multidimensional lean value, investment budget, implementation capacity, and technology dependencies within a single Industry 4.0 portfolio-selection problem.
The contributions of the study are threefold. First, it moves beyond technology ranking by formulating Industry 4.0 adoption as a constrained portfolio-selection problem in which feasible technology combinations are determined under budget, implementation-capacity, and dependency conditions. Second, it integrates technology-attributable carbon burden and multidimensional lean value within a normalized target-based optimization structure, making the carbon–lean trade-off explicit without interpreting operational efficiency gains as measured carbon reductions. Third, it provides a scenario, sensitivity, and robustness framework for examining how managerial preferences, carbon targets, resource availability, parameter uncertainty, and dependency assumptions affect portfolio selection, while exact weight-breakpoint and Pareto-efficiency analyses clarify how preference changes translate into alternative optimal portfolios in the illustrative application. The resulting framework is intended as a decision-support structure that can be populated with firm-specific data rather than as evidence that particular Industry 4.0 technologies are universally preferable.
The remainder of this paper is organized as follows. Section “Conceptual framework and literature review” develops the conceptual foundation and positions the study within the literature on lean value creation, technology-attributable carbon burden, and portfolio decision-making. Section “Proposed GP model formulation” presents the binary weighted GP formulation. Section “Numerical application” reports the numerical application, sensitivity analysis, robustness analysis, and efficiency validation. Section “Managerial implications” discusses the managerial implications and practical implementation of the framework. Section “Conclusion” concludes the study and outlines directions for future research.
CONCEPTUAL FRAMEWORK AND LITERATURE REVIEW
This section develops the conceptual basis of the study through three complementary perspectives: lean-oriented value creation, the carbon footprint implications of Industry 4.0 technologies, and the trade-off structure underlying portfolio selection.
Value concept within the lens of lean manufacturing
Within lean manufacturing, value is defined primarily from the customer perspective and is created by meeting customer requirements while minimizing non-value-adding activities and unnecessary resource consumption. Lean thinking therefore emphasizes systematically reducing waste, variability, and overburden across production processes.
Industry 4.0 technologies can complement these principles by improving process visibility, responsiveness, data availability, and operational integration[28-30]. Real-time monitoring, analytics, automation, and digitally enabled coordination can support reductions in variability, downtime, defects, lead times, and inventory while improving resource utilization and flexibility.
Accordingly, lean value is treated in this study as a multidimensional construct rather than a single financial measure[31]. Five performance dimensions are considered: (i) lead-time reduction; (ii) defect and rework reduction; (iii) work-in-process and inventory reduction; (iv) resource efficiency improvement; and (v) flexibility and responsiveness. These dimensions provide the operational basis for the lean value representation used in the proposed model.
Carbon footprint implications of Industry 4.0 technologies
Industry 4.0 technologies can generate carbon burdens across several stages of their life cycle, including hardware production, operation, maintenance, and end-of-life treatment[9,10,32]. A life-cycle perspective is therefore important because restricting assessment to operational energy use alone may overlook material- and equipment-related impacts occurring before and after deployment[33].
Operational carbon is particularly relevant for data-intensive technologies. AI, cloud computing, digital twins, and related applications may require substantial computing, storage, communication, and supporting infrastructure[20]. Recent carbon-aware optimization studies illustrate this issue in digital infrastructure. Hanafy et al. examine carbon–cost–performance trade-offs in cloud workload scheduling[34], Cao et al. incorporate computing and physical-infrastructure emissions into adaptive data-center capacity provisioning[35], and Zhao et al. jointly optimize energy cost and carbon footprint in cloud data centers[36]. These studies show that the carbon burden associated with digital technologies depends not only on operation but also on the supporting infrastructure required for deployment and use.
Production-stage carbon is also relevant because sensors, edge devices, robotics, mobile platforms, and semiconductor-based equipment require materials, component manufacturing, assembly, and associated supply-chain activities[37,38]. Maintenance, replacement, and end-of-life treatment can add further burdens over the technology’s service period, particularly for electronic components and batteries.
At the same time, Industry 4.0 technologies may enable indirect carbon reductions through improved energy efficiency, waste prevention, predictive maintenance, and process optimization. Such avoided emissions, however, depend on plant-specific baselines, operating conditions, and interactions among technologies and cannot be inferred directly from the technology itself. The present study therefore distinguishes between potential technology-enabled reductions and the technology-attributable carbon burden associated with adopting and operating the technologies. The latter defines the carbon-side decision boundary used in the portfolio model, while technology-enabled operational improvements are represented through the lean value dimension.
Trade-off structure, GP, and research positioning
Taken together, the preceding discussion indicates that Industry 4.0 investment decisions involve a portfolio-level trade-off between operational value creation and the carbon burden associated with technology adoption. Technologies that improve process visibility, quality, flexibility, resource utilization, and responsiveness may simultaneously require additional hardware, computing, communication, and energy resources[6,7,10]. Technology selection should therefore account for both operational benefits and environmental burden rather than treating either dimension in isolation.
GP provides an appropriate structure for this type of decision when managers can specify aspiration levels for competing objectives. Instead of optimizing a single criterion, GP minimizes deviations from predefined targets and can therefore represent situations in which carbon control and operational improvement are pursued simultaneously. Previous applications have used GP in sustainable and low-carbon supply-chain planning, project and portfolio decisions, and lean production system implementation[22,23,26,39-41]. These studies establish GP as a well-established multi-objective decision method; accordingly, the contribution of the present study does not arise from introducing a new GP technique.
The contribution of the present study instead concerns the integration of several features within Industry 4.0 portfolio planning. Candidate technologies differ in their technology-attributable carbon burden, lean value contribution, investment requirement, implementation difficulty, and dependence on enabling infrastructure[20,21,38]. Existing Industry 4.0 studies provide important approaches for technology assessment and selection, while related optimization studies address environmental technology portfolios or lean-oriented objectives. To clarify the position of the present framework relative to these streams, Table 1 compares six closely related studies using the decision features directly relevant to the proposed model.
Comparison of related studies and the present framework
| Study1234567 | Main decision approach | Portfolio optimization | Technology-attributable carbon burden | Lean-oriented value | Implementation-capacity constraint | Technology dependencies/prerequisites |
| Almeida et al.[12] | MCDM investment appraisal | - | - | - | - | △ |
| Maretto et al.[15] | Fuzzy AHP technology selection | △ | - | - | - | - |
| de Mendonça Santos et al.[16] | Fuzzy-DEMATEL prioritization | - | - | - | - | △ |
| Kellner et al.[42] | Multi-objective portfolio optimization | √ | △ | - | - | - |
| Bonello et al.[11] | LCA-based multi-objective optimization | √ | △ | - | - | - |
| Karakutuk and Ornek[23] | GP | - | - | √ | - | - |
| Present study | Binary weighted GP | √ | √ | √ | √ | √ |
The comparison shows that these studies address complementary parts of the present decision problem. Almeida et al. provide a multidimensional framework for Industry 4.0 investment appraisal and explicitly recognize technology prerequisites, but do not formulate them as portfolio constraints[12]. Maretto et al. extend technology selection to groups of related digital technologies[15], whereas de Mendonça Santos et al. prioritize sustainability functions supported by Industry 4.0 technologies rather than optimizing technology portfolios[16]. Kellner et al. optimize powertrain technology portfolios under greenhouse gas (GHG) considerations[42], while Bonello et al. combine life-cycle environmental assessment with multi-objective optimization of technology combinations[11]. Karakutuk and Ornek, in turn, demonstrate the use of GP for lean-oriented production objectives[23].
Among the related studies examined in Table 1, none simultaneously represents portfolio selection, technology-attributable carbon burden, lean-oriented value, implementation capacity, and technology prerequisites within the same prescriptive decision model. The contribution of the present study is therefore integrative and problem-oriented rather than a methodological extension of GP. The framework brings these decision dimensions together in a binary weighted GP formulation that identifies feasible Industry 4.0 portfolios under carbon and lean aspiration levels, resource limitations, and technology-dependency conditions.
PROPOSED GP MODEL FORMULATION
Problem definition
The decision problem addressed in this study concerns the selection of an Industry 4.0 technology portfolio that simultaneously supports lean-oriented value creation and controls the technology-attributable carbon burden associated with emerging digital and automation technologies. A firm is assumed to evaluate a finite set of candidate technologies, each of which requires a given investment cost, consumes a certain implementation capacity, contributes to lean value creation, and generates a technology-attributable, life-cycle-oriented carbon burden. The central managerial question is therefore not only which technologies provide higher operational value, but also which combination of technologies can be adopted without creating an excessive carbon burden.
The problem has an inherently multi-objective structure. On the one hand, the firm seeks to minimize the total carbon burden of the selected technologies. On the other hand, it aims to maximize lean-oriented value creation through improvements in lead time, quality, inventory, resource efficiency, and operational flexibility. In its basic form, the decision structure can be expressed as follows:
subject to budgetary, implementation-capacity, technology-dependency, and binary selection constraints. These two objectives may conflict with each other. A portfolio that generates higher lean value may require additional hardware, more energy-intensive digital infrastructure, or greater computational capacity, whereas a lower-carbon portfolio may fail to achieve the desired level of lean transformation. Because the two criteria are measured in different units and reflect different managerial priorities, optimizing either objective in isolation would provide an incomplete basis for strategic technology selection.
To reconcile these competing priorities, the proposed framework adopts a GP approach. In the proposed model, carbon burden and lean value are treated as target-based goal dimensions: exceeding the carbon target and falling short of the lean value target are the undesirable deviations to be minimized. The model therefore seeks a technology portfolio that minimizes the weighted and normalized deviations from these two targets, subject to budget, implementation-capacity, and dependency constraints.
Model assumptions
To delineate the scope of the proposed framework and to keep the formulation tractable and transparent, the following assumptions are adopted:
(1) Each candidate technology is either fully adopted or not adopted within the planning horizon; partial or incremental adoption is not considered, which justifies the use of binary decision variables.
(2) All model parameters, including carbon components, lean value contributions, investment costs, and implementation-capacity requirements, are treated as deterministic point estimates in the baseline formulation. Uncertainty in these inputs is examined separately through the robustness analysis.
(3) In the baseline formulation, portfolio-level carbon footprint and lean value are calculated from technology-level parameters. These parameters are interpreted as adjusted, incremental, and non-overlapping decision inputs rather than as gross, standalone effects. Accordingly, the lean value contribution of a technology represents its additional contribution after accounting for the roles of prerequisite and enabling technologies, while the carbon parameter reflects the technology-attributable burden assigned to that technology, without double-counting shared infrastructure. Interaction effects beyond the explicitly modeled prerequisite and infrastructure dependencies are not estimated endogenously in the baseline model.
(4) The decision is made for a single strategic planning period; the timing and sequencing of investments within the horizon are not modeled.
(5) The aspiration levels for carbon burden and lean value, as well as the goal weights, are specified by the decision-maker and reflect the firm’s strategic orientation toward sustainability and operational excellence.
These assumptions define the baseline formulation and keep the model transparent for target-based portfolio selection. Extensions for portfolio-level interaction effects are discussed after the model formulation.
Construction of carbon parameter
The carbon parameter Ci represents the technology-attributable carbon burden of technology i. The total carbon burden is represented through four components:
where Ciprod denotes production-stage carbon associated with raw material acquisition, component manufacturing, hardware production, assembly, packaging, transport, and initial deployment; Ciop represents operational carbon arising from electricity use, data processing, cloud computing, communication, and computational requirements; Cimaint captures the carbon burden associated with servicing, spare parts, replacement activities, and hardware or software maintenance; and Cieol represents end-of-life carbon associated with recycling, recovery, treatment, or disposal.
The system boundary covers the carbon burden attributable to the technologies themselves. The model does not estimate the net plant-level carbon effect after accounting for technology-enabled energy savings, waste reduction, defect prevention, reduced downtime, or other avoided emissions. Such operational improvements are represented, where relevant, through the lean value dimension and are not subtracted from Ci. This separation avoids treating lean resource-efficiency improvements as measured carbon reductions or implicitly crediting avoided emissions without plant-specific evidence. The framework therefore identifies which portfolio delivers lean value under a specified technology-attributable carbon burden; it does not determine which portfolio minimizes the net carbon footprint of the plant.
Carbon unit, life-cycle alignment, and planning horizon
Carbon parameters in the numerical application are expressed in normalized carbon footprint units (CFU) because the analysis is illustrative and is not based on a plant-specific emissions inventory. Published carbon estimates for Industry 4.0 technologies frequently differ in system boundary, functional unit, deployment scale, utilization, electricity mix, and equipment lifetime: embodied carbon is reported per device for Internet of Things (IoT) and edge hardware[21], per server or per chip for computing hardware[38], and at sector level for information and communication technology[20]. Assigning plant-level values in kg CO2-eq by combining such heterogeneous evidence would therefore imply a degree of physical precision that the illustrative data do not support. CFU is used to represent the relative carbon profiles of the alternatives without presenting these values as measured emissions.
The optimization structure is invariant to a common positive rescaling of the carbon coefficients and the carbon target. If all Ci values and Ctarget are multiplied by the same constant κ > 0, the corresponding carbon deviation is scaled by the same factor, and the normalized term dC+/Ctarget remains unchanged. Thus, changing only the carbon measurement unit does not alter the optimal portfolio, provided that the carbon coefficients and target are expressed on the same basis.
In a firm-specific application, the carbon coefficients may be obtained from physically measured emissions by a fixed scaling. Let Ei denote the technology-attributable carbon burden of technology i, expressed in kg CO2-eq, and let λ be a scaling constant expressed in kg CO2-eq per CFU. Then
and the same scaling applies to each of the four components, so that Equation (3) holds in either unit. Practitioners may equally omit the scaling and enter all coefficients and the target directly in kg CO2-eq; no change to the formulation is required. In the present numerical application, however, the CFU coefficients are structured relative decision parameters rather than rescaled empirical measurements.
The four-component structure in Equation (3) follows a simplified life-cycle perspective consistent with the general principles of ISO 14040[43] and ISO 14044[44] and with the GHG Protocol Product Life Cycle Accounting and Reporting Standard[33]. The production-stage component corresponds to the material acquisition and production stages of those frameworks, the operational and maintenance-related components to the use stage, and the end-of-life component to the end-of-life stage. As noted in Section “Carbon footprint implications of Industry 4.0 technologies”, the structure supports decision-oriented carbon accounting and should not be interpreted as a full ISO-conformant life-cycle assessment of the individual technologies; it addresses only technology-attributable greenhouse gas emissions.
Consistent aggregation further requires the four components to refer to a common planning horizon and deployment basis. Let T denote the planning horizon. One-time or asset-related emissions and recurring annual emissions may then be placed on a common planning-horizon-equivalent basis:
where τi is the expected service life of technology i in years; Eipord,unit and Eieol,unit are the production-stage and end-of-life emissions associated with one equipment life; and Eiop,yr and Eimaint,yr are the annual operational and maintenance-related emissions. Equation (3b) provides a service-life-adjusted planning-horizon basis for portfolio comparison rather than a literal inventory of emissions physically occurring within the horizon. Where detailed replacement and disposal schedules are available, actual timing can be used instead.
In empirical applications, the resulting coefficients vary with deployment scale, utilization, electricity mix, equipment lifetime, and end-of-life treatment. Operational carbon is strongly influenced by electricity demand and the relevant grid emission factor; therefore, a lower-carbon electricity mix reduces the operational component and increases the relative importance of embodied carbon. These assumptions should therefore be defined consistently across the candidate technologies and reported alongside the coefficients. End-of-life recovery or recycling credits may be incorporated where the selected carbon-accounting convention supports them.
Construction of lean value parameter
Lean-oriented value creation is defined as a composite lean value score derived from multiple lean performance dimensions. Let qim denote the illustrative lean contribution score of technology i with respect to lean value dimension m. In the numerical application, qim is assigned on a 1-10 scale, where higher values indicate stronger expected contribution. Let αm be the weight of lean value dimension m, with αm > 0 and Σm∈Mαm = 1. The composite lean value score of technology i is calculated as:
Since qim ∈ [1, 10], the weighted average Σm∈Mαmqim also lies in [1, 10], and Li lies in [10, 100]. The multiplication by 10 is used only to express the technology-level lean contribution on a convenient 10-100 score scale.
In a firm-specific application, both the dimension weights and technology scores should be elicited systematically rather than assigned directly. A cross-functional expert panel representing relevant functions such as production, maintenance, quality, information technology, and sustainability can first define anchored descriptions for the 1-10 scoring scale. The dimension weights αm may then be elicited using a structured weighting method such as analytic hierarchy process (AHP) or best–worst method (BWM), while the technology-level scores qim may be obtained through a Delphi-based procedure, in which experts provide independent initial assessments, review anonymized group feedback, and revise their judgments where appropriate. The resulting scores may be aggregated using the median or another prespecified group-aggregation rule.
As with any expert-based assessment, the elicited values may be affected by anchoring, differences in scale interpretation, expert selection bias, or overly optimistic expectations for particular technologies. These risks can be reduced through explicit scale anchors, independent initial scoring, anonymized feedback, and a common evaluation procedure applied consistently across all technologies. The resulting parameters should therefore be interpreted as structured managerial judgments, and their uncertainty can be examined through sensitivity or robustness analysis.
Sets, parameters, and decision variables
The notation used in the proposed model is summarized below.
Sets
I Set of candidate Industry 4.0 technologies, indexed by i.
M Set of lean value metrics, indexed by m.
P Set of prerequisite relationships; if (j, i) ∈ P, technology j may be selected only if prerequisite technology i is also selected.
Aj Set of alternative infrastructure technologies, any one of which can satisfy the infrastructure requirement of technology j.
Parameters
Ci Total technology-attributable carbon burden of technology i.
Ciprod Production-stage carbon components of technology i.
Ciop Operational carbon components of technology i.
Cimaint Maintenance-related carbon components of technology i.
Cieol End-of-life carbon components of technology i.
Li Composite lean value score of technology i.
qim Lean contribution score of technology i with respect to metric m.
αm Weight of lean metric m.
Ki Investment cost of technology i.
Hi Implementation-capacity requirement of technology i.
B Total available investment budget.
Hmax Maximum available implementation capacity.
Ctarget Carbon target.
Ltarget Lean value target.
wC, wL Weights of the carbon and lean value goals.
Decision variables
xi Binary variable equal to 1 if technology i is selected and 0 otherwise.
dC+, dC- Positive and negative deviations from the carbon target.
dL+, dL- Positive and negative deviations from the lean value target.
Binary weighted GP formulation
Following the standard weighted GP structure described by Jones and Tamiz[45], the proposed binary formulation is expressed as follows:
subject to:
The objective function (5) minimizes the weighted and normalized deviations from the carbon footprint and lean value targets. Normalization by the corresponding target makes the two deviation terms dimensionless and prevents differences in numerical scale from determining their relative importance. Only dC+ is penalized for the carbon goal because exceeding the carbon aspiration level is undesirable, whereas only dL- is penalized for the lean goal because falling short of the desired lean value is undesirable. Performance beyond either aspiration level receives no additional reward. This target-satisfaction structure represents a satisficing decision context in which the objective is to control carbon burden while attaining a desired level of lean value[22,24]. If continued improvement beyond either target is itself valued, a different objective structure, such as a conventional weighted objective or a lexicographic formulation, would be more appropriate.
The weights wC and wL represent the relative importance assigned to proportional carbon excess and proportional lean value shortfall. They should therefore not be interpreted as a direct exchange rate between one CFU and one unit of lean value. Because portfolio decisions are discrete, changes in the weights do not necessarily produce gradual changes in the solution; Section “Weight breakpoints and Pareto-efficiency validation” examines the resulting weight intervals and portfolio breakpoints.
Constraints (6) and (7) are the goal constraints; they measure, respectively, the deviation of the selected portfolio’s total carbon footprint and total lean value from their target levels. Constraint (8) ensures that total investment cost does not exceed the available budget, while constraint (9) limits the cumulative implementation difficulty of the selected portfolio to the firm’s available managerial and technical capacity. Constraint (10) enforces strict prerequisites, while constraint (11) requires that, for any technology depending on supporting infrastructure, at least one admissible infrastructure alternative be present. Finally, conditions (12) and (13) impose the binary and non-negativity requirements on the decision and deviation variables, respectively.
The baseline formulation assumes additive portfolio-level carbon and lean value. To avoid double counting, the technology-level parameters are therefore constructed as incremental, non-overlapping contributions relative to a defined reference configuration of the plant’s existing sensing, network, computing, and analytics infrastructure. For dependent technologies, the contribution is assessed conditional on the prerequisite technology already being available. For example, the lean contribution of predictive maintenance is evaluated as the additional improvement obtained when IoT-based monitoring is already in place. Shared infrastructure is accounted for only once, either as a separate platform component or through allocation among the technologies using a documented physical basis such as computing time, storage demand, communication traffic, or installed sensing capacity. The same incremental principle is applied to shared carbon burdens.
Where material interactions remain after this attribution procedure, the formulation can be extended using pairwise interaction variables yij, where yij = 1 if technologies i and j are selected together, and yij = 0 otherwise. Let S denote the set of technology pairs for which interaction effects are relevant. The auxiliary variables are linearized as:
The corresponding portfolio-level lean value and carbon burden become:
where γij represents synergy, overlap, or diminishing returns in lean value, and δij represents additional or avoided carbon burden associated with joint implementation or shared infrastructure. These interaction coefficients are not estimated in the numerical application because they require firm-specific deployment and operational data. The baseline model therefore uses the incremental technology-level parameters together with the explicit dependency structure.
Scenario-based preference setting
To examine how managerial priorities shape the selected Industry 4.0 technology portfolio, the model is solved under three preference scenarios. These scenarios represent different strategic orientations toward carbon control and lean value creation, with wC + wL = 1:
Carbon-priority: wC = 0.70, wL = 0.30
Balanced: wC = 0.50, wL = 0.50
Lean-priority: wC = 0.30, wL = 0.70
The carbon-priority scenario gives greater emphasis to avoiding carbon-target violations. The balanced scenario assigns equal importance to carbon control and lean value creation. The lean-priority scenario emphasizes achieving the desired lean value level while still penalizing carbon excess. Comparing the resulting portfolios provides a scenario-based assessment of how the selected technology set changes as the strategic emphasis shifts between sustainability and operational improvement.
NUMERICAL APPLICATION
This section presents an illustrative numerical application to demonstrate the use and interpretability of the proposed binary GP model. The application considers a manufacturing firm that plans to invest in a portfolio of Industry 4.0 technologies under limited financial and implementation resources. The firm seeks to support lean-oriented value creation while controlling the carbon burden associated with the selected portfolio.
To avoid implying the direct measurement of actual emissions, carbon-related quantities are expressed in normalized CFU, investment requirements in cost units (CU), lean value contributions as a composite lean value score, and implementation difficulty in implementation-capacity units. These decision scales provide a consistent basis for representing the illustrative parameters without implying firm- or sector-specific measurements. Accordingly, the numerical results should be interpreted as evidence of model behavior rather than as empirical evidence of the superiority of specific Industry 4.0 technologies.
Technology alternatives
The firm evaluates ten Industry 4.0 technology alternatives, listed in Table 2. These technologies were selected to represent a broad set of digital, data-driven, and automation-oriented technologies commonly associated with smart manufacturing and lean transformation. Prior studies on the Industry 4.0 and lean manufacturing interface emphasize that technologies such as IoT, cloud computing, simulation, advanced robotics, additive manufacturing, and data analytics can support different levels of the value stream and contribute to operational improvement, process visibility, and resource efficiency[28-30]. Recent studies also highlight a broader technology set, including AI, industrial IoT, digital twins, big data analytics, advanced robotics, and additive manufacturing, as key enablers of sustainable and data-driven industrial transformation[10].
Industry 4.0 technology alternatives
| T1 | IoT-based machine monitoring | T6 | Digital twin |
| T2 | AI-based quality inspection | T7 | Cloud manufacturing analytics |
| T3 | Predictive maintenance | T8 | Edge computing |
| T4 | Collaborative robots | T9 | RFID/RTLS tracking |
| T5 | AGV/AMR internal logistics | T10 | Additive manufacturing |
The alternatives differ in their technological role within the illustrative setting. IoT-based monitoring (T1), radio frequency identification (RFID)/real-time location system (RTLS) tracking (T9), and edge computing (T8) are treated primarily as enabling infrastructure technologies because they support data acquisition, connectivity, traceability, and local processing. Predictive maintenance (T3), digital twin (T6), and cloud manufacturing analytics (T7) are represented as data-driven decision-support technologies because they use operational data to improve planning, monitoring, maintenance, and process control. Collaborative robots (T4), automated guided vehicle (AGV)/autonomous mobile robot (AMR) internal logistics (T5), and additive manufacturing (T10) are treated as more hardware-intensive technologies.
Parameter setting for the numerical application
The numerical application uses a structured illustrative parameter set covering carbon burden, lean value contribution, investment cost, implementation difficulty, managerial targets, and technology dependencies. Each parameter is classified according to its construction basis as literature-informed (L), engineering-based (E), or application-specific (X). Literature-informed parameters reflect relative technology characteristics reported in previous studies; engineering-based parameters represent comparative technical characteristics applied consistently across the alternatives; and application-specific parameters represent values that would be estimated or elicited from firm data, managers, or experts in an empirical implementation. Table 3 summarizes this classification. Because the construction basis represents comparative technology profiles rather than empirical absolute levels, the parameters should be interpreted as structured relative decision inputs. Their numerical magnitudes are used directly in the optimization, while the absolute values should not be interpreted as measured firm-level quantities.
Provenance and construction basis of the illustrative parameters
| Parameter | Basis | Construction |
| Ciprod, Ciop | L/E | Broad relative profiles are informed by reported differences in hardware intensity and operational energy, computing, and communication requirements[6,20,21,38]; the numerical CFU values are illustrative rather than literature-derived measurements |
| Cimaint, Cieol | E | Comparative values reflect servicing requirements, replacement intensity, electronic or electromechanical content, and end-of-life treatment requirements |
| qim | X | Technology contributions to the five lean dimensions on the 1-10 scale defined in Section “Construction of lean value parameter” |
| αm | X | Equal weights are adopted as the baseline; firm-specific weights are elicited as described in Section “Construction of lean value parameter” |
| Ki | E/X | Relative values reflect acquisition and integration effort; absolute investment requirements are firm-specific |
| Hi | E/X | Relative values reflect technical integration, organizational effort, training requirements, and implementation complexity |
| B, Hmax, Ctarget, Ltarget | X | Managerial settings defining the resource limits and aspiration levels of the numerical application (Section “Cost, implementation difficulty, and model settings”) |
Illustrative carbon parameters
The carbon parameters are constructed comparatively across the ten alternatives using the four components defined in Section “Construction of carbon parameter” and the construction bases summarized in Table 3. The component values for each technology are reported in Supplementary Table 1.
Figure 1 presents the resulting carbon composition of the alternatives. Hardware-intensive technologies exhibit comparatively larger production-stage components, whereas data- and computing-intensive technologies exhibit relatively greater operational components. The alternatives therefore differ in both their carbon profiles and their total technology-attributable carbon burdens.
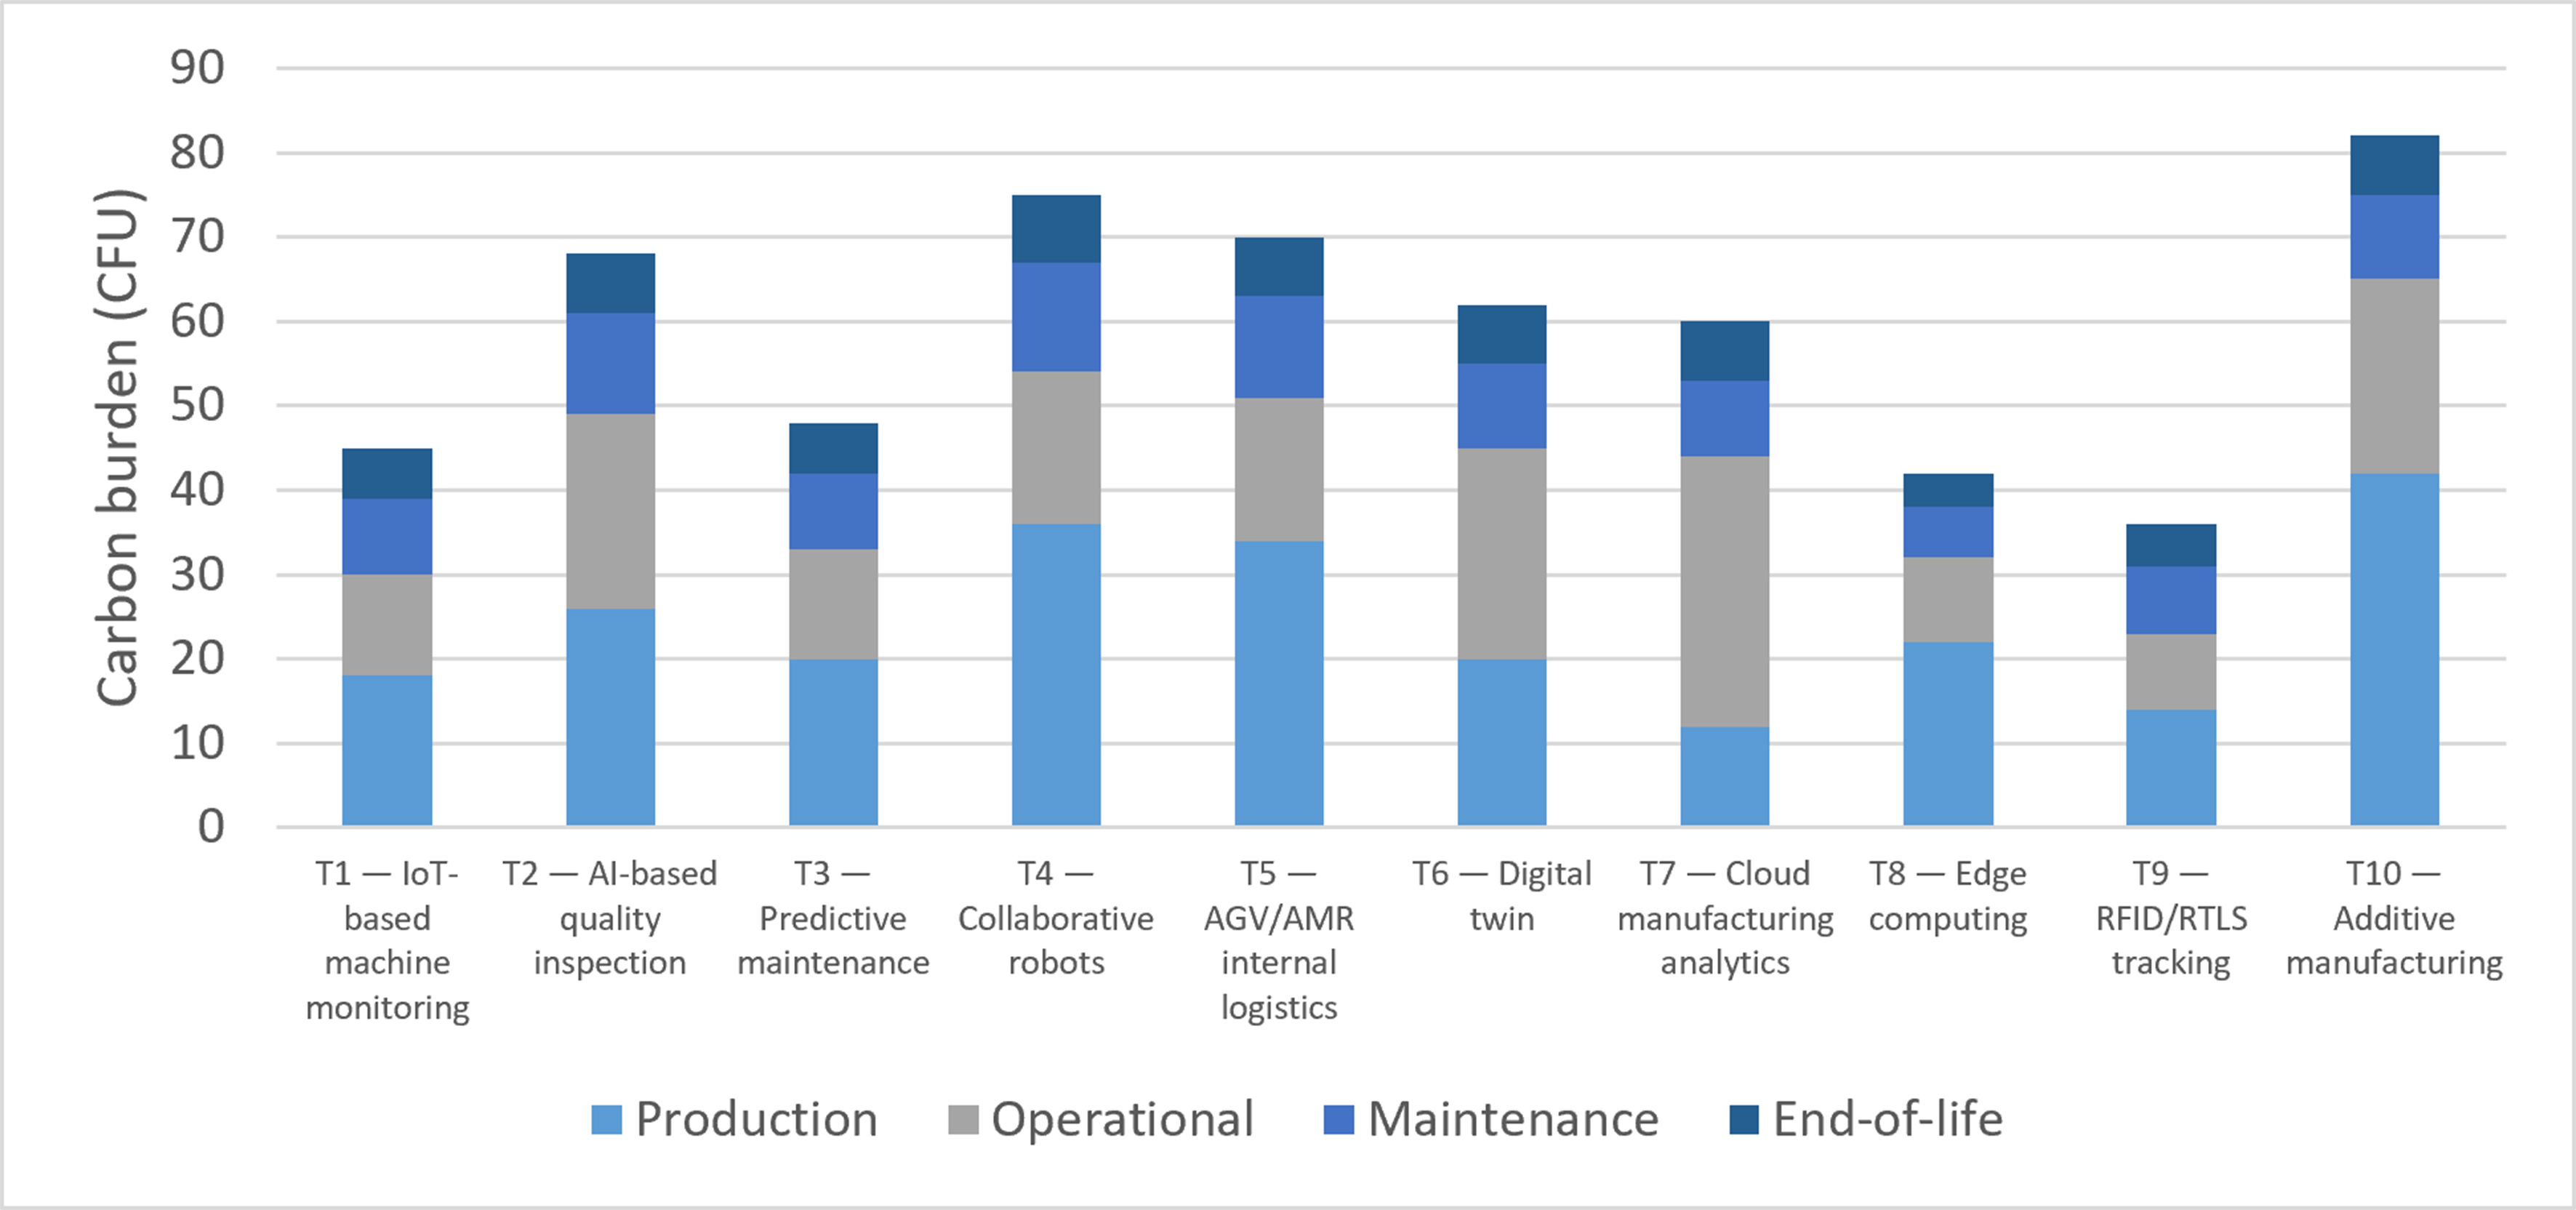
Figure 1. Carbon footprint components of technology alternatives. CFU: Carbon footprint unit; IoT: Internet of Things; AI: artificial intelligence; AGV: automated guided vehicle; AMR: autonomous mobile robot; RFID: radio frequency identification; RTLS: real-time location system.
Illustrative lean value parameters
Lean-oriented value creation is represented through the five performance dimensions defined in Section “Construction of lean value parameter”. Technology-level scores are assigned on a common 1-10 scale to represent relative contributions to lead-time reduction, quality improvement, work-in-process and inventory reduction, resource efficiency, and flexibility and responsiveness. Equal dimension weights (αm = 0.20) are adopted as the baseline weighting structure, and the composite lean value follows from Equation (4). The scores are structured to represent heterogeneous lean contribution profiles across the five dimensions. Supplementary Table 2 reports individual scores and the resulting composite values.
The resulting lean values are composite decision parameters rather than measured performance outcomes. In an empirical implementation, firm experts would elicit both the technology scores and the dimension weights using the procedure described in Section “Construction of lean value parameter”. Figure 2 summarizes the weighted and rescaled lean value components of the alternatives, consistent with the composite lean value calculation in Equation (4).
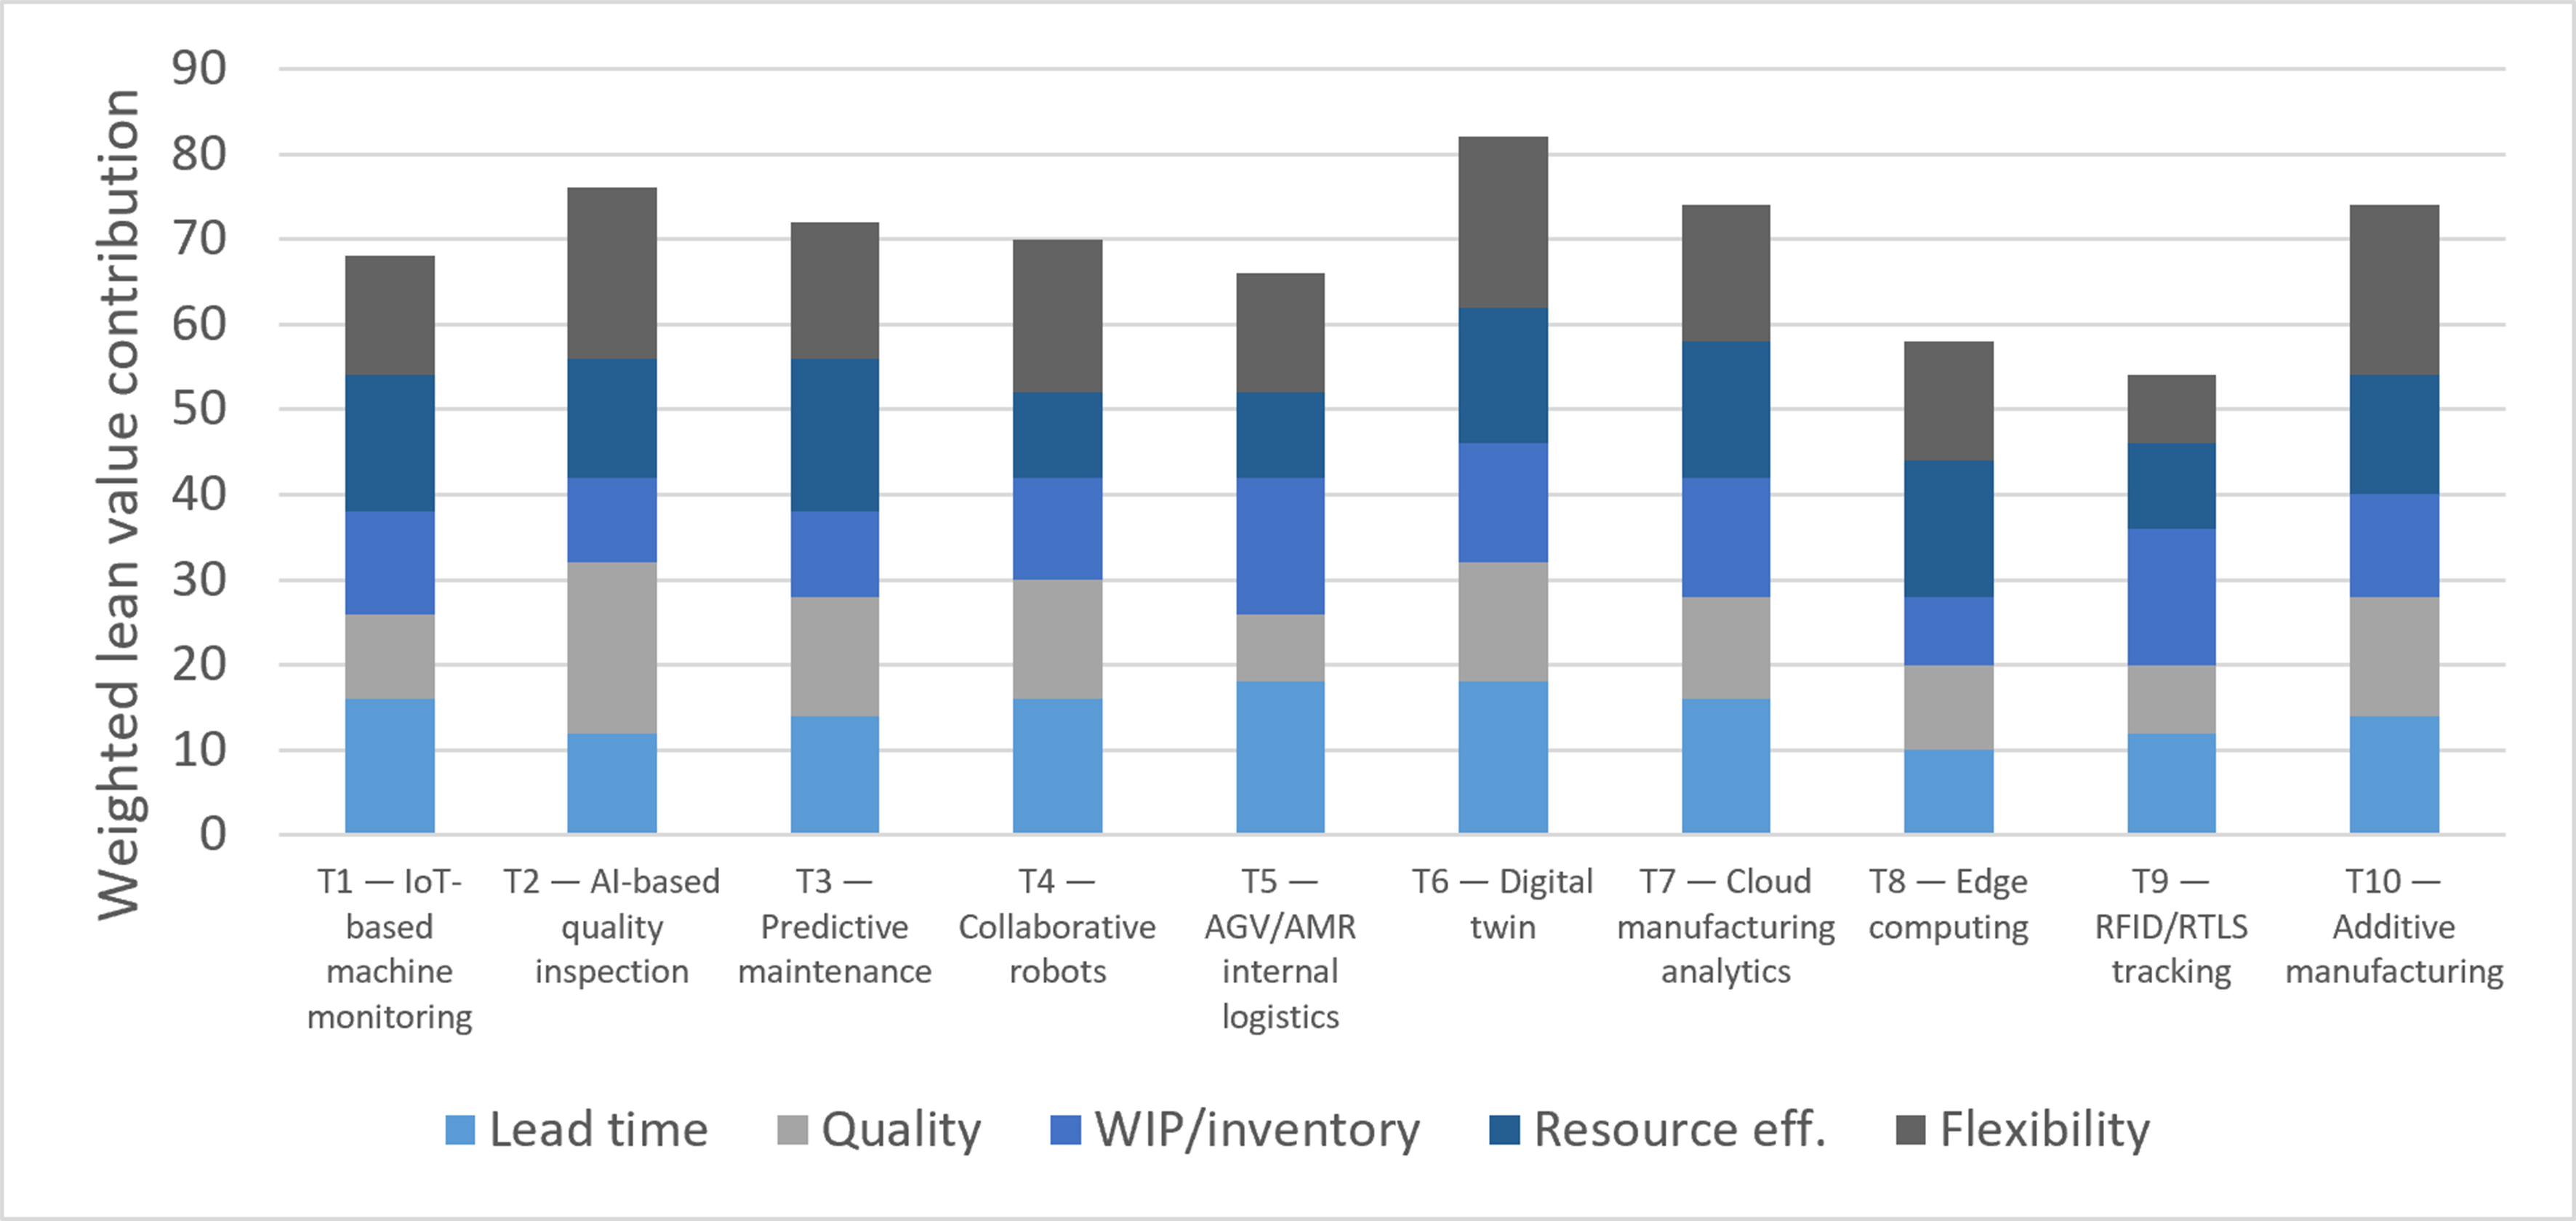
Figure 2. Weighted and rescaled lean value components of the technology alternatives. IoT: Internet of Things; AI: artificial intelligence; AGV: automated guided vehicle; AMR: autonomous mobile robot; RFID: radio frequency identification; RTLS: real-time location system; WIP: work-in-process.
Cost, implementation difficulty, and model settings
Investment-cost parameters reflect relative differences in acquisition and integration effort, while implementation-difficulty parameters represent the technical, organizational, and managerial effort associated with deployment, including system integration, training requirements, and implementation complexity. Both groups are expressed on relative illustrative scales and would be replaced by firm-specific estimates in an empirical application. Table 4 presents the model settings.
Model settings used in the numerical application
| Parameter | Value |
| B | 340 |
| H max | 18 |
| C target | 220 |
| L target | 350 |
| T | 5 years |
The settings were selected to create a constrained and non-trivial decision environment, and their resulting properties characterize that environment. The budget corresponds to approximately 44% of the total cost of adopting all ten alternatives, while the implementation-capacity limit corresponds to approximately 42% of their total implementation-difficulty requirements, thereby restricting simultaneous adoption of the full technology set. Under the baseline resource and dependency conditions, the lean value target corresponds to the maximum attainable lean value, whereas the carbon target is individually attainable but cannot be satisfied simultaneously with the lean target. The baseline setting therefore generates an active trade-off between the two goals. Carbon excess and lean value shortfall are permitted but penalized in the objective function, whereas the budget and implementation-capacity limits are hard constraints. The dependency relationships are specified in Section “Technology dependency constraints”.
Technology dependency constraints
Industry 4.0 technologies may rely on shared data-acquisition, computing, localization, or tracking infrastructure. These relationships are represented in the model through the strict prerequisite and infrastructure-alternative constraints introduced in Section “Proposed GP model formulation” [Equations (10) and (11)]. The numerical application adopts the architecture-specific dependencies reported in Table 5.
Technology dependency constraints assumed for the illustrative application
| Constraint | Interpretation | Justification within the assumed architecture |
| x3 ≤ x1 | Predictive maintenance is linked to IoT-based machine monitoring | The model assumes no pre-existing condition-monitoring layer, so T1 supplies the machine-level condition data on which failure prediction depends. Condition-monitoring and diagnostic architectures distinguish data acquisition and processing from subsequent diagnostic and prognostic functions[46]. Where such sensing already exists, this constraint can be removed |
| x6 ≤ x1 | Digital twin is linked to IoT-based machine monitoring | T6 is defined here as a continuously updated digital representation synchronized with shop-floor data. In the established classification of digital twins by degree of data integration, a representation without automated data exchange with the physical asset is classified as a digital model rather than a digital twin[47]. Offline simulation applications would therefore not carry this dependency |
| x7 ≤ x1 | Cloud manufacturing analytics is linked to IoT-based monitoring | The cloud-analytics application modeled here uses machine-level operational data supplied through T1, consistent with cloud-manufacturing architectures that connect manufacturing equipment and machine-data acquisition with cloud-based analytics[48]. If equivalent data are already available through MES, ERP, or historian systems, this constraint can be relaxed |
| x2 ≤ x7 + x8 | AI-based quality inspection requires cloud or edge computing | In the modeled application, the processing required for AI-based quality inspection is assumed to be provided through either cloud analytics or edge computing. The relevance of such computing infrastructure is consistent with manufacturing quality-inspection architectures combining machine learning with edge-cloud computing[49] |
| x5 ≤ x9 | AGV/AMR logistics is linked to RFID/RTLS tracking | In the modeled configuration, T9 provides the localization and load-tracking infrastructure used for material tracking and dispatching. RTLS technologies have been reviewed against manufacturing use cases of this kind[50], and their deployment alongside AGVs to support smart material handling has been proposed[51]. Architectures relying on alternative on-board localization methods would not carry this dependency |
These constraints represent the technology architecture assumed for the illustrative application rather than universal requirements of the corresponding technologies. In a firm-specific application, the dependency set should be defined according to the organization’s existing digital infrastructure and implementation architecture, and individual constraints may therefore be added, removed, or modified. The robustness analysis in Section “Robustness Analysis” evaluates the sensitivity of the results to alternative relaxed and strengthened dependency configurations.
Computational results
The model was implemented in General Algebraic Modeling System (GAMS) and solved separately for each preference scenario. Because the application contains only ten candidate technologies, global optimality was independently verified by complete enumeration of all candidate portfolios. Table 6 reports the optimal portfolios and their performance values.
Optimal technology portfolios under the three preference scenarios
| Scenario | Selected technologies | Total carbon | Lean value | Cost | Difficulty | Carbon excess | Lean shortfall |
| S1 Carbon-priority | T1, T3, T6, T7 | 215 | 296 | 285 | 16 | 0 | 54 |
| S2 Balanced | T1, T3, T6, T8, T9 | 233 | 334 | 320 | 17 | 13 | 16 |
| S3 Lean-priority | T1, T3, T6, T7, T9 | 251 | 350 | 330 | 18 | 31 | 0 |
The optimal portfolio changes systematically with managerial preference. In the carbon-priority scenario (S1), the model selects {T1, T3, T6, T7}. This portfolio has a total carbon burden of 215 CFU, which is below the carbon target of 220 CFU, while its portfolio lean value is 296, leaving a lean value shortfall of 54. Thus, the portfolio avoids carbon excess but does not fully attain the lean value target.
In the balanced scenario (S2), the optimal portfolio is {T1, T3, T6, T8, T9}, yielding a carbon burden of 233 CFU and a portfolio lean value of 334. Relative to S1, this portfolio accepts a carbon excess of 13 CFU while reducing the lean value shortfall from 54 to 16. It therefore represents an intermediate solution between carbon control and lean value creation. In the lean-priority scenario (S3), the optimal portfolio is {T1, T3, T6, T7, T9}. This portfolio meets the lean value target exactly at 350 but increases the carbon burden to 251 CFU, resulting in a carbon excess of 31 CFU. Under the specified budget and implementation-capacity limits, attaining the lean value target is therefore associated with a higher carbon burden. Figure 3 compares the carbon burden and portfolio lean value of each solution with their respective targets.
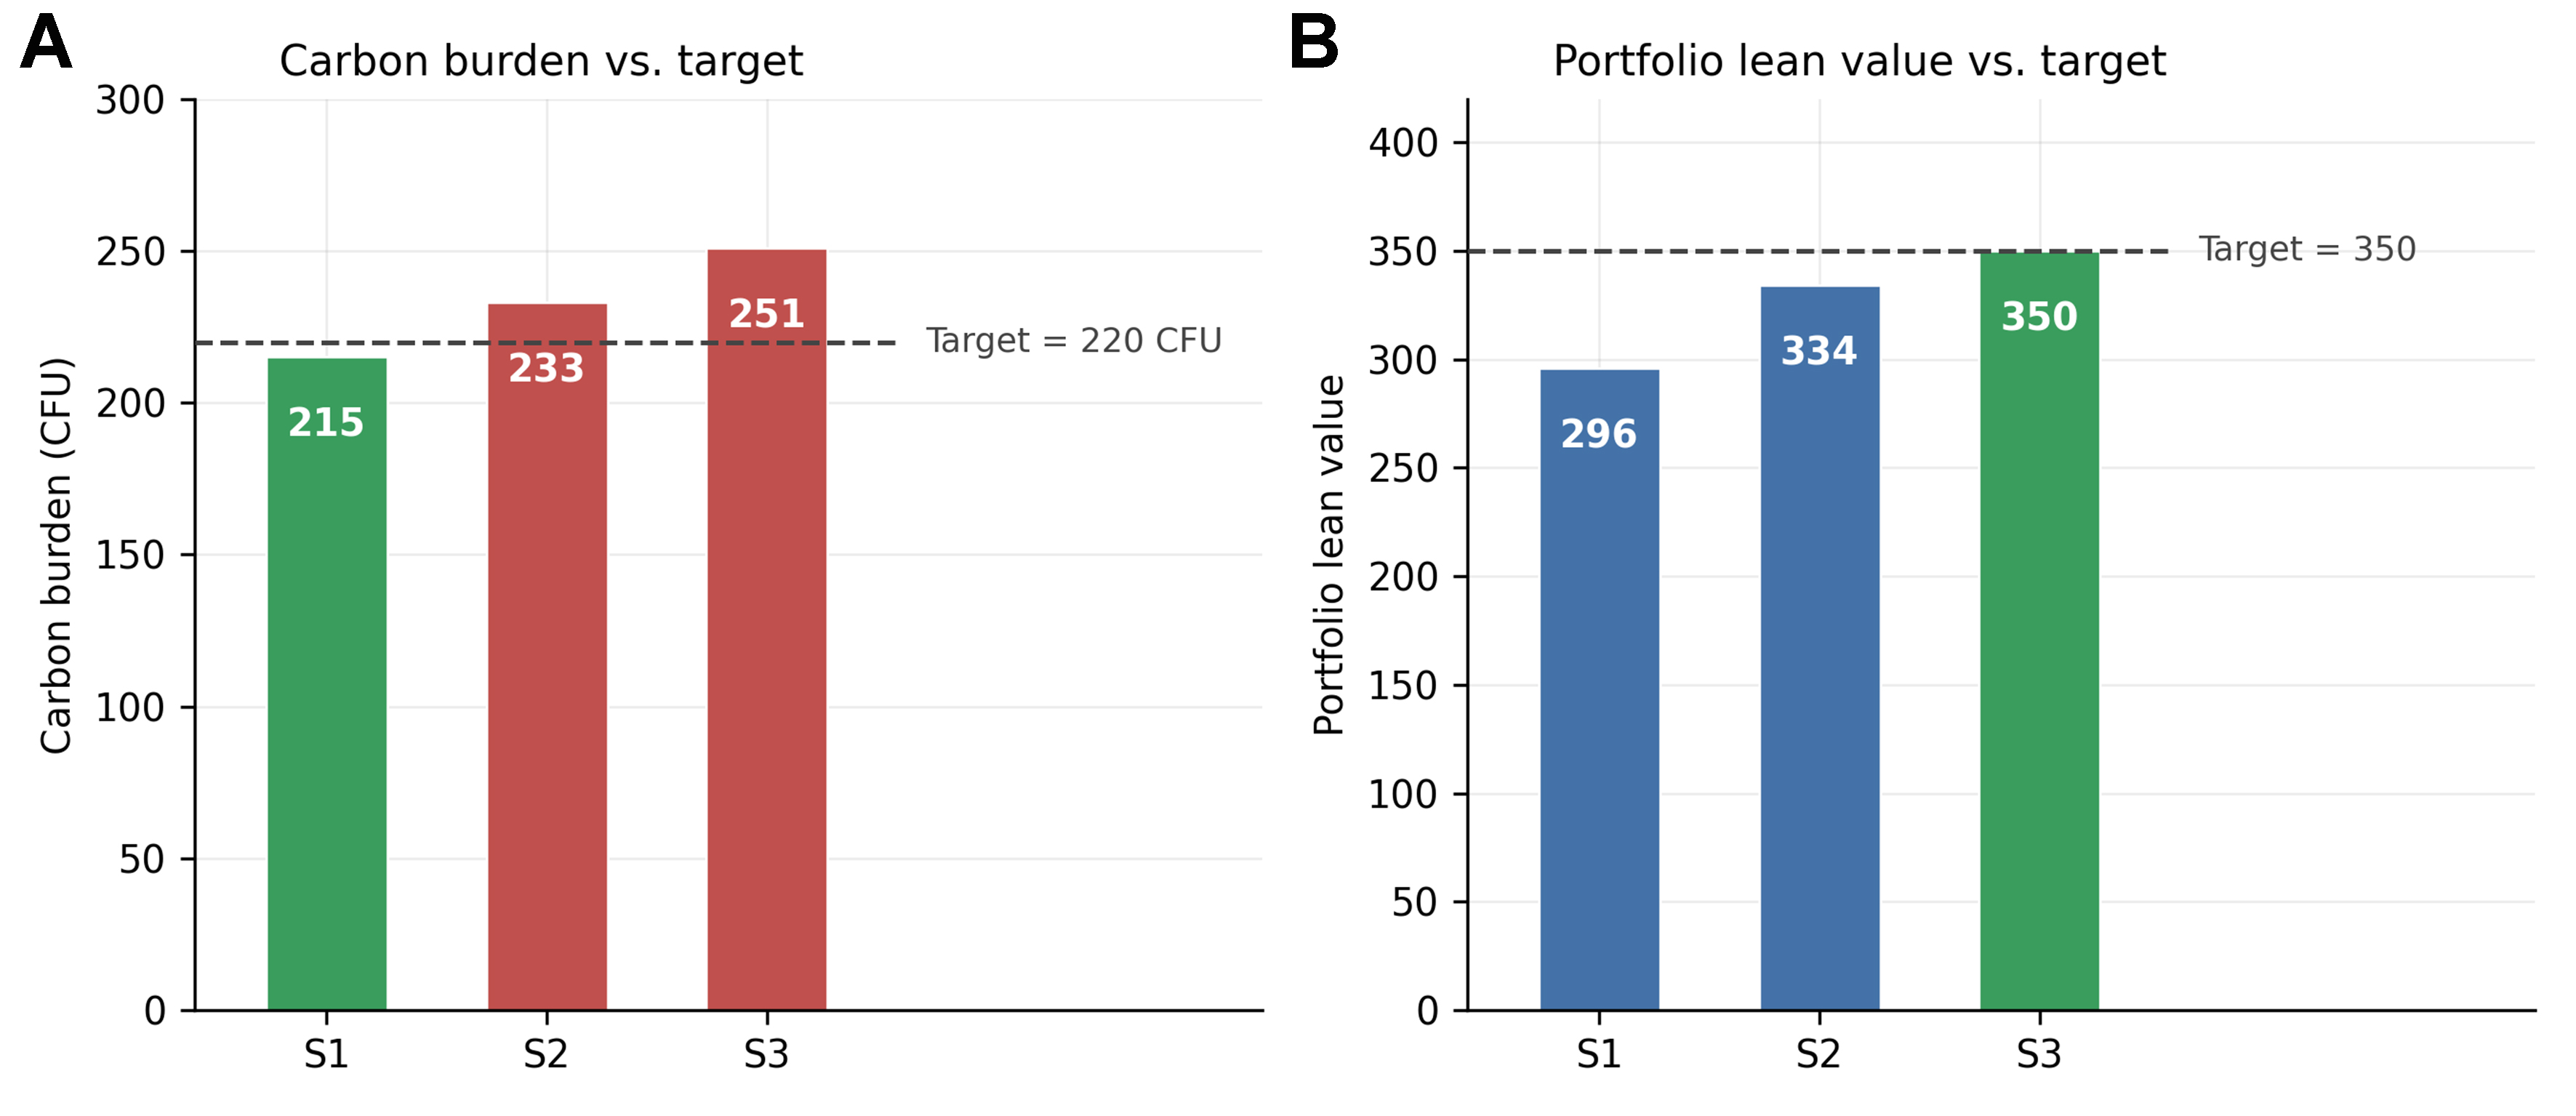
Figure 3. Portfolio performance against the carbon and lean value targets across the three scenarios. (A) Carbon burden vs. target; (B) Portfolio lean value vs. target. CFU: Carbon footprint unit.
Across the three scenarios, the trade-off pattern is clear. As the preference emphasis shifts from carbon control toward lean value creation, carbon excess increases from 0 to 13 and then to 31 CFU, while the lean value shortfall decreases from 54 to 16 and then to 0, as shown in Figure 4. Resource utilization also increases in the same direction. Budget use rises from 285 to 320 and then to 330 CU, corresponding to 84%, 94%, and 97% of the available budget. Implementation-capacity use increases from 16 to 17 and then to 18 units, with the lean-priority portfolio fully utilizing the available implementation capacity.
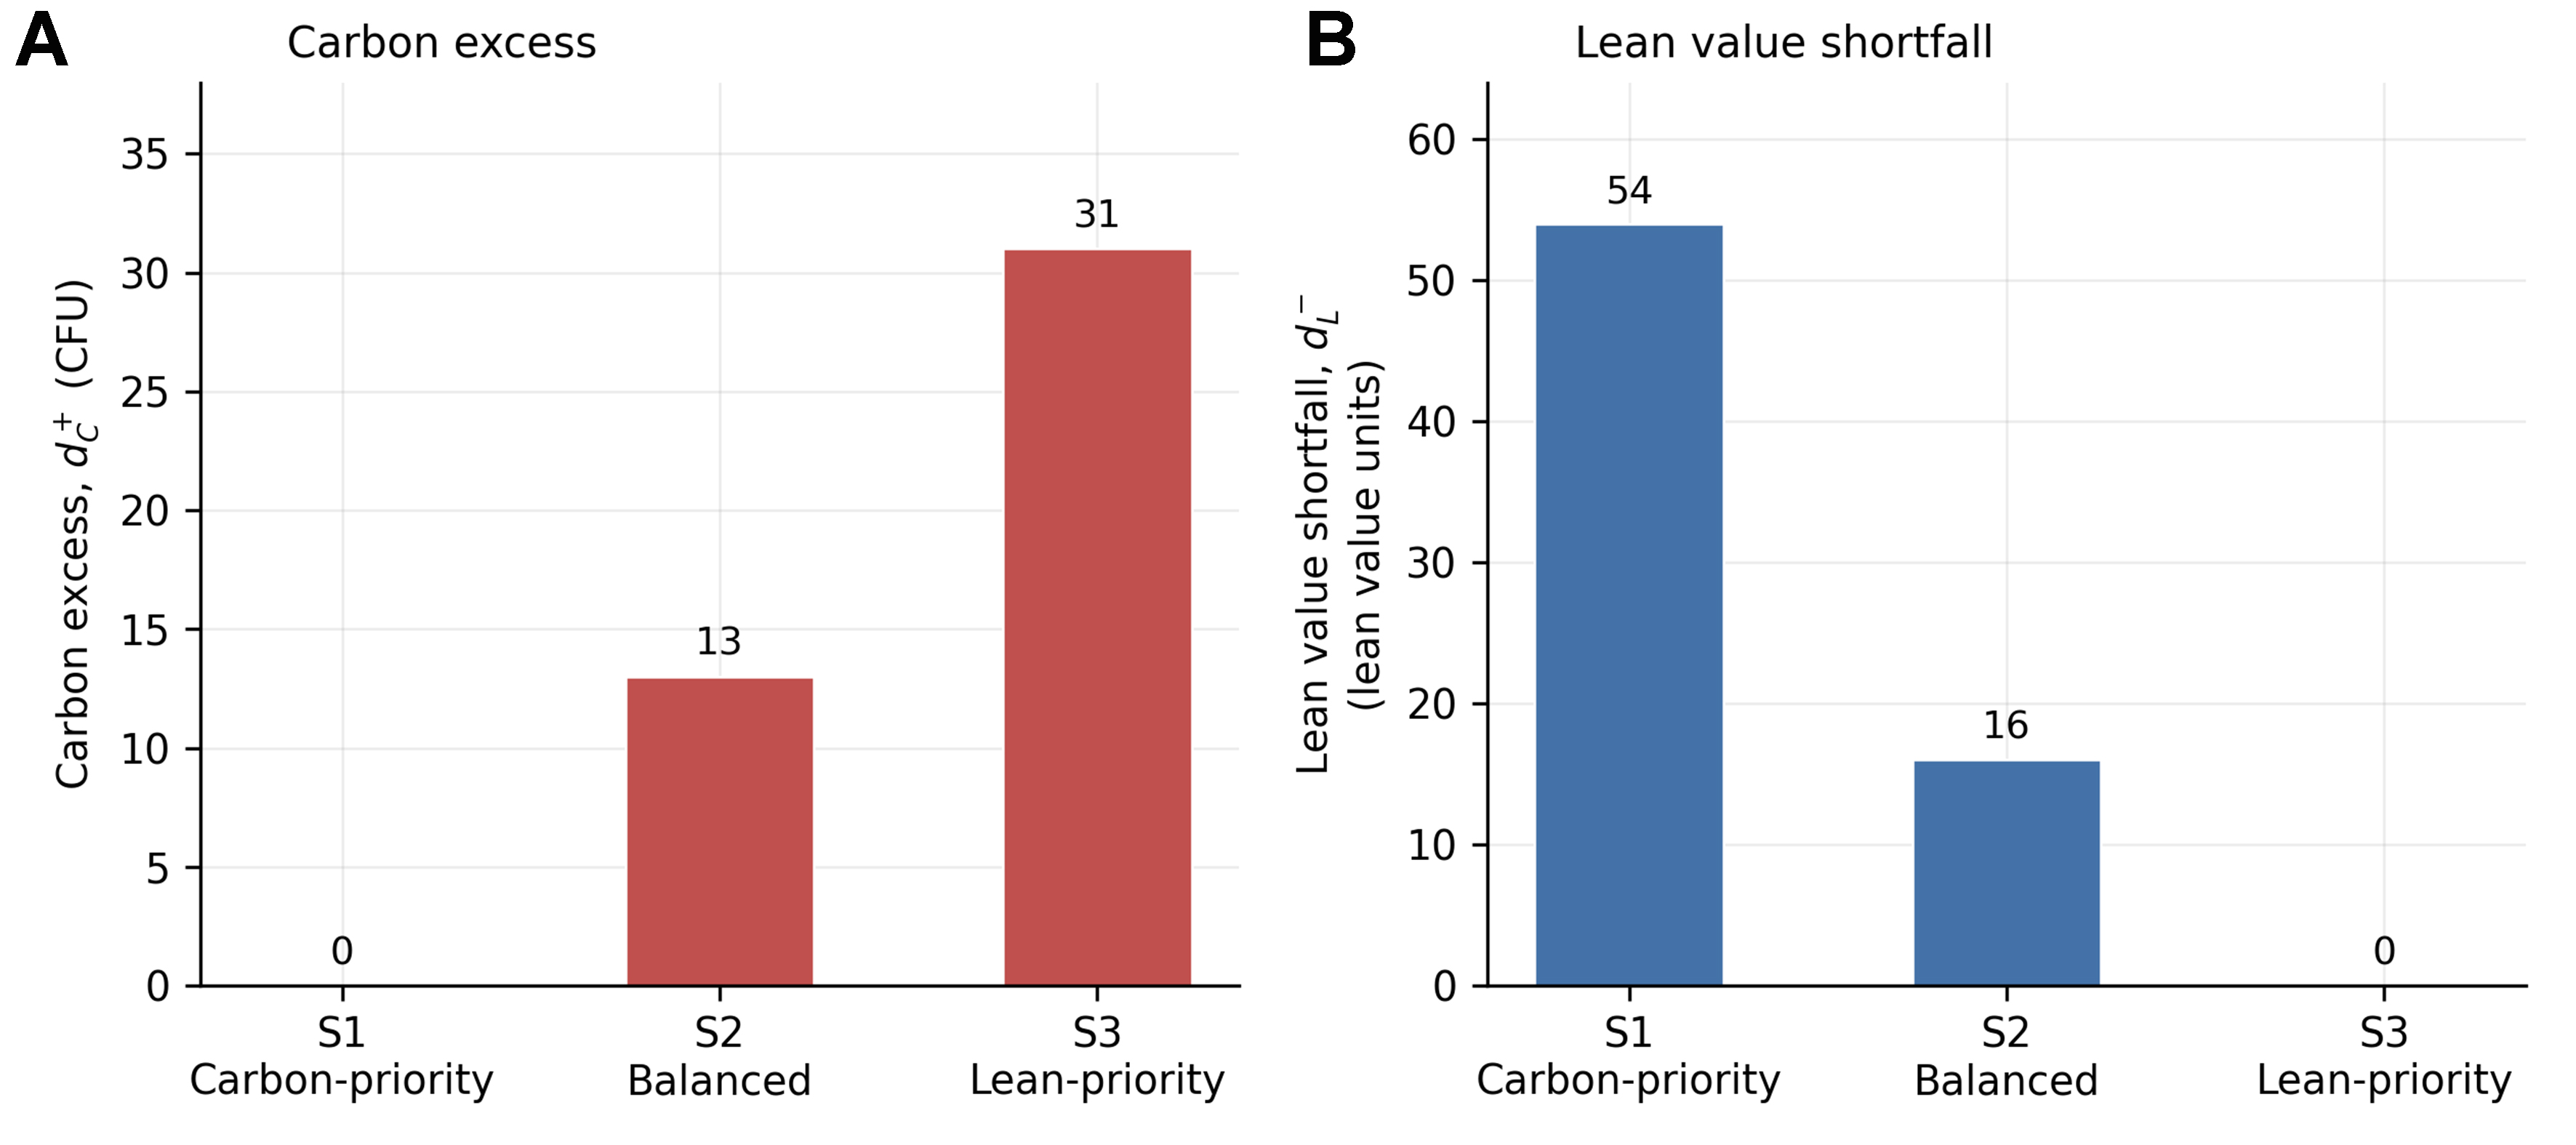
Figure 4. Scenario outcomes in terms of (A) carbon excess and (B) lean value shortfall. CFU: Carbon footprint unit.
As a validation check, all possible portfolios were enumerated. After filtering by budget, implementation capacity, and dependency constraints, 125 feasible portfolios remained, 31 of which were Pareto-efficient. The three GP solutions were all on this efficient frontier, confirming that no dominated portfolio was selected. The enumeration was used only for verification, while the GP model remains the main decision-support framework.
Across the three nominal scenarios, T1, T3, and T6 are selected repeatedly, whereas T7, T8, and T9 vary with the preference structure. These patterns reflect the illustrative parameter set and dependency assumptions. Their stability under simultaneous parameter uncertainty is examined in the robustness analysis presented in Section “Robustness Analysis”.
Sensitivity analysis
A sensitivity analysis was conducted to examine whether the proposed model produces interpretable and consistent portfolio responses under changing preference, target, and resource conditions. Because the numerical application is based on an illustrative parameter set, the sensitivity analysis does not validate empirical parameter estimates; it evaluates the model’s behavior under alternative assumptions.
Four sensitivity analyses are reported. SA1 varies the preference weights; SA2 varies the carbon target; SA3 varies the investment budget; SA4 varies the budget and the carbon target jointly. Table 7 summarizes SA1-SA4.
Sensitivity analysis results
| Analysis | Changed parameter | Result |
| SA1 | Preference weights | As the lean value weight increases, lean shortfall decreases from 54 to 0, while carbon excess increases from 0 to 31 |
| SA2 | Carbon target | Relaxing the carbon target reduces lean shortfall and eventually allows both goals to be achieved |
| SA3 | Budget | Increasing the budget improves lean value up to a threshold, but additional budget does not change the solution after B = 320 |
| SA4 | Budget and carbon target | Jointly increasing the budget and relaxing the carbon target reduces lean shortfall; zero lean shortfall is first achieved at B = 330 when Ctarget =260, while tighter carbon targets limit the benefit of additional budget |
Preference weight sensitivity
In the first experiment, the preference weights assigned to the carbon and lean value goals were varied while keeping the carbon target, lean value target, budget, and implementation capacity fixed. The results reveal three distinct portfolio regions. When the model assigns greater weight to the carbon goal, it selects the carbon-conservative portfolio {T1, T3, T6, T7}. This portfolio keeps the total carbon burden below the target but leaves a lean value shortfall of 54. As the preference structure becomes more balanced, the model shifts to the compromise portfolio {T1, T3, T6, T8, T9}, which accepts a carbon excess of 13 CFU while reducing the lean value shortfall to 16. When greater weight is assigned to the lean value goal, the model selects {T1, T3, T6, T7, T9}, attaining the lean value target while increasing the carbon excess to 31 CFU.
As illustrated in Figure 5, the model responds consistently to changes in managerial priorities. A stronger emphasis on carbon control leads to lower-carbon portfolios, whereas a stronger emphasis on lean value creation leads to portfolios with higher lean value but also higher carbon burden. This result supports the central premise of the numerical application: under the assumed parameter setting, Industry 4.0 portfolio selection involves an explicit trade-off between carbon control and lean-oriented value creation. Supplementary Table 3 reports the optimal portfolio, goal deviations, and resource use at each weight setting.
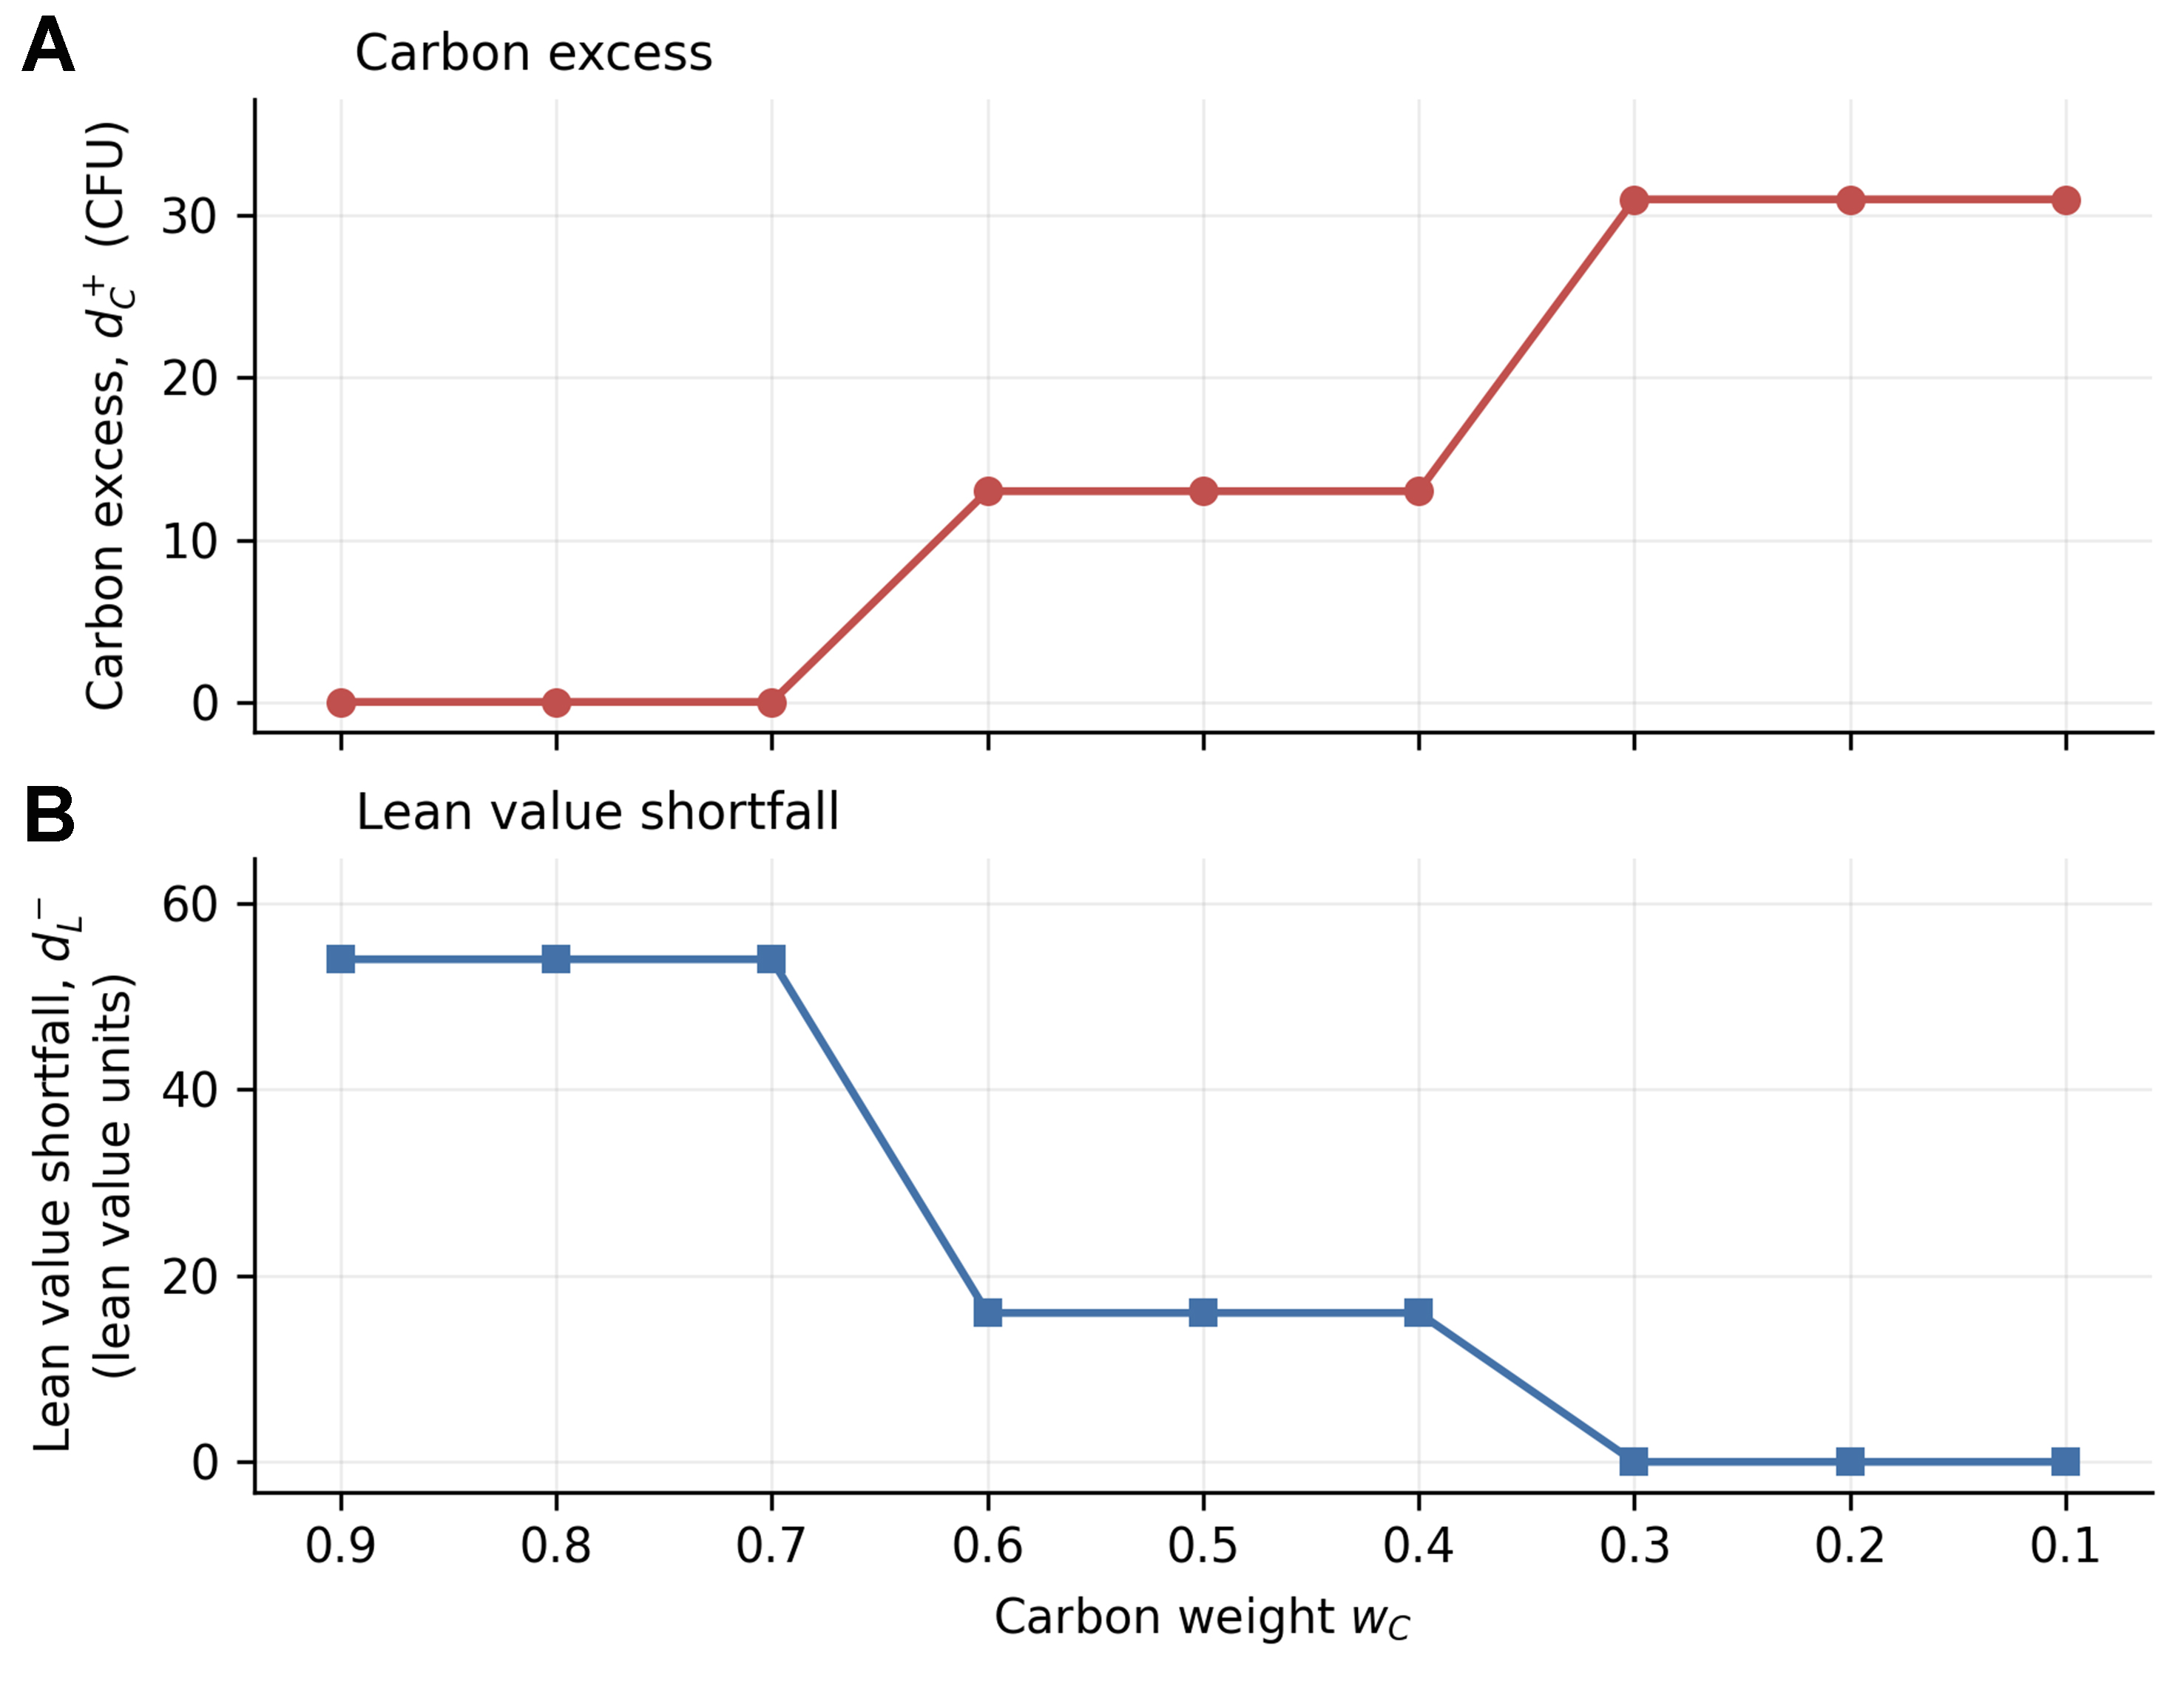
Figure 5. Sensitivity to managerial preference weights. (A) Carbon excess; (B) Lean value shortfall. CFU: Carbon footprint unit.
Carbon target sensitivity
In the second experiment, the carbon target was varied under the balanced preference setting. The results indicate that stricter carbon targets make lower-carbon technology combinations more attractive, but this may come at the expense of lean value performance. For example, when the carbon target is reduced to 180 CFU, the selected portfolio produces a lean shortfall of 74. As the carbon target is relaxed, the model can include additional technologies that improve lean value performance. When the carbon target reaches 260 CFU, both the carbon and lean value goals are achieved without any undesirable deviation.
Figure 6 shows that the carbon target functions as a strategic control parameter rather than a passive reporting threshold. A stricter target limits the attractiveness of technology combinations with higher carbon burdens, even when they offer higher lean value contributions. Conversely, a more flexible carbon target allows the firm to adopt a broader technology portfolio and reduce the lean value gap. Therefore, the carbon target can be interpreted as a managerial lever for aligning digital transformation intensity with environmental ambition. The full results for all carbon target levels and preference scenarios are reported in Supplementary Table 4.
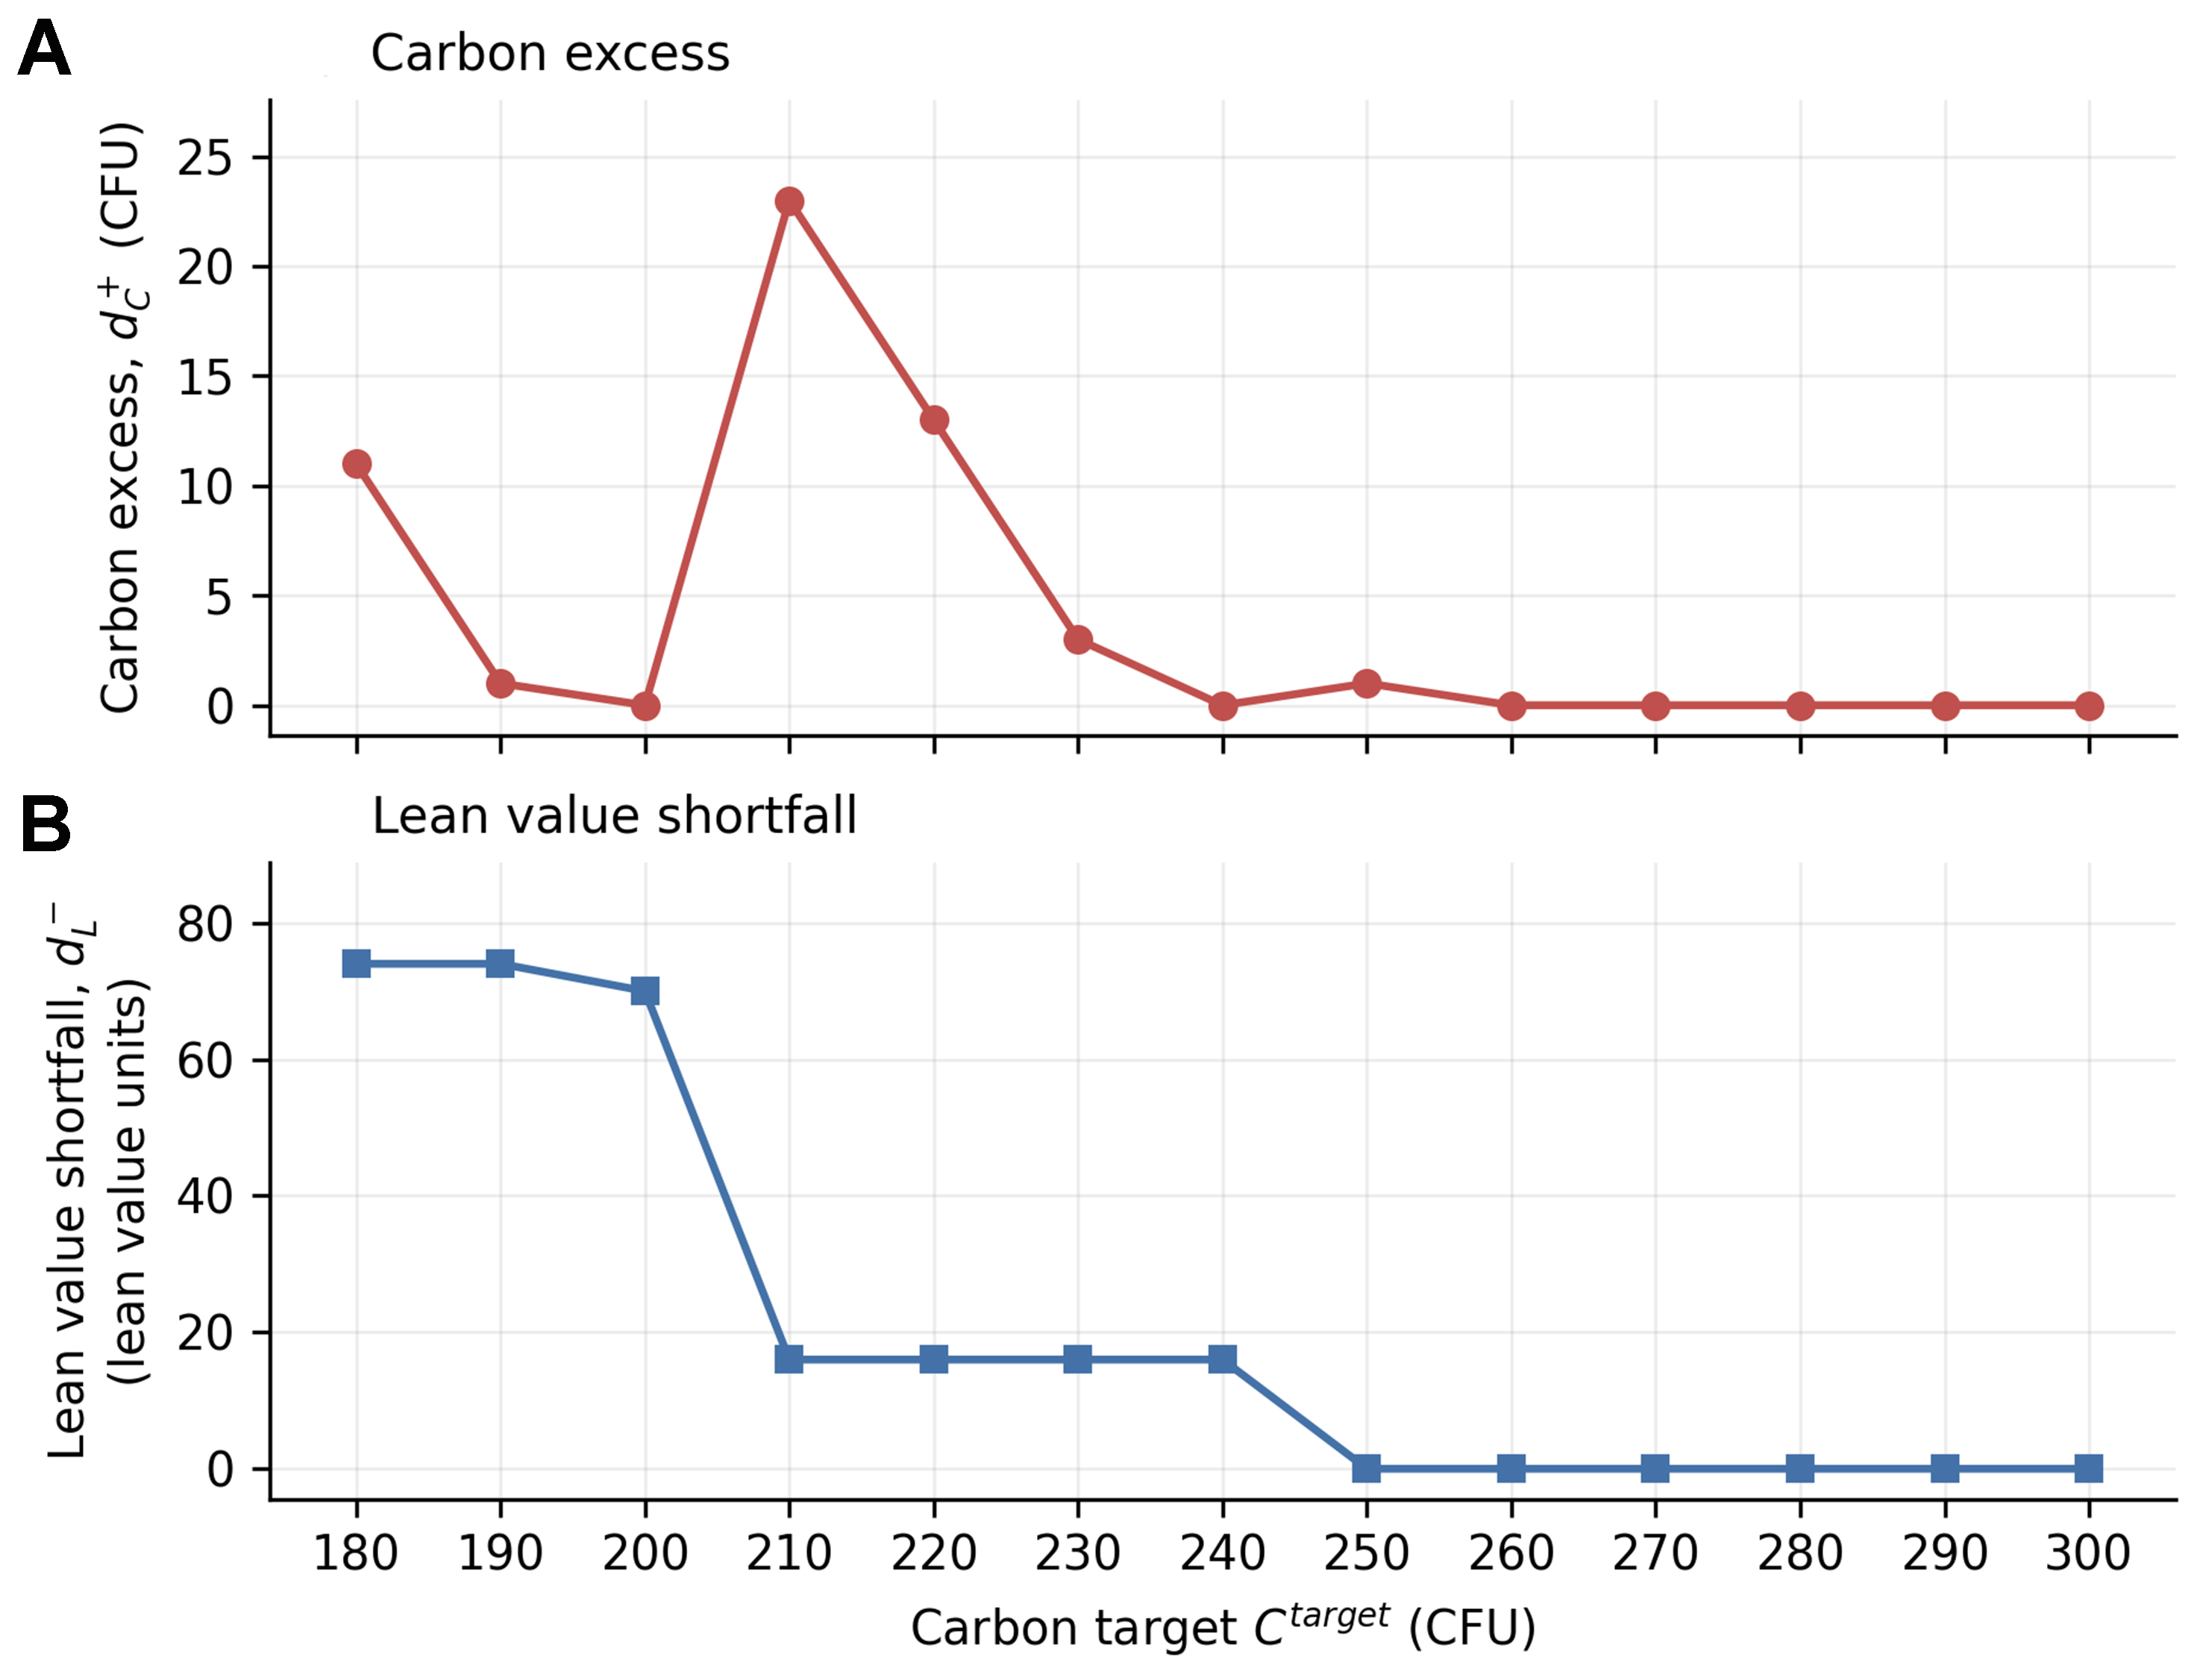
Figure 6. Sensitivity to the carbon target (balanced setting). (A) Carbon excess; (B) Lean value shortfall. CFU: Carbon footprint unit.
Budget sensitivity
In the third experiment, the available investment budget was varied while maintaining the balanced preference setting. The results show that increasing the budget initially broadens the feasible solution space and improves lean value performance. When the available budget increases from 220 to 320 CU, the lean shortfall decreases from 126 to 16. This indicates that the budget constraint is influential when financial resources are limited. However, after the budget reaches 320 CU, further increases do not alter the selected portfolio. At budget levels of 320 CU and above, the selected portfolio uses 320 CU, leaving positive budget slack for higher budget levels.
As shown in Figure 7, additional financial resources improve the selected portfolio only up to the point at which the budget constraint ceases to be binding. Beyond this point, a firm cannot necessarily obtain a better Industry 4.0 portfolio by simply increasing its investment budget. Under the balanced weighting scheme and the baseline carbon target, reducing the remaining lean value shortfall would require selecting a more carbon-intensive portfolio, thereby increasing carbon excess and worsening the weighted goal-deviation objective. Thus, financial resources are effective only when they align with the carbon target and implementation capacity. The complete budget sweep is reported in Supplementary Table 5. Supplementary Table 6 summarizes the saturation diagnosis for each preference scenario, including the resources used at the saturation point and the objective penalty of the best remaining single addition.
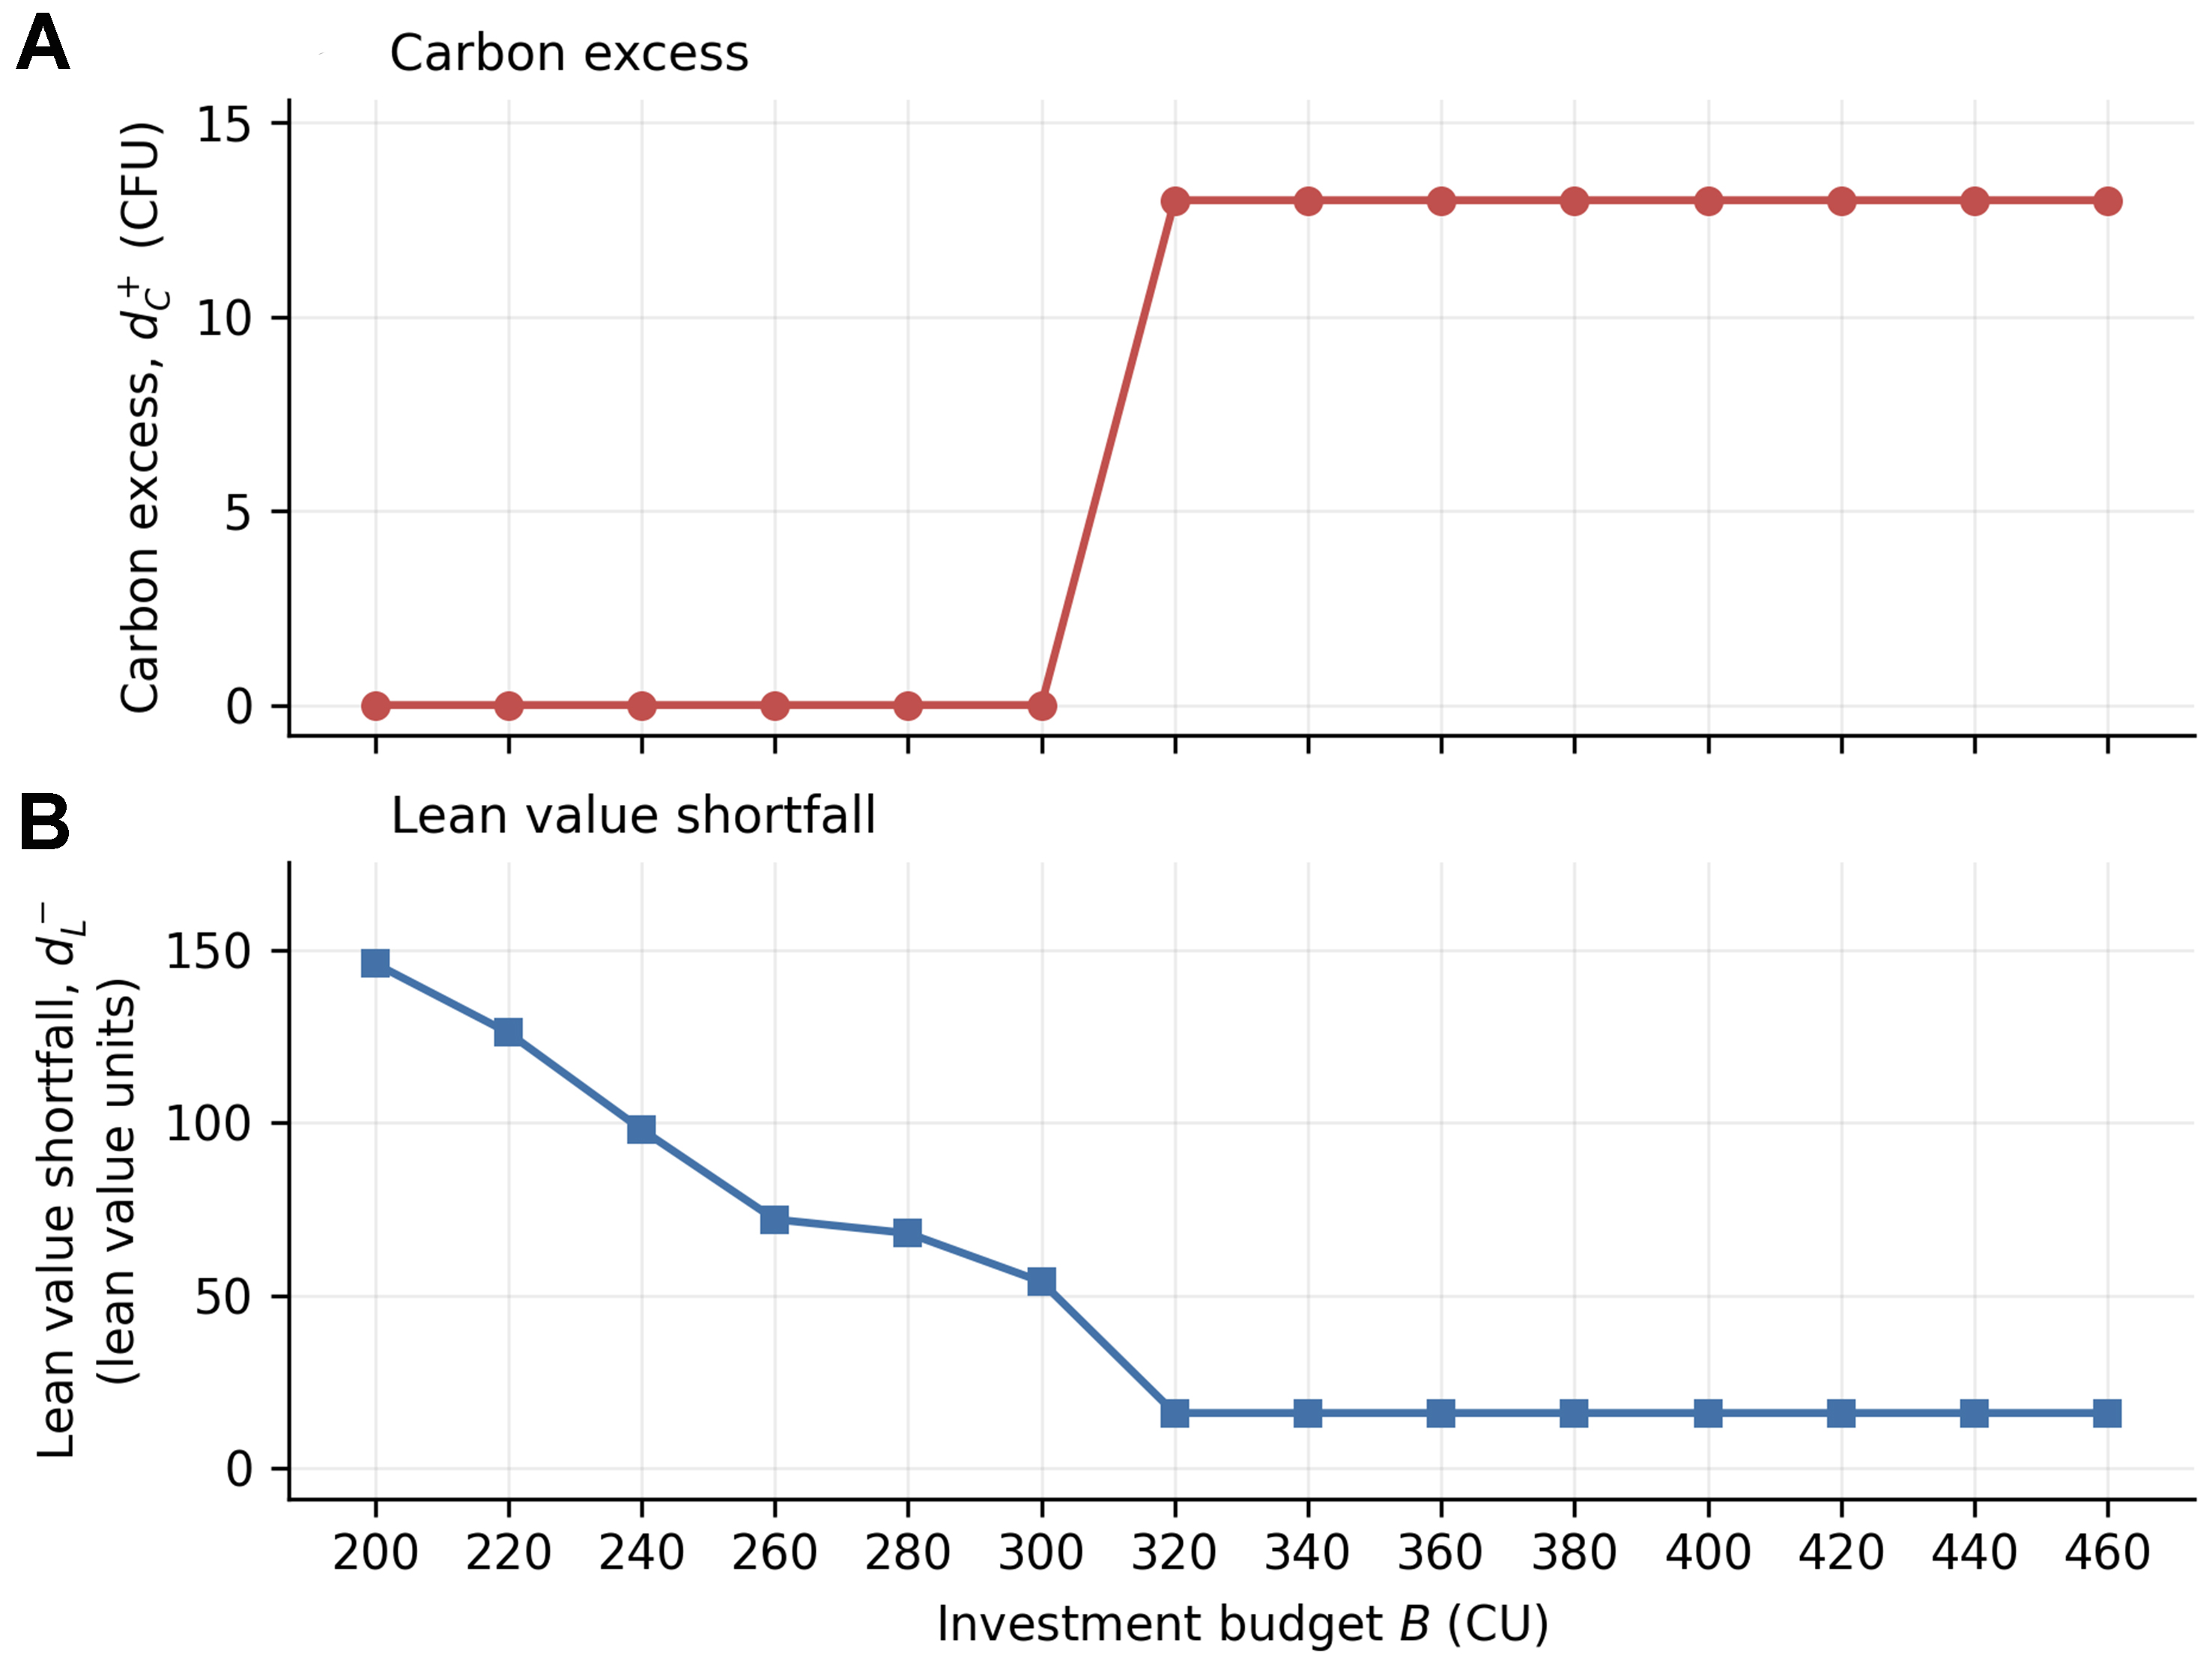
Figure 7. Sensitivity to the investment budget (balanced setting). (A) Carbon excess; (B) Lean value shortfall. CFU: Carbon footprint unit; CU: cost unit.
Combined budget–carbon target sensitivity analysis
The single-factor budget sensitivity analysis showed that the selected portfolio becomes insensitive to additional budget after a certain threshold. To examine this result jointly with environmental stringency, the investment budget and carbon target were varied simultaneously. The lean value target was fixed at 350 and the preference weights at the balanced setting. Budget levels of 280, 310, 320, 330, 340, 370, and 400 CU were evaluated together with carbon targets of 200, 220, 240, and 260 CFU.
Table 8 summarizes the joint effects of the investment budget and carbon target on lean value shortfall. At the strict carbon target of 200 CFU, the lean shortfall remains at 70 across all budget levels. Neither resource constraint is binding at this point, since the selected portfolio uses 275 of the 280 CU available at the lowest budget level and 15 of the 18 available implementation-capacity units. The shortfall persists because the available portfolio changes that would increase lean value also increase carbon deviation sufficiently to worsen the balanced goal-deviation objective. At the baseline carbon target of 220 CFU, the lean shortfall reaches its minimum value of 16 at a budget of 320 CU, consistent with the single-factor analysis in Section “Budget sensitivity”. Additional budget does not further improve the solution because closing the remaining lean gap would require a portfolio with a higher carbon burden, thereby increasing carbon excess and worsening the objective.
Lean value shortfall under joint variation of the budget and the carbon target
| Carbon target (CFU) | |||||
| 200 | 220 | 240 | 260 | ||
| Budget (CU) | 280 | 70 | 68 | 68 | 68 |
| 310 | 70 | 54 | 50 | 50 | |
| 320 | 70 | 16 | 16 | 16 | |
| 330 | 70 | 16 | 16 | 0 | |
| 340 | 70 | 16 | 16 | 0 | |
| 370 | 70 | 16 | 16 | 0 | |
| 400 | 70 | 16 | 16 | 0 | |
When the carbon target is relaxed to 260 CFU, the lean shortfall reaches zero at 330 CU. The joint analysis therefore shows that the effective budget threshold depends on the carbon target: additional financial capacity improves lean performance only when the target permits portfolio changes that improve the weighted goal-deviation objective. Supplementary Table 7 reports the portfolio selected for each of the 28 budget–carbon-target combinations, along with its carbon burden, cost, and both goal deviations.
Robustness analysis
The sensitivity analyses in Section “Sensitivity analysis” vary managerial settings while holding the technology-level parameters fixed. In an empirical application, these parameters would also be subject to estimation uncertainty. A Monte Carlo analysis was therefore conducted to examine the stability of the selected technologies and portfolios under simultaneous parameter perturbation.
The experiment combines two perturbation levels (ρ = 0.10 and ρ = 0.20), three dependency configurations, and the three preference scenarios defined in Section “Scenario-based preference setting”, yielding 18 experimental cells. Each cell contains 10,000 replications. Within each preference scenario, the goal weights remain at their nominal values, while the budget and target levels are held at the baseline settings.
In each replication, the four carbon components, five lean sub-scores, investment costs, implementation-difficulty values, and implementation-capacity limit are multiplied by independent factors drawn from Uniform(1 - ρ, 1 + ρ). Lean sub-scores are restricted to the admissible range [1, 10], while implementation-difficulty and capacity values are retained as continuous normalized quantities. Lean dimension weights are drawn from a Dirichlet distribution centered on the baseline equal-weight vector. The concentration parameter is set to ν = 399 for ρ = 0.10 and ν = 99 for ρ = 0.20, corresponding to an approximate coefficient of variation of 10% and 20% for each dimension weight.
Technology dependencies are examined under three alternative configurations rather than being perturbed randomly. The baseline configuration uses the dependencies in Table 5. The relaxed configuration assumes that a condition-monitoring layer is already available and therefore removes the three prerequisite relationships involving T1. The strengthened configuration adds a computing requirement for the digital twin and restricts the computing alternative for AI-based quality inspection to edge computing. Detailed definitions of the three configurations are provided in Supplementary Table 8.
Each replication was evaluated by exhaustively enumerating all candidate portfolios, ensuring that the reported variation reflects parameter uncertainty rather than solver tolerance. The complete design therefore comprises 180,000 solved instances. Table 9 reports technology selection frequencies averaged across the three dependency configurations for each perturbation-level–preference-scenario combination, together with the minimum and maximum frequencies observed across all 18 experimental cells. Figure 8 complements these results by showing the nominal selection pattern and the minimum, maximum, and mean selection frequencies across the 18 robustness cells. The complete matrix is provided in Supplementary Table 9.
Technology selection frequencies (%) under parameter uncertainty
| Technology | ρ = 0.10 S1 | ρ = 0.10 S2 | ρ = 0.10 S3 | ρ = 0.20 S1 | ρ = 0.20 S2 | ρ = 0.20 S3 | Min | Max |
| T1 IoT-based machine monitoring | 99.2 | 99.8 | 99.7 | 95.7 | 98.2 | 97.6 | 87.2 | 100.0 |
| T2 AI-based quality inspection | 1.1 | 0.4 | 1.1 | 8.6 | 5.8 | 8.4 | 0.4 | 11.0 |
| T3 Predictive maintenance | 98.3 | 99.2 | 96.7 | 83.4 | 88.5 | 83.7 | 80.7 | 99.5 |
| T4 Collaborative robots | 0.0 | 0.0 | 0.0 | 0.8 | 0.4 | 0.5 | 0.0 | 1.0 |
| T5 AGV/AMR internal logistics | 0.0 | 0.0 | 0.0 | 0.4 | 0.6 | 0.9 | 0.0 | 0.9 |
| T6 Digital twin | 81.7 | 63.1 | 79.7 | 71.5 | 58.4 | 70.8 | 58.2 | 82.0 |
| T7 Cloud manufacturing analytics | 87.0 | 38.9 | 57.9 | 73.6 | 56.4 | 63.2 | 38.7 | 87.3 |
| T8 Edge computing | 32.4 | 98.4 | 65.2 | 53.8 | 83.0 | 68.4 | 32.2 | 98.7 |
| T9 RFID/RTLS tracking | 30.1 | 97.5 | 97.3 | 47.1 | 82.2 | 83.3 | 29.9 | 97.8 |
| T10 Additive manufacturing | 0.0 | 0.0 | 0.0 | 0.7 | 0.5 | 0.6 | 0.0 | 0.8 |
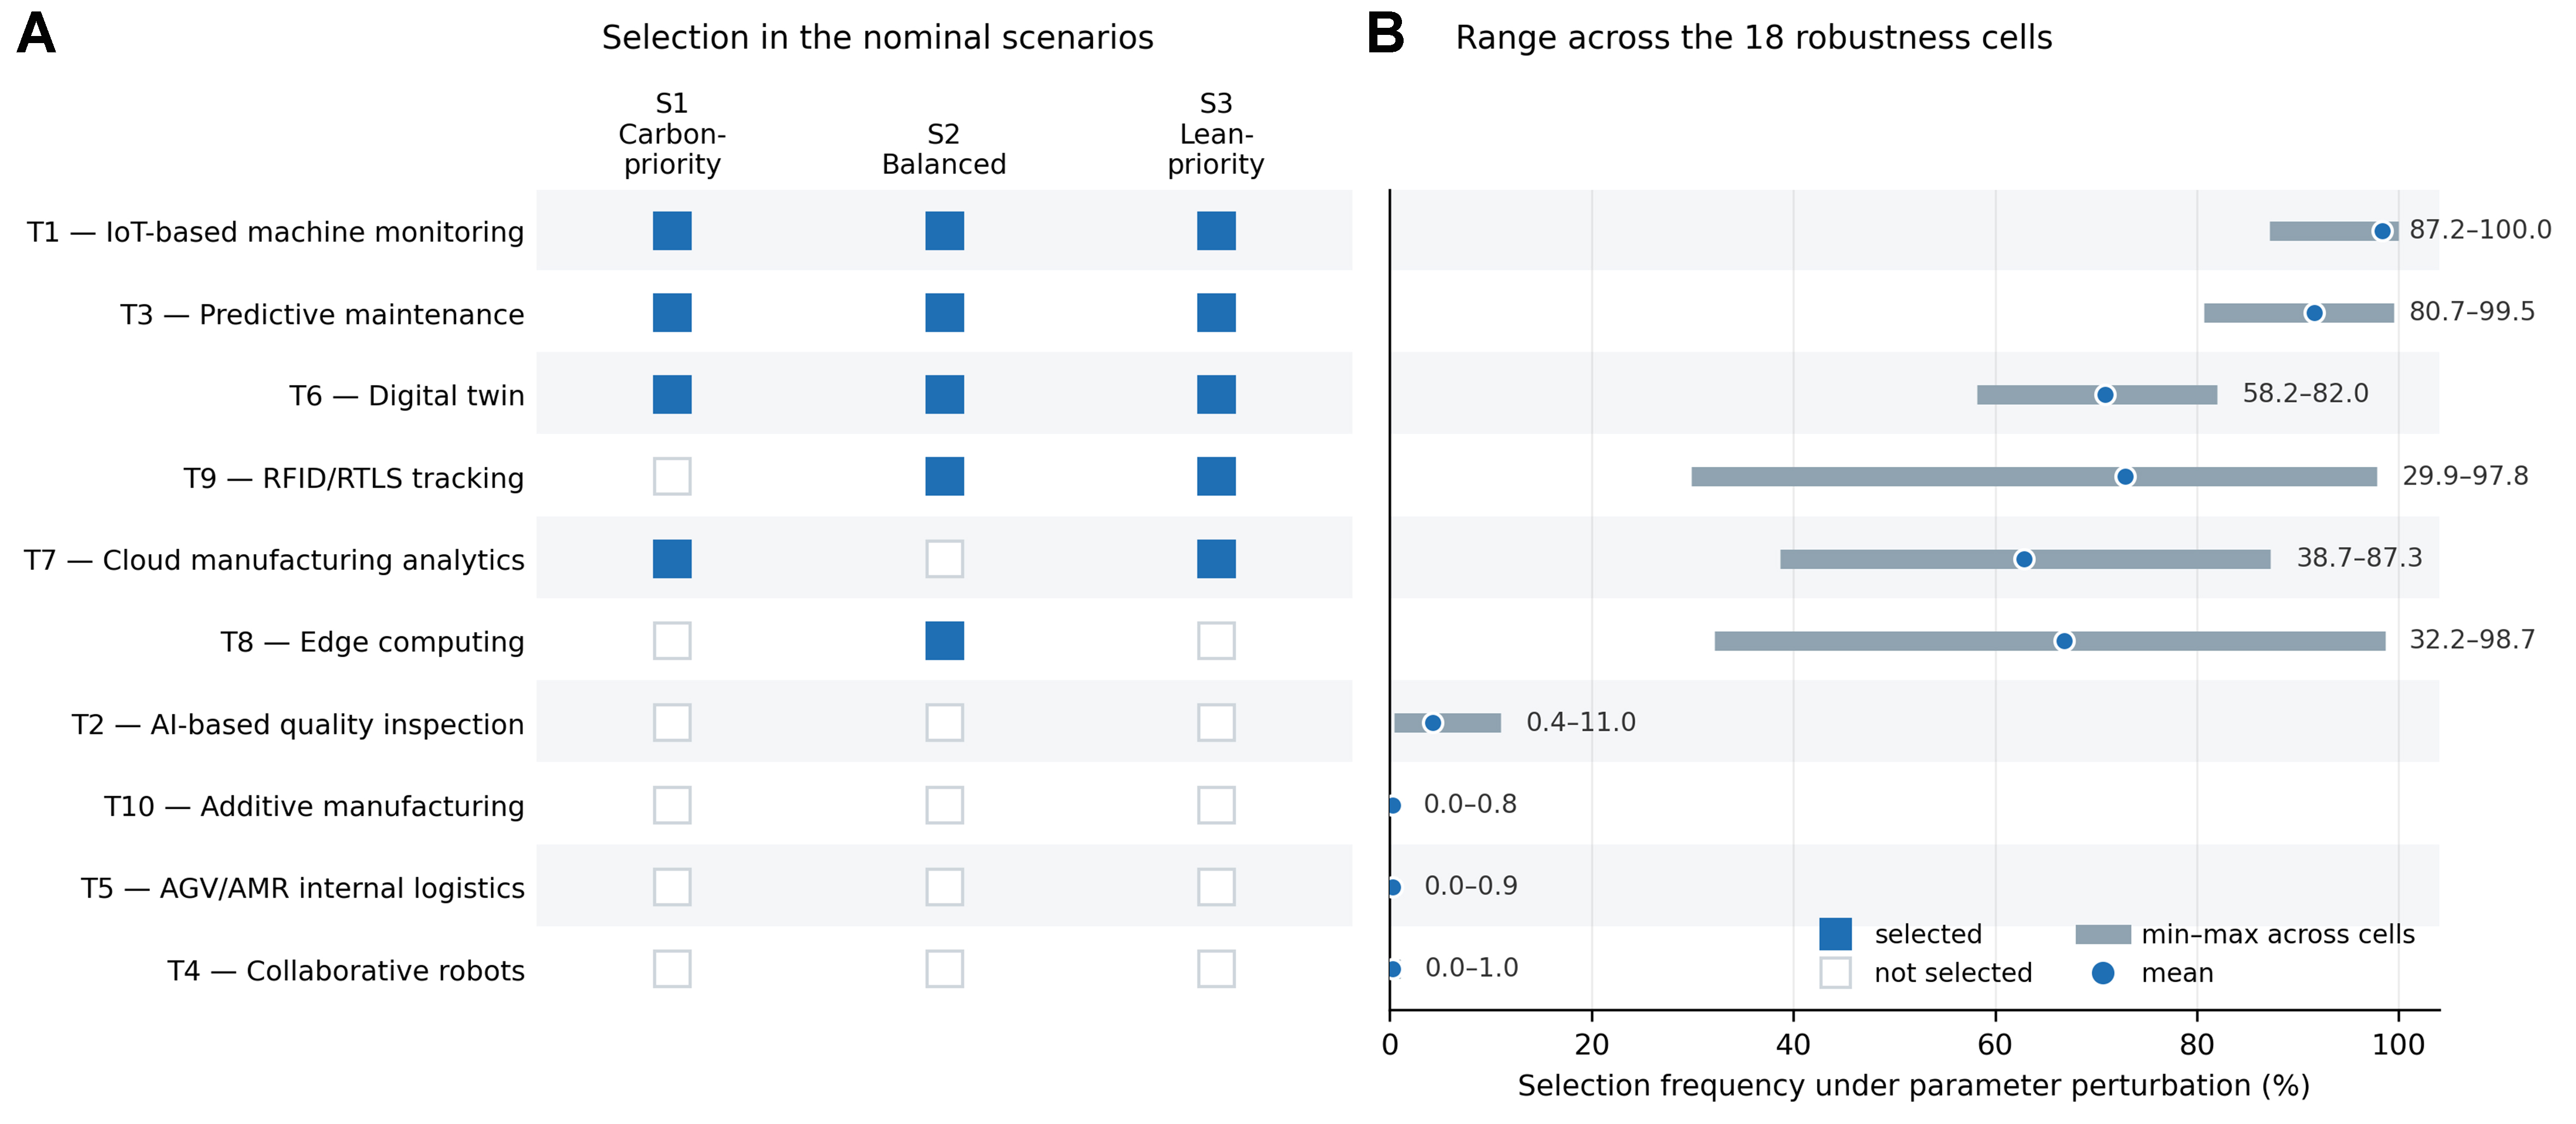
Figure 8. Nominal technology selection and selection-frequency ranges under parameter uncertainty. (A) Selection in the nominal scenarios; (B) Range across the 18 robustness cells. IoT: Internet of Things; RFID: radio frequency identification; RTLS: real-time location system; AI: artificial intelligence; AGV: automated guided vehicle; AMR: autonomous mobile robot.
IoT-based machine monitoring (T1) and predictive maintenance (T3) exhibit the highest selection stability. Across the 18 cells, T1 is selected in 87.2% to 100% of replications and T3 in 80.7% to 99.5%. The high frequency of T1 is partly structural, since it serves as a prerequisite for three other technologies under the baseline and strengthened configurations; its frequency decreases when these relationships are removed in the relaxed configuration. T3, by contrast, is not a prerequisite for another technology and remains highly selected across the alternative dependency structures.
The three dependency configurations yield broadly similar exact-reproduction rates. Holding the perturbation level and preference scenario fixed, exact reproduction of the nominal portfolio varies by at most 4.5 percentage points across the configurations. The clearest technology-level effect concerns T1, whose selection frequency decreases under the relaxed configuration when its prerequisite role is removed. This confirms that part of T1’s apparent stability is structural rather than attributable solely to its carbon and lean value parameters. Apart from this effect, the alternative dependency configurations produce relatively small changes in the overall portfolio-stability pattern.
The digital twin (T6), cloud manufacturing analytics (T7), edge computing (T8), and RFID/RTLS tracking (T9) show greater sensitivity to the perturbed parameters and preference scenarios. Across these four technologies, selection frequencies span 29.9% to 98.7% across the experimental cells. In particular, T6, although selected in all three nominal portfolios, varies between 58.2% and 82.0%, indicating greater parameter sensitivity than T1 and T3. AI-based quality inspection (T2), collaborative robots (T4), AGV/AMR internal logistics (T5), and additive manufacturing (T10) are selected in no more than 11.0% of replications in any cell. These results apply to the perturbation ranges and dependency configurations examined and should not be interpreted as general rankings of the technologies.
The robustness results therefore qualify the nominal interpretation in Section “Computational results”. T1 and T3 exhibit the highest cross-scenario selection stability, whereas the repeated selection of T6 in the nominal solutions is more sensitive to the assumed parameter values. The identification of candidate core technologies is consequently dependent not only on the nominal optimization results but also on their stability under parameter uncertainty.
Portfolio composition is less stable than technology-level selection. At ρ = 0.10, the nominal portfolio is reproduced in approximately 61% to 67% of replications for the carbon-priority and balanced scenarios and about 33% for the lean-priority scenario. At ρ = 0.20, exact reproduction rates fall to approximately 16% to 35% [Supplementary Table 10]. Thus, individual technology selection patterns remain more stable than the exact composition of the complete portfolio when multiple inputs are perturbed simultaneously.
Weight breakpoints and Pareto-efficiency validation
The effect of preference weights and the efficiency of the goal-programming solutions can be examined exactly because all candidate portfolios can be enumerated. For a fixed portfolio, the objective is linear in the lean preference weight wL, with wC = 1 - wL. The optimal portfolio therefore changes only at intersections between portfolio-specific objective functions. Over the open interval (0 < wL < 1), three optimal portfolio regions are obtained, as reported in Table 10 and illustrated in Figure 9.
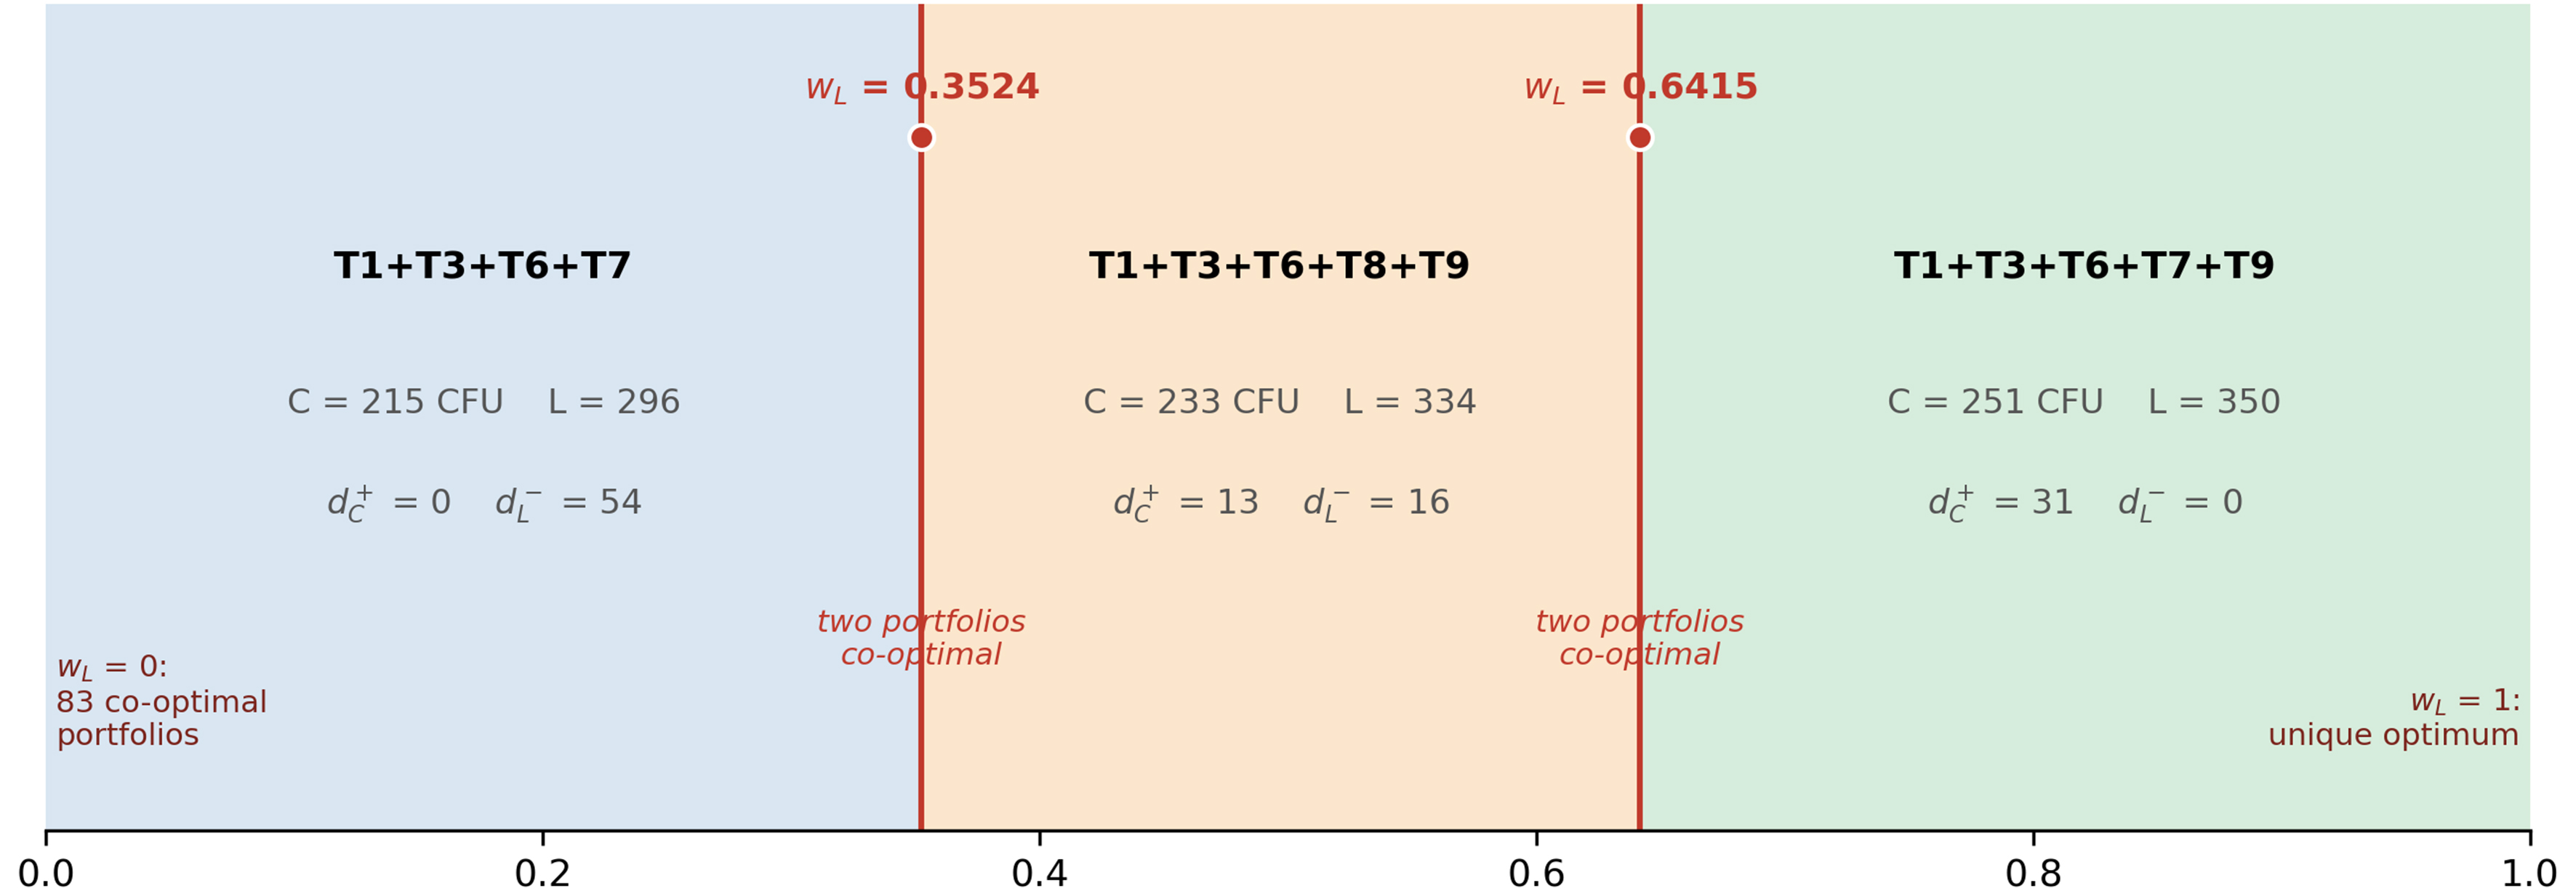
Figure 9. Weight regions and breakpoints of the optimal portfolio.
Weight regions of the optimal portfolio
| Lean weight region | Selected technologies | Total carbon | Lean value | Carbon excess | Lean shortfall |
| 0 < wL < 0.3524 | T1, T3, T6, T7 | 215 | 296 | 0 | 54 |
| 0.3524< wL < 0.6415 | T1, T3, T6, T8, T9 | 233 | 334 | 13 | 16 |
| 0.6415 < wL < 1 | T1, T3, T6, T7, T9 | 251 | 350 | 31 | 0 |
At wL = 0.3524, the first and second portfolios are co-optimal, while at wL = 0.6415, the second and third portfolios are co-optimal. The endpoints represent limiting cases: at wL = 0, only carbon excess is penalized, and 83 feasible portfolios attain zero deviation, whereas at wL = 1, the lean-priority portfolio is the unique optimum. The balanced setting (wL = 0.50) lies farther from a breakpoint than the carbon-priority (wL = 0.30) and lean-priority (wL = 0.70) settings, with distances to the nearest breakpoint of approximately 0.142, 0.052, and 0.058, respectively.
Complete enumeration yields 31 Pareto-efficient portfolios in the carbon–lean objective space. All three goal-programming solutions belong to this efficient set, confirming that none is dominated under the baseline parameter setting. Supplementary Table 11 reports the complete frontier.
Only 6 of the 31 efficient portfolios are supported efficient solutions; the remaining 25 are unsupported and therefore cannot be generated by a conventional positive weighted-sum scalarization of portfolio carbon and lean value. The carbon-priority solution T1 + T3 + T6 + T7, with 215 CFU and a lean value of 296, is one of these unsupported solutions. The goal-programming formulation can reach such a portfolio because it minimizes one-sided deviations from aspiration levels rather than a linear weighted sum of the two portfolio objectives.
GP does not generally guarantee Pareto efficiency because improvements beyond an aspiration level may remain unpenalized. The solutions obtained here are efficient by direct enumeration. Where a goal-programming optimum is dominated, or multiple solutions share the same primary objective value, a secondary Pareto-refining optimization can be applied after fixing the optimal goal-programming value. An ε-constraint formulation could likewise generate the efficient frontier; complete enumeration is used here because the 10-technology illustrative application contains only 210 =1,024 candidate portfolios, making exact evaluation computationally tractable.
MANAGERIAL IMPLICATIONS
The proposed GP framework provides a structured basis for planning Industry 4.0 investments under carbon, lean value, budget, implementation-capacity, and technology-dependency considerations. Because the numerical application uses illustrative parameters, the resulting portfolios should be interpreted as context-specific model outcomes rather than general technology recommendations. In a firm-specific application, the same framework can be populated with company data to support portfolio planning under the organization’s own constraints and priorities.
First, the results emphasize the importance of evaluating Industry 4.0 technologies as an interdependent portfolio rather than as isolated investments. The attractiveness of a technology depends not only on its own carbon burden and lean contribution but also on shared targets, resource limits, and prerequisite relationships. Infrastructure and dependency conditions should therefore be considered explicitly when defining feasible adoption portfolios.
Second, the framework makes the carbon–lean trade-off explicit. In the illustrative application, the carbon-priority scenario avoids carbon excess but leaves a lean value shortfall, whereas the lean-priority scenario attains the lean target at the cost of higher carbon burden. The balanced scenario provides an intermediate portfolio. The model therefore translates competing strategic priorities into comparable portfolio-level consequences.
Third, repeated selection should be interpreted together with robustness. Under the nominal parameter set, IoT-based monitoring, predictive maintenance, and the digital twin are selected in all three preference scenarios. The robustness analysis shows that IoT-based monitoring and predictive maintenance have the highest selection stability under simultaneous parameter perturbation, whereas the digital twin is more sensitive to the assumed values. Their selection therefore reflects the specified carbon, lean value, cost, implementation-difficulty, and dependency parameters rather than evidence of general technological superiority. The managerial value of the framework lies in identifying technologies that remain attractive within a particular decision context and in distinguishing stable selections from parameter-sensitive ones.
Fourth, carbon targets and financial resources should be considered jointly. Additional budget improves portfolio performance only up to a threshold, and its value depends on the carbon aspiration level. Under stricter carbon targets, additional financial capacity may have little effect because higher-lean-value portfolios also carry additional carbon burden. Industry 4.0 investment planning should therefore not be treated as a purely financial allocation problem.
The life-cycle-oriented carbon structure also distinguishes the sources of technology-attributable burden across production, operation, maintenance, and end-of-life stages. This can support more targeted carbon-management actions, such as lower-carbon procurement, cleaner electricity supply, efficient computing infrastructure, and improved end-of-life treatment. Since the model does not estimate net plant-level carbon abatement, technology-enabled energy savings or avoided emissions should be evaluated separately when relevant to the investment decision.
How managers can implement this model in practice
The framework can be implemented through a five-step decision process. First, managers define the decision scope by specifying the plant or value stream, planning horizon, candidate technologies, and the existing digital infrastructure that forms the reference configuration. Second, technology-level inputs are assembled. Carbon parameters should be estimated on a consistent system boundary and planning-horizon basis using available firm-specific, supplier, or life-cycle data, while lean contribution scores and dimension weights can be elicited using the procedure described in Section “Construction of lean value parameter”. Investment costs and implementation-capacity requirements should likewise reflect the firm’s own deployment conditions.
Third, managers specify the decision constraints and aspiration levels. This includes the available investment budget and implementation capacity, the technology dependencies associated with the firm’s existing architecture, and the carbon and lean value targets. Carbon coefficients and the carbon target should be expressed on the same accounting basis.
Fourth, the model is solved under alternative managerial preference settings rather than relying on a single weight combination. Scenario solutions and the weight-breakpoint analysis in Section “Weight breakpoints and Pareto-efficiency validation” can then be used to identify the portfolio changes associated with different strategic priorities.
Finally, the robustness analysis described in Section “Robustness Analysis” can be applied using uncertainty ranges appropriate to the quality of the available data. Technologies that remain frequently selected across plausible parameter and dependency settings can then be distinguished from selections that are more sensitive to the underlying assumptions. The model inputs can subsequently be updated as firm-specific implementation and operational data become available.
Table 11 summarizes the principal findings and their managerial implications.
Key model-based findings and corresponding managerial implications
| Model-based findings from the illustrative application | Managerial implication |
| IoT-based monitoring, predictive maintenance, and the digital twin are selected in all three nominal scenarios, while robustness is strongest for the first two and lower for the digital twin | Use the framework to identify candidate core technologies under firm-specific carbon, value, cost, capacity, and dependency assumptions. Do not generalize the illustrative ranking without empirical calibration |
| Cloud manufacturing analytics, edge computing, and RFID/RTLS tracking vary across preference scenarios and parameter perturbations | Treat scenario-sensitive technologies as conditional additions whose selection depends on carbon targets, budget availability, implementation capacity, and strategic emphasis |
| Preference weights shift the portfolio from carbon-conservative to lean-oriented solutions | Use goal weights to make the strategic stance explicit and quantify the consequences of prioritizing carbon control or lean value creation |
| Carbon targets strongly affect the selected digital transformation pathway | Set carbon targets deliberately, recognizing that stricter targets may reduce attainable lean value under limited resources |
| Budget increases improve performance only up to a threshold | Avoid treating investment planning as a purely financial allocation problem; when budget is no longer binding, focus on carbon-target performance, implementation capacity, and integration capability |
| Technology dependency constraints affect portfolio feasibility | Plan Industry 4.0 adoption as an interdependent portfolio in which prerequisite infrastructure is available for dependent technologies |
| Decompose technology-attributable carbon burden into production-stage, operational, maintenance-related, and end-of-life components | Direct carbon-reduction actions toward the dominant source of technology-attributable carbon burden, such as procurement, energy use, maintenance, or end-of-life management |
CONCLUSION
The rapid diffusion of Industry 4.0 technologies, such as AI, robotics, cloud computing, digital twins, and the Internet of Things, creates both operational opportunities and environmental concerns. These technologies can improve efficiency and support lean value creation, but they may also generate technology-attributable carbon burdens through hardware requirements, energy consumption, data processing, maintenance needs, and digital infrastructure. This study addressed this decision problem by proposing a GP-based framework for selecting Industry 4.0 technology portfolios under carbon burden and lean value considerations.
The proposed binary GP model minimizes deviations from predefined carbon and lean value targets. The model considers technology-attributable, life-cycle-oriented carbon burden, investment costs, implementation difficulty, lean value contributions, and technology dependency relationships. In this way, it evaluates Industry 4.0 investments as an interdependent portfolio rather than as isolated technology choices.
The numerical application showed that different managerial priorities yield distinct portfolios. The carbon-priority scenario avoided carbon excess but resulted in a lean value shortfall, whereas the lean-priority scenario achieved the lean value target but generated carbon excess. The balanced scenario provided an intermediate solution. Sensitivity analyses further showed that preference weights, carbon targets, and budget levels affect portfolio selection. In the illustrative parameter setting, IoT-based monitoring, predictive maintenance, and the digital twin were selected in all three nominal portfolios, while the robustness analysis showed higher selection stability for the first two than for the digital twin. This illustrates how the framework can distinguish relatively stable selections from parameter-sensitive technologies under specified assumptions.
The study contributes to sustainable operations and carbon-aware digital transformation research by integrating carbon control and lean value creation in a unified optimization model. From a managerial perspective, the framework helps decision-makers compare alternative digital transformation strategies, identify feasible technology portfolios, and align Industry 4.0 investment decisions with carbon and operational targets.
The findings should be interpreted within the scope of the numerical application. The parameter set is illustrative and literature-informed rather than based on measured firm-level data. The carbon parameter follows a life-cycle-oriented structure, but the study does not perform a full life-cycle assessment for each technology and does not estimate net plant-level carbon abatement enabled by the selected technologies. The baseline formulation also treats technology-level carbon and lean value parameters as adjusted decision inputs and does not endogenously estimate synergies, overlaps, or diminishing returns among technologies.
Future research may extend the framework by incorporating firm-specific life-cycle assessment data, structured expert elicitation for lean value scores, stochastic or fuzzy parameters, supply chain-wide carbon impacts, and multi-period investment planning. Further extensions may also include baseline-dependent avoided emissions or portfolio-level interaction terms when reliable company-specific operational and deployment data are available.
DECLARATIONS
Authors’ contributions
Made substantial contributions to conception and design of the study, and performed data interpretation: Paksoy, T.; Ervural, B.
Performed data and sensitivity analysis, as well as formulated the mathematical model: Ervural, B.; Paksoy, T.
Drafted the manuscript, reviewed, and approved the final version for submission: Paksoy, T.; Ervural, B.
Availability of data and materials
The data supporting the findings of this study are available within this Article and its Supplementary Materials. Further data are available from the corresponding authors upon request.
AI and AI-assisted tools statement
During the preparation of this manuscript, the AI tool ChatGPT (GPT-5.6 Sol, released 2026-07-09) was used solely for language editing. The tool did not influence the study design, data collection, analysis, interpretation, or the scientific content of the work. All authors take full responsibility for the accuracy, integrity, and final content of the manuscript.
Financial support and sponsorship
None.
Conflicts of interest
All authors declared that there are no conflicts of interest.
Ethical approval and consent to participate
Not applicable.
Consent for publication
Not applicable.
Copyright
© The Author(s) 2026.
Supplementary Materials
REFERENCES
1. Ghobakhloo, M.; Fathi, M. Corporate survival in industry 4.0 era: the enabling role of lean-digitized manufacturing. J. Manuf. Technol. Manag. 2020, 31, 1-30.
2. Gündüz, M. A.; Demir, S.; Paksoy, T. Road-mapping for smart and lean tools with a sustainability perspective: a new model proposal. J. Transp. Logist. 2024, 9, 83-96.
3. Satoglu, S.; Ustundag, A.; Cevikcan, E.; Durmusoglu, M. B. Lean production systems for Industry 4.0. In Industry 4.0: managing the digital transformation. Cham: Springer International Publishing; 2018. pp. 43-59.
4. Rossini, M.; Cifone, F. D.; Kassem, B.; Costa, F.; Portioli-Staudacher, A. Being lean: how to shape digital transformation in the manufacturing sector. J. Manuf. Technol. Manag. 2021, 32, 239-59.
5. Guan, R.; Wang, H.; Zheng, R.; Shi, X.; Wang, K. Evaluating the impact of digital technologies on energy efficiency: evidence from Chinese publicly listed companies. Energy. Policy. 2025, 207, 114847.
6. Kim, J.; Kim, J.; Sovacool, B. K.; et al. Reviewing the socio-technical dynamics of AI, data centers and digitalization on energy and the environment. Renew. Sustain. Energy. Rev. 2026, 234, 116861.
7. Sarıışık, G.; Göncü, B.; Öğütlü, A. S. Harnessing industry 4.0 technologies to reduce SMEs’ carbon footprint: a machine learning-based assessment. J. Environ. Manage. 2026, 398, 128459.
8. Arana-Landín, G.; Uriarte-Gallastegi, N.; Landeta-Manzano, B.; Laskurain-Iturbe, I. The contribution of lean management - industry 4.0 technologies to improving energy efficiency. Energies 2023, 16, 2124.
9. Zhu, M.; Liang, C.; Lee, P. K. C.; Yeung, A. C. L.; Zhou, H. Does digital technologies deployment promote environmental performance? Evidence from China. IEEE. Trans. Eng. Manage. 2026, 73, 712-25.
10. Khan, M. I.; Yasmeen, T.; Khan, M.; et al. Integrating industry 4.0 for enhanced sustainability: pathways and prospects. Sustain. Prod. Consum. 2025, 54, 149-89.
11. Bonello, A.; Refalo, P.; Francalanza, E.; Gauci, M. Integrating environmental life cycle assessment in assistive technology selection for inclusive workstations: a novel multi-objective optimisation approach in industry 5.0. Clean. Eng. Technol. 2026, 32, 101245.
12. Almeida, R. P.; Ayala, N. F.; Benitez, G. B.; Kliemann Neto, F. J.; Frank, A. G. How to assess investments in Industry 4.0 technologies? A multiple-criteria framework for economic, financial, and sociotechnical factors. Prod. Plan. Control. 2023, 34, 1583-602.
13. Javaid, M.; Khan, S.; Haleem, A.; Rab, S. Adoption of modern technologies for implementing industry 4.0: an integrated MCDM approach. Benchmarking 2023, 30, 3753-90.
14. Vohra, K.; Sinha, A. K.; Anand, A. Development of Industry 4.0 based technology selection index using multi criteria decision making. RAIRO. Oper. Res. 2024, 58, 5185-209.
15. Maretto, L.; Faccio, M.; Battini, D. Industry 4.0 technology implementation in manufacturing: a selection method and real case applications. Int. J. Prod. Res. 2025, 63, 3142-74.
16. Santos, A. D. M.; Sant’anna, ÂMDO.; Barbosa, A. S.; Becker, A. M.; Ayala, N. F. Multi-criteria decision-making model for sustainability functions integrated Industry 4.0 technologies within small and medium enterprises in emerging countries. Int. J. Product. Perform. Manag. 2025, 74, 1614-43.
17. Kamble, S.; Gunasekaran, A.; Dhone, N. C. Industry 4.0 and lean manufacturing practices for sustainable organisational performance in Indian manufacturing companies. Int. J. Prod. Res. 2020, 58, 1319-37.
18. Varela, L.; Araújo, A.; Ávila, P.; Castro, H.; Putnik, G. Evaluation of the relation between lean manufacturing, Industry 4.0, and sustainability. Sustainability 2019, 11, 1439.
19. Saad, S. M.; Bahadori, R.; Bhovar, C.; Zhang, H. Industry 4.0 and lean manufacturing - a systematic review of the state-of-the-art literature and key recommendations for future research. Int. J. Lean. Six. Sigma. 2024, 15, 997-1024.
20. Grigorescu, A.; Lincaru, C.; Pirciog, C. S. The impact of cloud computing on mass and energy flows: greenhouse gas emissions in the IT and communications sectors at the European level (2014-2021). Processes 2025, 13, 1808.
21. Pirson, T.; Bol, D. Assessing the embodied carbon footprint of IoT edge devices with a bottom-up life-cycle approach. J. Clean. Prod. 2021, 322, 128966.
22. Gütmen, S.; Roy, S. K.; Weber, G. An overview of weighted goal programming: a multi-objective transportation problem with some fresh viewpoints. Cent. Eur. J. Oper. Res. 2024, 32, 557-68.
23. Karakutuk, S. S.; Ornek, M. A. A goal programming approach to lean production system implementation. J. Oper. Res. Soc. 2023, 74, 403-16.
24. Aouni, B.; Colapinto, C.; La Torre, D. Financial portfolio management through the goal programming model: current state-of-the-art. Eur. J. Oper. Res. 2014, 234, 536-45.
25. Mohseny-Tonekabony, N.; Sadjadi, S. J.; Mohammadi, E.; Tamiz, M.; Jones, D. F. Robust, extended goal programming with uncertainty sets: an application to a multi-objective portfolio selection problem leveraging DEA. Ann. Oper. Res. 2025, 346, 1497-552.
26. Brandenburg, M. Low carbon supply chain configuration for a new product - a goal programming approach. Int. J. Prod. Res. 2015, 53, 6588-610.
27. Chung, K.; Chiu, R. Optimizing sustainable electronics supply chains under carbon taxation and fuzzy demand: a multi-goal programming approach. Sustainability 2026, 18, 1686.
28. Sanders, A.; Elangeswaran, C.; Wulfsberg, J. Industry 4.0 implies lean manufacturing: research activities in industry 4.0 function as enablers for lean manufacturing. J. Ind. Eng. Manag. 2016, 9, 811.
29. Pagliosa, M.; Tortorella, G.; Ferreira, J. C. E. Industry 4.0 and lean manufacturing: a systematic literature review and future research directions. J. Manuf. Technol. Manag. 2019, 32, 543-69.
30. Buer, S.; Strandhagen, J. O.; Chan, F. T. S. The link between Industry 4.0 and lean manufacturing: mapping current research and establishing a research agenda. Int. J. Prod. Res. 2018, 56, 2924-40.
31. Shah, R.; Ward, P. T. Defining and developing measures of lean production. J. Oper. Manag. 2007, 25, 785-805.
32. Pandya, D.; Kumar, G.; Singh, S. Aligning sustainability goals of industrial operations and marketing in Industry 4.0 environment for MSMEs in an emerging economy. J. Bus. Ind. Mark. 2024, 39, 581-602.
33. World Resources Institute. Greenhouse gas protocol product life cycle accounting and reporting standard. 2011. https://www.wri.org/research/greenhouse-gas-protocol-product-life-cycle-accounting-and-reporting-standard. (accessed 2026-10-15).
34. Hanafy, W. A.; Sukprasert, T.; Souza, A.; Irwin, D.; Shenoy, P. Untangling the carbon-cost tradeoffs and stampede effect challenges in cloud computing. IEEE. Trans. Comput. 2026, 75, 2715-29.
35. Cao, Z.; Wang, R.; Zhou, X.; et al. Adaptive capacity provisioning for carbon-aware data centers: a digital twin-based approach. IEEE. Trans. Sustain. Comput. 2025, 10, 730-43.
36. Zhao, D.; Zhou, J.; Li, K. CFWS: DRL-based framework for energy cost and carbon footprint optimization in cloud data centers. IEEE. Trans. Sustain. Comput. 2025, 10, 95-107.
37. Mishra, S.; Singh, S. P. Carbon management framework for sustainable manufacturing using life cycle assessment, IoT and carbon sequestration. Benchmarking 2021, 28, 1396-409.
38. Gupta, U.; Kim, Y. G.; Lee, S.; et al. Chasing carbon: the elusive environmental footprint of computing. arXiv 2020, arXiv:2011.02839. https://doi.org/10.48550/arXiv.2011.02839. (accessed 2026-10-15).
39. Olfati, M.; Krömer, P.; Fanati Rashidi, S.; Mirjalili, S.; Snášel, V. A goal programming-based algorithm for solving multi objective optimization problems. Ann. Oper. Res. 2025.
40. Huang, Z.; Yu, H.; Chu, X.; Peng, Z. A goal programming based model system for community energy plan. Energy 2017, 134, 893-901.
41. Shaw, K.; Shankar, R.; Yadav, S. S.; Thakur, L. S. Modeling a low-carbon garment supply chain. Prod. Plan. Control. 2013, 24, 851-65.
42. Kellner, F.; Lienland, B.; Utz, S. A multi‐criteria decision‐making approach for assembling optimal powertrain technology portfolios in low GHG emission environments. J. Ind. Ecol. 2021, 25, 1412-29.
43. ISO. ISO 14040:2006. Environmental management - Life cycle assessment - Principles and framework. https://www.iso.org/standard/37456.html. (accessed 2026-10-15).
44. ISO. ISO 14044:2006 - Environmental management - Life cycle assessment - Requirements and guidelines. https://www.iso.org/standard/38498.html. (accessed 2026-10-15).
46. ISO. ISO 13374-2:2007. Condition monitoring and diagnostics of machines - Data processing, communication and presentation. Part 2: Data processing. https://www.iso.org/standard/36645.html. (accessed 2026-10-15).
47. Kritzinger, W.; Karner, M.; Traar, G.; Henjes, J.; Sihn, W. Digital twin in manufacturing: a categorical literature review and classification. IFAC. PapersOnLine. 2018, 51, 1016-22.
48. Lu, Y.; Xu, X. Cloud-based manufacturing equipment and big data analytics to enable on-demand manufacturing services. Robot. Comput. Integr. Manuf. 2019, 57, 92-102.
49. Schmitt, J.; Bönig, J.; Borggräfe, T.; Beitinger, G.; Deuse, J. Predictive model-based quality inspection using machine learning and edge cloud computing. Adv. Eng. Inform. 2020, 45, 101101.
50. Thiede, S.; Sullivan, B.; Damgrave, R.; Lutters, E. Real-time locating systems (RTLS) in future factories: technology review, morphology and application potentials. Procedia. CIRP. 2021, 104, 671-6.
Cite This Article
 Open Access
How to Cite
Ervural, B.; Paksoy, T. A goal programming approach for balancing life-cycle carbon burden and lean value in Industry 4.0 portfolio selection. Carbon Footprints 2026, 5, 55. https://dx.doi.org/10.20517/cf.2026.106
Download Citation
Export Citation File:
Type of Import
Tips on Downloading Citation
Citation Manager File Format
Type of Import
Direct Import: When the Direct Import option is selected (the default state), a dialogue box will give you the option to Save or Open the downloaded citation data. Choosing Open will either launch your citation manager or give you a choice of applications with which to use the metadata. The Save option saves the file locally for later use.
Indirect Import: When the Indirect Import option is selected, the metadata is displayed and may be copied and pasted as needed.
About This Article
Special Topic
Copyright

Data & Comments
Data
0








Comments
Comments must be written in English. Spam, offensive content, impersonation, and private information will not be permitted. If any comment is reported and identified as inappropriate content by OAE staff, the comment will be removed without notice. If you have any queries or need any help, please contact us at support@oaepublish.com.