
Application of circular economy principles in the cheese production chain: pathways to minimize food loss and waste
 0
0 
Abstract
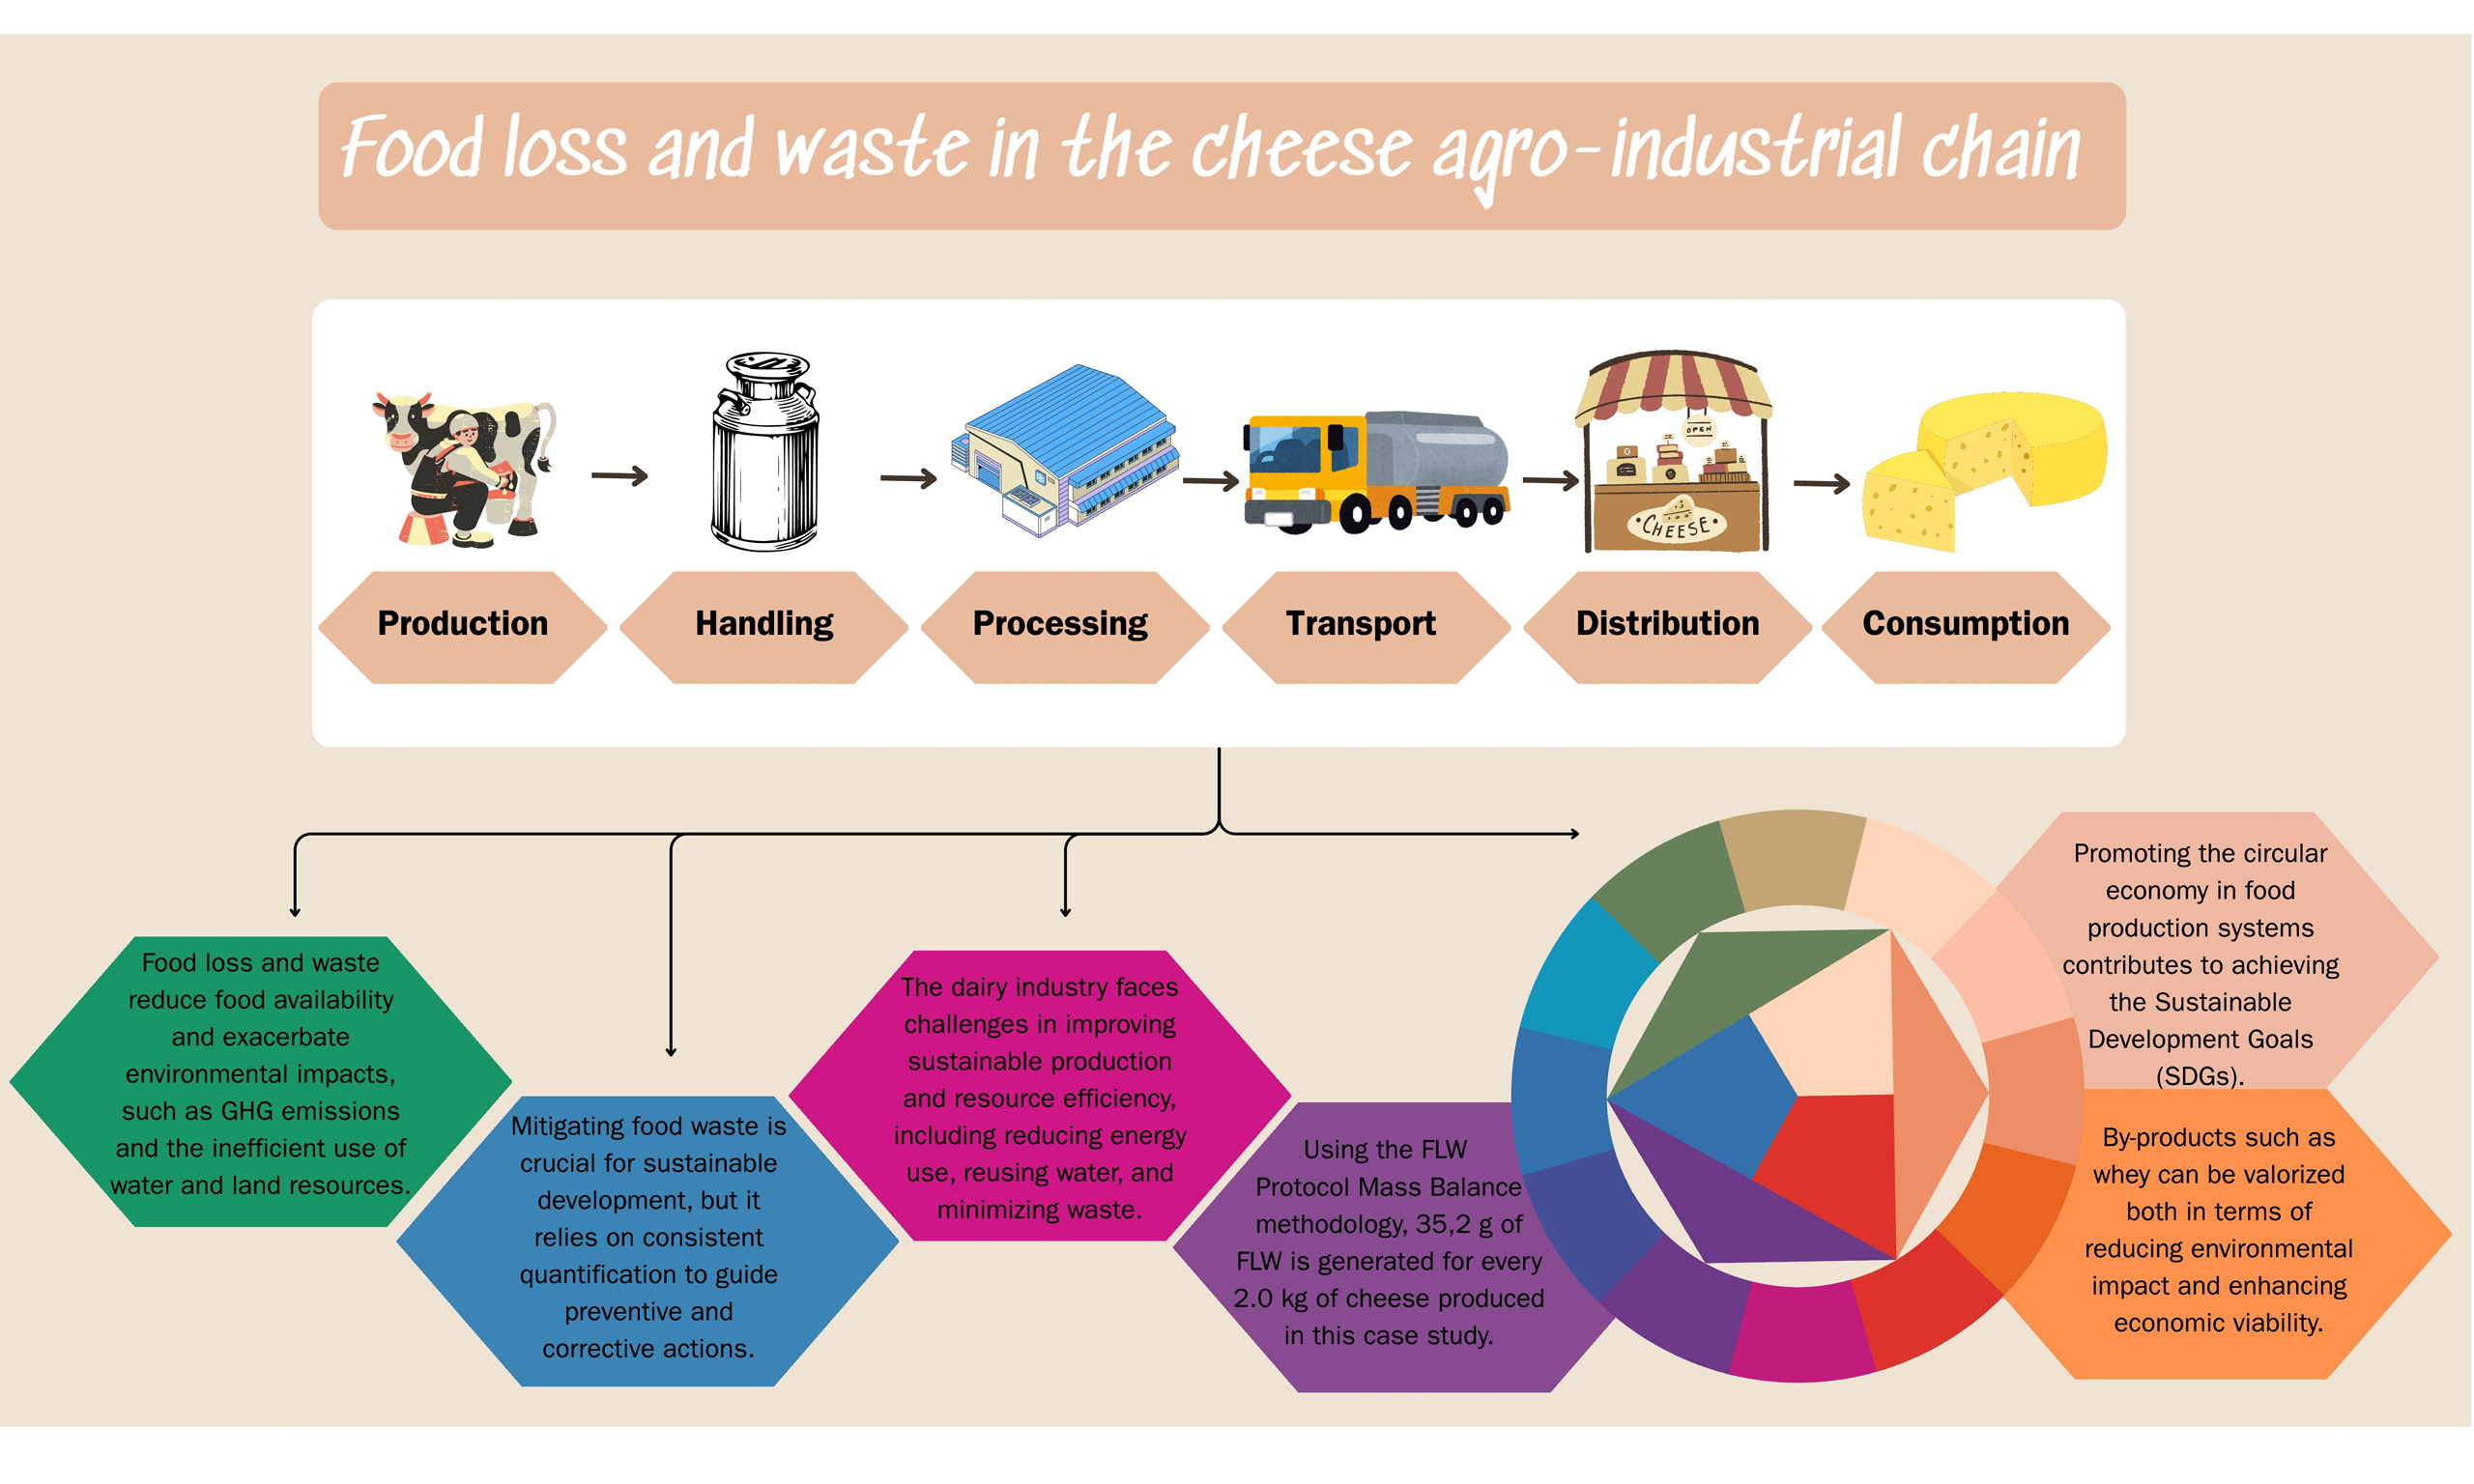
The circular economy is a strategic approach to optimizing resource use, offering potential to mitigate Food Loss and Waste. This study aims to analyze Loss and Waste from the perspective of the circular economy, focusing on the agro-industrial cheese production chain of Laticínios Alto Uruguai, located in the municipality of Lajeado do Bugre. Based on interviews and collected data, Loss and Waste were quantified over a 12-month period, grounded in the Mass Balance methodology of the “Loss and Waste Standard”. Drawing from the literature, reuse and recycling strategies aligned with the circular economy were proposed. A Loss and Waste value ranging from 35.2 g was identified for every 2.0 kg of cheese produced in the chain. Solutions such as water recovery from whey and energy generation via anaerobic reactors stand out as promising alternatives for Laticínios Alto Uruguai. It is recommended that future studies integrate quantification of greenhouse gas emissions using approaches such as Life Cycle Assessment or carbon inventories, enabling estimation of the mitigation potential associated with the circularity strategies discussed in this study.
Keywords
INTRODUCTION
It is estimated that between one-quarter and one-third of food produced for human consumption is lost or wasted[1]. At the same time, food insecurity is a growing concern amid rising global hunger, with one in eleven people undernourished - a situation linked to rapid population growth[1,2]. The negative impacts of food loss and waste (FLW) include pollution, environmental degradation, depletion of natural resources, increased carbon emissions, and exacerbation of food insecurity. FLW not only reflects inefficient use of already limited resources but also poses a significant barrier to achieving climate targets, environmental sustainability, and food system resilience[1,3,4]. Thus, FLW exacerbates environmental and economic challenges by increasing greenhouse gas (GHG) emissions and improperly using critical resources such as land, water, and energy, thereby placing substantial pressure on ecosystems[5,6]. In addition, the GHG emissions resulting from the disposal of discarded food in landfills contribute to climate change and hinder the achievement of environmental sustainability targets[6]. When considering population growth and limited natural resources, the impact of FLW is not restricted to economic issues; it also leads to serious environmental and social problems, making FLW a hot research topic, particularly over the past five years[1,6]. Reducing FLW not only generates economic gains but also contributes to lowering the carbon footprint and addressing climate change, since mitigating GHG emissions is one of the main challenges to be tackled in order to confront global climate issues and promote sustainable development[6,7].
In this context, strategies to mitigate FLW are emerging as key issues in achieving sustainable development[8]. However, initiatives addressing corrective and preventive measures for food waste must be supported by quantification efforts in both developed and developing countries[9].
Quantitative methods assist in the management of FLW by describing current contexts, predicting future scenarios, and improving related operations[4]. In addition, they are important for reduction efforts and can offer a variety of benefits, including reducing costs associated with purchasing food and excessive disposal, preventing GHG emissions, and supporting efforts to eliminate hunger[10]. The Food and Agriculture Organization (FAO)[11] developed a refined method to estimate FLW at different stages of food supply chains (FSCs)[12], resulting in the development of the Food Loss and Waste Standard (FLW Protocol). The protocol is a partnership between the United Nations Environment Programme and the World Resources Institute, aiming to provide a standardized accounting and reporting framework for food waste throughout the FSC[13].
The FLW Standard aims to provide requirements and guidance for quantifying and reporting the weight of food and/or associated inedible parts removed from the FSC[10].
Within the food production and consumption system, milk stands out as one of the world’s most important agricultural commodities, ranking among the top five products in both volume and value[14]. Over the past twenty years, global milk production increased from 304 million tons to 883 million tons, representing a 52% rise[15]. This growth highlights the importance of milk in human nutrition and the increasing global demand for dairy products[16].
Brazil is the third-largest milk producer globally[15]. In 2021, the country produced 25.3 billion liters of milk. The state of Rio Grande do Sul (RS) ranks as the second-largest milk-producing state, accounting for 15.1 billion liters[14].
The ten main milk-producing mesoregions in Brazil account for 43.37% of the country’s total production, with the Northwest Rio-Grandense mesoregion standing out as the top national producer, responsible for 2.97 billion liters (8.41% of Brazilian milk)[14].
Considering the rising per capita consumption of dairy products, the annual increase rate has been 1.2%[17]. This growing demand leads to a global trend toward intensified production systems to supply consumer markets[16]. Consequently, the industry faces operational challenges to achieve better performance in terms of sustainable production standards and resource efficiency, including reduced energy use, water reuse, and waste minimization[18,19,20].
According to the work by Scherhaufer et al.[21], FLW prevention should be prioritized in the meat and dairy supply chains, as these sectors account for the highest environmental impacts. To mitigate these impacts, research should focus on developing solutions that enable the valorization of FLW as usable resources[22]. This includes the development of technologies for the use or reuse of biocompatible materials derived from industrial waste, thereby contributing to the promotion and consolidation of the Circular Economy (CE) across different productive sectors[23].
The concept of the CE consists of a wide range of strategies aimed at reducing the environmental impact of production systems and consumption patterns by increasing the circularity of resources; this circularity is primarily associated with material efficiency strategies that close, slow, or narrow loops[24]. The CE is currently receiving increased attention due to its potential to significantly reduce the carbon footprint through waste minimization and resource efficiency[7], as well as its incorporation into public policies, such as the New Circular Economy Action Plan under the European Green Deal[25] and China’s 14th Five-Year Plan on CE[26]. The European plan includes a sustainable product initiative with a special focus on resource-intensive sectors such as textiles, construction, electronics, and plastics[25].
China’s legislation, in turn, promotes resource conservation and recycling by setting goals to ensure national resource security, highlighting CE as a key approach to addressing climate change and achieving carbon neutrality by 2060[26].
According to the work by Rood et al.[27], promoting CE in food production systems contributes to achieving the Sustainable Development Goals (SDGs), such as ending hunger and ensuring food security and sustainable agriculture (SDG 2); ensuring health and well-being (SDG 3); halving food waste (SDG 12.3); reducing marine pollution (SDG 14.1); and halting land degradation (SDG 15.3).
Regarding the global dairy FSC, estimated FLW levels reach 19.9%[11]. In Latin America, the FLW percentage in the dairy FSC is 23.5%[11], which is above the global average. Worldwide, the dairy sector generates between 4 and 11 million tons of dairy waste annually, posing a serious threat to the environment due to its high organic content[28]. In this context, the method provided by the FLW Standard allows countries, cities, companies, and organizations to develop inventories of FLW quantities and destinations. As such, it supports, informs, and guides strategies to minimize FLW, offering economic benefits, improved food security, more efficient use of natural resources, and reduced environmental impacts[10].
In the FAO report Global Food Losses and Food Waste, the main FLW points along the Cheese Agro-Industrial Chain (CAC) are identified. In the production stage, losses stem from reduced milk production due to dairy cow diseases (e.g., mastitis); in post-harvest handling and storage, losses occur due to milk spillage and spoilage during transport from the farm to distribution centers; in processing, losses include spills during milk treatment and processing into dairy products (e.g., cheese and yogurt); in distribution, waste includes market system losses; and in consumption, waste occurs at the household level[11].
Given this context, few studies have addressed the global challenge of reducing FLW from a circular economy perspective[29,30]. Therefore, this study seeks to answer two key questions: (1) What are the quantity and main sources of FLW along the Cheese CAC? (2) Can the identified FLW be reused in alignment with the circular economy approach?
METHODS
To address the research objectives, a case study was conducted at the company Dairy Industry Alto Uruguai (LAU), located in the municipality of Lajeado do Bugre (Latitude: 27°41’20” South, Longitude: 53°10’55” West), in the Northwest Mesoregion of RS, Brazil. LAU was selected due to the ease of access to data across its entire production chain, making it a pioneering example for applying the methodological principles of the FLW Protocol in the CAC. Initially, FLW will be quantified throughout the CAC using the Mass Balance methodology, in accordance with the “FLW Standard”. Subsequently, reuse and recycling solutions will be proposed from the perspective of the CE.
Mapping the case study chain
A literature review was conducted between January and April 2019 as a preparatory stage for data collection. In April, a visit to LAU was carried out to gain an understanding of the agro-industrialization process and to collect information through interviews. The interview with the technical manager of LAU was conducted in two stages. The first stage was based on the questionnaire developed by the World Resources Institute (https://flwprotocol.org/flw-standard/tools-resources/), aimed at assisting in the selection of a quantification method. The second stage included specific questions for this case study, covering information on LAU itself, the farms supplying milk, and the transport and distribution agents. The questionnaires were developed between February and April 2019 and applied during April and May 2019 to actors in the chain: rural producers, those responsible for the agro-industry, and the collection and transportation center. The interviews aimed to gather information on daily procedures and the occurrence of waste throughout the production chain. Figure 1 presents the stages involved in the CAC at LAU.
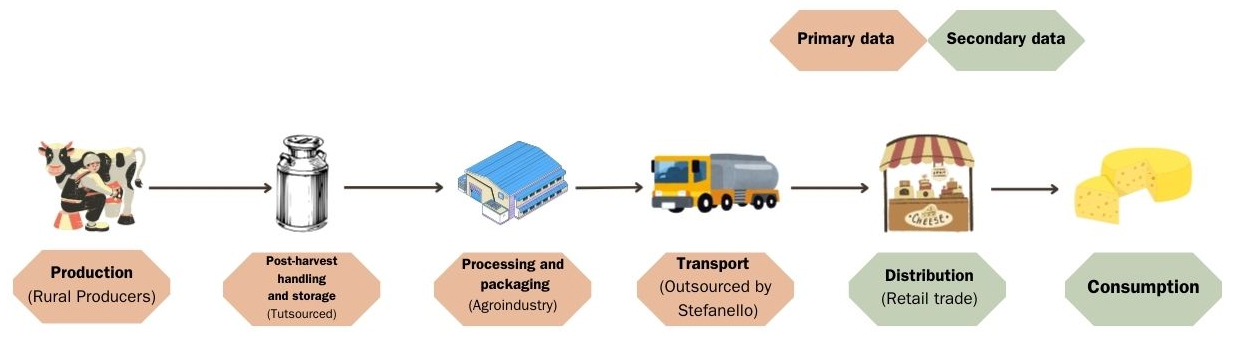
Figure 1. Stages of the Cheese Agribusiness Chain at Dairy Industry Alto Uruguai (LAU).
Food loss and waste quantification using the FLW standard
To identify and quantify FLW along LAU’s CAC, the Global Standard for measuring and reporting FLW (FLW Standard) developed by Hanson et al.[10] was used as a reference.
When preparing an inventory, the FLW Standard initially requires users to consider two components: material type and destination. The material type refers to the substance removed from the FSC, which can be quantified in three ways: food only, inedible parts only, or both[10,29]. The destination refers to which of the ten possible outcomes the removed material is directed to (e.g., animal feed; bio-based materials/biochemical processing; co-digestion/anaerobic digestion; composting/aerobic processes; controlled combustion; land application; landfill; not harvested/discarded; sewer/wastewater treatment; other)[29].
An FLW inventory requires users to define and report four components [10], which were used to analyze FLW at LAU [Table 1]:
Case Study Inventory in accordance with the FLW Standard
| Time frame | Type of material | Destination | Limit |
| June 2018 to May 2019 | The total weight of FLW was quantified for 2 kg of mozzarella cheese produced | Animal feed | Food category: dairy products |
| Landfill | Life cycle stage: from raw material arrival at the industry to transportation at the distributor | ||
| Sewage/water treatment | Geography: municipality of Lajeado do Bugre - RS – Brazil | ||
| Organization: dairy industry Alto Uruguai |
1. Timeframe: the reporting period for the inventory results, including company-provided information and data collection stages;
2. Material type: the types of materials included (food only, inedible parts only, or both);
3. Boundaries: including food category, lifecycle stage, geography, and organization;
4. Destination: where the removed materials are sent.
The inventory of dairy industry Alto Uruguai
The LAU inventory, in compliance with the FLW Standard, included information on the case study and data collection and analysis, as well as data on material type, destination, and boundaries. These details are summarized in Figure 2.
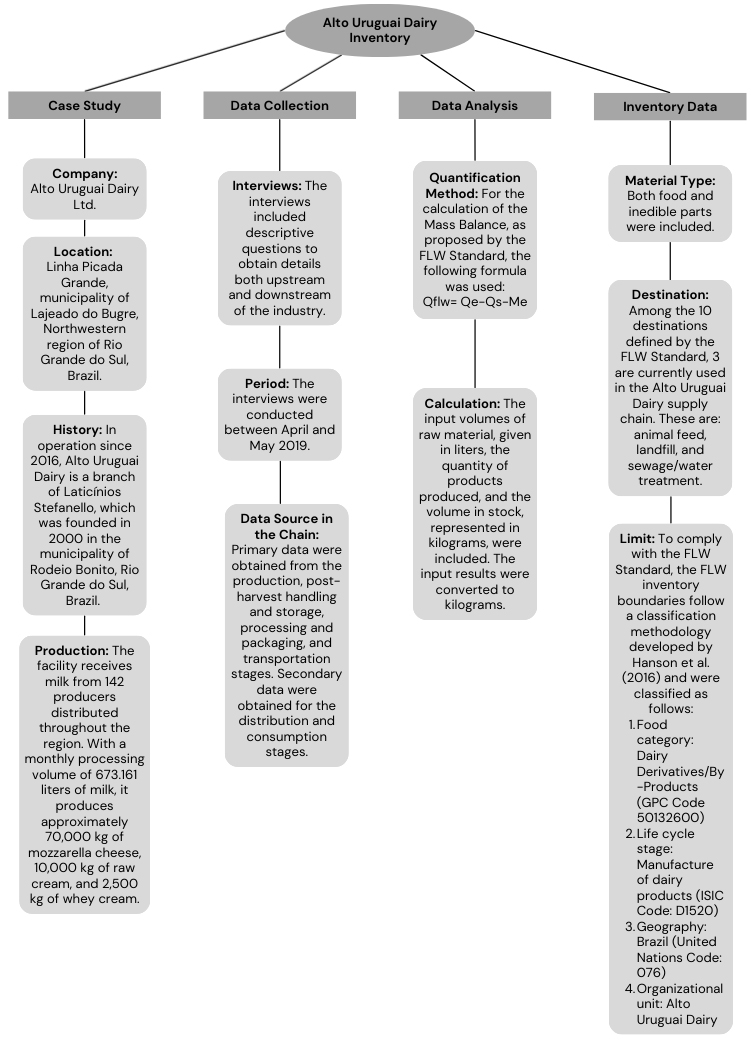
Figure 2. Inventory Information of Dairy Industry Alto Uruguai (LAU).
During the data collection phase, the first interview was conducted with the technical manager (veterinarian) in April 2019 to gather detailed information on the chain’s participants and the processing of raw materials within the plant. Interviews with 15 dairy farmers were conducted in May to obtain specific data on the milking process at each analyzed farm. Data on FLW at the retail (distribution) and consumer (consumption) levels were obtained from the literature[11,31].
By integrating the data provided by the company, the results of the interviews (technical manager and producers), and the literature findings, it was possible to quantify FLW in LAU’s CAC. To select the most appropriate quantification method among the ten available in the FLW Standard, the classification tool provided by the World Resources Institute website was used.
A spreadsheet created in Microsoft Excel 2013 was used to support the method selection. This tool guides users to the most suitable method based on certain criteria answered by the company representative.
Out of the ten possible methods, five were considered appropriate by the tool. Based on the available data, the Mass Balance method[10] was selected, as it measures inputs and outputs within the industrial process. According to the work by Lipinski[32], this is a reliable method for estimating FLW where inputs and outputs of a production process are accurately quantified, although it may involve challenges related to unit conversions and uncertainty levels.
It is important to note that the Mass Balance method was applied exclusively to the stages of post-harvest handling and storage, processing and packaging, and transportation. The production, distribution, and consumption stages were not quantified using this method due to the unavailability of data during the analyzed period (see Figure 1). Therefore, the available data were used to estimate the occurrence of FLW in each CAC stage, complementing the analysis.
Regarding inventory data, the material type included both food and inedible parts. The former refers to any substance or product, whether processed, partially processed, or unprocessed, intended for human consumption; the latter includes components associated with food that are not intended for human consumption[33,10].
Considering both food and inedible parts, losses and waste were quantified in the post-harvest handling and storage, processing and packaging, and transportation stages, based on the production of 2 kg of cheese. This calculation follows the FLW Standard guidelines. It is important to mention that packaging, effluents, and any other material not considered FLW were excluded from this analysis.
RESULTS AND DISCUSSION
Result of the FLW inventory by stage of the supply chain
Following the criteria established by Gustavsson et al.[11], along with the data obtained, FLW was identified and quantified at each stage of the CAC of LAU [Table 2].
FLW results by sector of the cheese agro-industrial chain of dairy industry Alto Uruguai (LAU)
| Chain stage | Description | FLW estimate | Observations |
| Production (rural producers) | Milk that remains trapped in the drum during draining This occurs every time the milking system is washed | It totals an estimated loss ranging from 0.38 to 0.75 tons per year | Milk collection on farms is mechanized |
| Post-harvest handling and storage | Milk is lost during handling, or it remains trapped in the tanker truck or pumping hose. It also includes milk used for quality testing, or that is normally lost due to antibiotic contamination | The FLW in the analyzed year represents a total of 51.00 tons, which is approximately 34.49% of the milk entering the agroindustry | Collection by truck at the farm and transported directly to the dairy processing plant, where quality tests are conducted |
| Processing and packaging (agroindustry) | Milk is lost during the cheese manufacturing process, including raw cream and whey cream. This mainly includes the whey currently destined for animal feed | The FLW totals an average of 5.44%, which is equivalent to 8.05 tons per year | Includes processing stages from milk handling to the production of final products |
| Transport | When transporting the products to the distribution center, the packaging may be damaged and the product lost. In this case, since the products are packaged in plastic, the packaging can be punctured or torn during transport or handling | The loss at this stage is approximately 0.65%, totaling about 0.96 ton in the analyzed year | Collection of the final product at the agro-industry, which is transported by truck to the distribution center in the municipality of Pinhal - RS |
| Distribution (retail trade) | Damaged products (e.g., rodent bites) or expired products | This FLW represents 2%[11] and totals 16.14 tons in the analyzed year | The calculation was performed based on the quantity of cheese produced by the agro-industry |
| Consumption | FLW at this stage occurs due to product expiration caused by excessive purchase volume or improper storage | This FLW includes only the household waste of mozzarella cheese, which is 48.12%[31], totaling 71.16 tons in the year analyzed. | The calculation was performed based on the quantity of cheese produced by the agro-industry Cheese that ends up in regular trash and is disposed of in a sanitary landfill, or is rarely sent to composting |
In the production stage, cow diseases were not considered, and data were obtained from respondents’ answers. For the distribution and consumption stages, data were obtained from the literature[11].
Through the inventory conducted and presented in the methodology [Figure 2], the total FLW throughout the LAU CAC was 147.88 tons over the 12 months analyzed, representing 1.76% of the milk volume collected on farms, which totaled 8,387.41 tons [Table 3].
Total FLW by stage of the cheese agro-industrial chain of LAU (2019)
| Stages | FLW quantity | Percentage (%) |
| Production | 0.57 | 0.39 |
| Post-harvest handling and storage | 51.00 | 34.49 |
| Processing and packaging | 8.05 | 5.44 |
| Transportation | 0.96 | 0.65 |
| Distribution | 16.14 | 10.91 |
| Consumption | 71.16 | 48.12 |
| TOTAL | 147.88 | 100 |
This value is similar to the result reported in the work by Tostivint et al.[13], which identified an FLW of 1.4% along the dairy supply chain in Pakistan, using the same methodology and likewise disregarding whey as FLW. From a life-cycle perspective, considering all stages of the LAU cheese production chain, the analysis of FLW by stage indicates that approximately 48% of total FLW occurs at the consumption stage, which accounts for the largest share within the chain [Table 3]. This result is consistent with the Global Food Losses and Food Waste report[11], a key reference in FLW quantification, which indicates that waste at the consumer level represents approximately 40%-65% of the total waste in the dairy chain. Similarly, Campbell and Feldpausch[34] highlight that the consumption stage is the main contributor to the FLW problem, surpassing other stages of the FSC, such as production, post-harvest handling and storage, processing, and distribution.
At the production stage, rural producers estimated the annual volume of milk lost during milking, ranging from 376.7 kg to 753.4 kg relative to the total milk collected on farms. This result differs from that of Tostivint et al.[13], who analyzed FLW in a Pakistani dairy value chain. They identified losses of approximately 12 kg/year, 21 kg/year, and 90 kg/year, varying by farm size and type. This difference is attributed to the milking type; in[13], only manual milking was included, where losses were estimated based on occasional incidents, such as a bucket kicked by a cow during milking. In the LAU analyzed, farms use a mechanized milking system, and the main losses considered were milk retained in milking equipment during washing, which occurs twice daily.
The stages of post-harvest handling and storage, processing and packaging, and transportation, managed by LAU, were quantified using the Mass Balance methodology in accordance with the FLW Standard, with a total FLW amount of 60 tons for the analyzed period (40.58%) in the CAC. This result is consistent with the Australian Dairy Sector Food Waste Action Plan, which identified that 44% of FLW is generated during the handling, processing, and transport stages[35]. The aim of this Action Plan is to identify the relative percentage of actual dairy product waste along the Australian supply chain, highlighting where most of this waste is likely to be generated[35]. Regarding FLW in the distribution stage, quantified based on the 2% rate reported in the literature[11], it is noteworthy that estimating dairy product losses at the consumer stage is difficult due to behavioral practices, such as the disposal of milk, yogurts, and dairy desserts[35]. For the 12-month period analyzed, a total of 16.14 tons was generated at this stage. When evaluating FLW at the consumer level, it is estimated that 1.4 g per inhabitant is wasted daily in Brazil, calculated from the average annual cheese consumption of 5.5 kg/inhabitant[36] combined with the 9% domestic waste rate assumed for the product[31]. Thus, in the LAU analyzed, waste at the consumption stage corresponds to 48.12% of total FLW, representing 71.16 tons. It is observed that this result is very close to those reported in other studies, which identified that, for the dairy sector, FLW at the consumption stage represents approximately 64%[37], 50%[38], 53%[35], and 55%[39]. The main reasons for wasting dairy products include misunderstandings about date labeling, inadequate purchase planning, product spoilage before consumption, and improper storage[34]. Specifically regarding cheese, a similar study conducted in the United Kingdom found that 54% of people do not know why they discard cheese, 23% reported cheese waste due to expiry dates, 18% associated waste with moldy cheese, and only 5% reported discarding cheese because it was “hard” or “dry”[31]. It is important to highlight that cheese waste depends on many factors such as consumer attitudes and behaviors, socioeconomic status, educational level, household size, and dietary preferences[40,41].
Another result obtained in this study indicates that, when considering food and inedible parts together, approximately 35.2 grams are lost or wasted for every 2.0 kg of cheese produced along all stages of the analyzed chain, a proportion corresponding to the 1.76% FLW identified in the cheese production process. In accordance with the FLW Standard, Table 4 shows where the total volume of waste is directed when removed from the LAU CAC. These wastes include: whey (used as animal feed); cheese residues generated at the retail and consumption stages (sent to landfills); and effluents generated during cheese manufacturing (sent to treatment lagoons). It is observed that most is used for animal feed (32.9%) and effluent treatment (66.7%). Both are treated as waste and a cost to the company, despite their potential added value.
Distribution of food loss and waste by destination at LAU (tons per year and percentage of total FLW)
| Destination | Weight (tons/year) | Percentage of total FLW (%) |
| Animal feed | 48.65 | 32.9 |
| Landfill | 0.59 | 0.4 |
| Sewage/water treatment | 98.64 | 66.7 |
| Total | 147.88 | 100 |
Analysis of the FLW destination from a CE perspective
The results obtained in the LAU CAC indicate the presence of residues with potential for reuse, thereby expanding the applicability of circular economy principles in reducing FLW. In particular, emphasis is placed on the volume of whey generated at the agro-industrialization stage, which-although not included in the FLW calculations in this study-is currently destined for animal feed. While this represents a form of reuse, whey presents significant potential for higher value-added applications; however, its current treatment as waste does not generate economic returns for the company.
In this context, whey is one of the most relevant residues in the dairy industry, being a by-product with high utilization potential[42]. Moreover, it constitutes a large reserve of dietary proteins that remain outside human consumption when reuse or valorization strategies are not implemented[43]. Rich in proteins, minerals, vitamins, and high-quality lactose, whey can be transformed through various technological processes into a wide range of value-added food products[44]. Additionally, it can serve as a functional ingredient in food and pharmaceutical applications, as well as a nutrient source in dietary and health foods[45].
Whey management processes include biological treatment without valorization (aerobic digestion); biological treatment with valorization (anaerobic digestion, lactose hydrolysis, fermentation to ethanol, hydrogen, or lactic acid, and direct electricity production via microbial fuel cells); and physico-chemical treatments (thermal and isoelectric precipitation, thermo-calcium precipitation, coagulation/flocculation, acidic precipitation, and electrochemical and membrane technologies)[46].
Using membrane technologies (filtration, microfiltration, nanofiltration, and reverse osmosis), products such as whey powder, demineralized whey powder, permeate powder, food-grade lactose, and whey protein concentrate can be obtained[43,47].
The literature investigating the potential integration of whey into the CE focuses mainly on possible business models and economic viability[42]. In this context, a technology that enables residue valorization, benefiting small-scale cheese manufacturers to create a more effective CE approach, includes anaerobic digestion processes.
In the study by Quaiser and Gilbert[48], through an anaerobic bioreactor, the treatment of whey combined with co-digestion of bovine residues enables the recovery of water and energy. A similar process is developed by Martínez-Ruano et al.[45], which aims to integrate potato residues with whey to produce biogas and convert it into electric energy, reducing the use of conventional energy and dependence on fossil fuels, as well as obtaining economic benefits from fertilizer sales.
Another project developed at a dairy factory in Sweden used an anaerobic reactor system where more than 90% of the organic load contained in the whey was converted into biogas[49]. According to the authors, this system improved the company’s profitability by producing about 50% of the energy needed for boiler steam, halving energy costs from external sources.
The study by Meneses and Flores[50] identified the viability in the dairy sector of recovering water from whey to be reused in onsite cleaning systems without affecting the quality and safety of the product manufactured on the cleaned equipment. Using a combined ultrafiltration and reverse osmosis process, the authors reported that 47% of the water can be recovered, and that concentrated protein and lactose are generated as by-products, which, once spray-dried, meet commercial standards for protein and lactose powders. Furthermore, a cost analysis performed by the authors identified that for a volume of 225 million liters of whey, this system could generate a revenue of US$33.4 million per year[50].
According to Gil et al.[51], whey can be used to sustainably produce biopolymers, as there is growing demand for alternative sources to synthetic polymers due to environmental concerns and the need to reduce dependence on fossil resources. In this context, whey residues can be an essential carbon source for Halomonas alkaliantarctica, which can produce valuable polyhydroxyalkanoates with properties similar to those of conventional plastics[52]. For the authors, in addition to recycling whey, the derived biomaterials can replace fossil polymers that are difficult to degrade, thereby mitigating environmental problems caused by microplastics.
The study by Gil et al.[51] also highlights the usefulness of dairy sludge and whey residues in creating environmentally friendly fertilizers that enrich nutrients while reducing emissions associated with traditional fertilizer production. Techniques such as transforming dairy sludge into biochar and applying biocompatible whey coatings have demonstrated the potential for residue valorization[51].
Finally, the effluent generated in the agroindustry deserves attention due to its polluting potential, which can be seen not only as a treatment cost but also as an alternative income source. Based on the NEWTRIENTS research project (Novel Eco-Sensitive Wastewater Treatment Recovering Dairy Industry Effluent Nutrients) developed in Ireland, it was identified that lentils can be used to extract residues from dairy processing and later serve as animal feed supplements[53,54]. Lentil dry matter has been used as a component in fish, poultry, and swine feed, but there is also potential to use lentils in cattle feed, potentially replacing soy. This process, in which nitrogen and phosphorus compounds support lentil growth while simultaneously treating effluent and serving as feed for cattle that produce milk processed by the dairy agroindustry, represents what we call a closed-loop system[53].
According to Galanakis[55], general methods such as incineration, anaerobic fermentation, composting, landfilling, or the use of food residues for agricultural applications such as animal feed or fertilizers are the main strategies for waste minimization and valorization. In this sense, at the production stage, milk lost as reported by producers during spillage can be used to feed calves or swine.
FLW generated during the transport, distribution, and consumption stages could be donated to people in need (if not expired), fed to animals, or composted rather than landfilled.
FLW originating in the transport, distribution, and consumption stages should prioritize prevention and/or minimization strategies before these wastes are discarded[56-58]. Extracting all benefits from residues should be considered, which may include different strategies such as recovery for healthy human food consumption, inclusion in animal feed, use as compost, or energy generation[59].
In general, the dairy industry generates significant residues that pose environmental and economic challenges for production chains, especially regarding proper disposal and treatment. However, effective valorization can transform these residues into valuable resources, reducing their negative impact. Thus, through innovative processes, these residues can be converted into valuable fertilizers, promoting sustainability and supporting the circular economy[51].
CONCLUSION
The results of this study represent a pioneering initiative by applying the methodological principles of the FLW Protocol to the CAQ in a developing country, such as Brazil. Using the Mass Balance methodology, an FLW of 35.2 grams was identified for every 2.0 kg of cheese produced in the LAU CAQ. From a life cycle perspective, considering all stages of the chain, the stage-based analysis showed that the highest FLW occurs in post-harvest handling and storage (34.49%) and at the consumption stage (48.12%). It is important to note that whey was not included in the FLW calculation; however, it represents an unexploited production potential capable of generating new opportunities and markets - for example, its use as a raw material for other production chains - thus highlighting possible applications of the CE to reduce FLW in LAU’s supply chain.
Thus, the need to advance understanding and monitoring of these flows is emphasized, to more precisely define how unexploited productive potential should be classified and addressed within Food Loss and Waste metrics. This case study reinforces this perspective by demonstrating a significant level of residues generated throughout the CAQ, making it essential to adopt strategies aligned with CE principles to reverse this situation. Among the proposed solutions, the feasibility of recovering water from whey for reuse in on-site cleaning systems is highlighted, as well as the installation of an anaerobic reactor system to produce energy.
Considering Brazil’s reality - where the dairy FSC is one of the country’s key agribusiness sectors and, at the same time, responsible for large volumes of organic waste and losses throughout processing - the utilization of whey becomes especially relevant. Moreover, many small and medium-sized industries face challenges related to proper effluent treatment and waste management. Therefore, solutions based on CE principles, adapted to the Brazilian agro-industrial reality, not only help reduce FLW and environmental impacts but also demonstrate economic viability and strengthen the strategic role of circularity in the transition toward more sustainable and efficient FSCs.
In this sense, the solutions based on CE principles addressed in this study, even though identified in the literature, prove to be promising for addressing FLW challenges in the cheese production chain. The adoption of these practices not only supports the transition toward more sustainable patterns of production and consumption across FSCs, but also provides valuable inputs for companies and researchers to expand their understanding of more efficient, regenerative, and low-waste production models. Thus, such strategies can significantly reduce FLW and strengthen more resilient, sustainable food systems.
This study analyzed FLW throughout the LAU cheese production chain using primary and secondary data based on the Mass Balance methodology of the FLW Standard. The results reveal critical points and the need to adopt more sustainable strategies within the context of LAU. The main contribution of the research was to demonstrate that, through the application of CE principles, byproducts such as whey can be valorized to reduce environmental impacts and enhance economic feasibility. However, one limitation of the study was the restriction to a single case study, as well as the challenges encountered in obtaining primary data across the entire chain, which required the use of secondary data in some stages. Additionally, the scarcity of quantitative FLW data in dairy supply chains available in the literature limited the possibility of broader comparative analyses with the results of this research.
For future research, it is suggested to expand the sample, consider different production scales, and incorporate more comprehensive quantitative analyses of the environmental and economic impacts of circularity in the dairy FSC. It is also recommended to develop an inventory in accordance with the FLW Standard for other FSCs, thereby guiding public policies and business practices aimed at reducing FLW in the agribusiness sector across different contexts. Finally, future studies are encouraged to integrate quantification of GHG emissions using approaches such as Life Cycle Assessment (LCA) or carbon inventories, thereby enabling estimation of the mitigation potential associated with the circularity strategies discussed in this study.
DECLARATIONS
Authors’ contributions
Conceptualization, formal analysis, investigation, methodology, software, writing - original draft: de Oliveira, M. M.
Conceptualization, methodology, project administration, validation, writing - review and editing: Lago, A.
Investigation, formal analysis, visualization, writing - review and editing: Dal’ Magro, G. P.
Availability of data and materials
Data and materials are available from the corresponding authors upon reasonable request.
Financial support and sponsorship
This study was funded in part by the Coordenação de Aperfeiçoamento de Pessoal de Nível Superior - Brasil (CAPES) - Finance Code 001.
Conflicts of interest
All authors declared that there are no conflicts of interest.
Ethical approval and consent to participate
Not applicable.
Consent for publication
Not applicable.
Copyright
© The Author(s) 2026.
REFERENCES
1. Guo, X.; Broeze, J.; Groot, J. J.; Axmann, H.; Vollebregt, M. A worldwide hotspot analysis on food loss and waste, associated greenhouse gas emissions, and protein losses. Sustainability 2020, 12, 7488.
2. FAO. Hunger numbers stubbornly high for three consecutive years as global crises deepen: UN report. 2023. https://www.fao.org/newsroom/detail/hunger-numbers-stubbornly-high-for-three-consecutive-years-as-global-crises-deepen--un-report/en (accessed 2026-01-16).
3. Campbell, B. M.; Beare, D. J.; Bennett, E. M.; et al. Agriculture production as a major driver of the Earth system exceeding planetary boundaries. Ecology. Soc. 2017, 22.
4. Rodrigues, M.; Miguéis, V. A literature review on the quantitative approaches to food waste: descriptive, predictive, and prescriptive analyses. Environ. Sci. Pollut. Res. Int. 2025, 32, 21301-37.
5. Negi, S.; Fan, L.; Kim, H.; Hidaka, T.; Rani, A.; Pan, S. Unlocking the potential of global greenhouse gas mitigation by reducing food loss and waste. J. Agric. Food. Res. 2025, 21, 101925.
6. Yılmaz, S.; Günal, A. M.; Köse, G.; Baş, M. The environmental and economic dynamics of food waste and greenhouse gas emissions: a causal time series analysis from 2000 to 2022. Sustainability 2025, 17, 775.
7. Al Sholi, H. Y.; Wakjira, T.; Kutty, A. A.; et al. How circular economy can reduce scope 3 carbon footprints: lessons learned from FIFA world cup Qatar 2022. Circular. Economy. 2023, 2, 100026.
8. Gazal, A. A.; Bonnet, S.; Silalertruksa, T.; Gheewala, S. H. Circular economy strategies for agri-food production - a review. Circ. Econ. Sust. 2025, 5, 2467-93.
9. Thi, N. B.; Kumar, G.; Lin, C. Y. An overview of food waste management in developing countries: current status and future perspective. J. Environ. Manage. 2015, 157, 220-9.
10. Hanson, C.; Lipinski, B.; Robertson, K.; et al. Food loss and waste accounting and reporting standard. 2016. https://flwprotocol.org/wp-content/uploads/2017/05/FLW_Standard_final_2016.pdf (accessed 2026-01-16).
11. Gustavsson, J.; Cederberg, C.; Sonesson, U. Global food losses and food waste. Swedish Institute for Food and Biotechnology (SIK), Gothenburg; Robert van Otterdijk Alexandre Meybeck FAO Rome, Italy. 2011. https://openknowledge.fao.org/server/api/core/bitstreams/10388b16-5f1a-45d0-b690-e89bb78d33bb/content (accessed 2026-01-16).
12. Aragie, E.; Balié, J.; MoralesOpazo, C. Does reducing food losses and wastes in sub-Saharan Africa make economic sense? Waste. Manag. Res. 2018, 36, 483-94.
13. Tostivint, C.; de Veron, S.; Jan, O.; Lanctuit, H.; Hutton, Z. V.; Loubière, M. Measuring food waste in a dairy supply chain in Pakistan. J. Clean. Prod. 2017, 145, 221-31.
14. EMBRAPA. The 2023 Dairy Yearbook. Embrapa Dairy Cattle. 2023. https://www.embrapa.br/busca-de-publicacoes/-/publicacao/1154264/anuario-leite-2023-leite-baixo-carbono (accessed 2026-01-16).
15. FAO. World food and agriculture - statistical yearbook 2021. https://openknowledge.fao.org/items/3bd1ea1c-6865-4e1a-b1a1-dd4ce7266a7c (accessed 2026-01-16).
16. Silva, D. V. D.; Pavan, A. L. R.; Faria, L. C. D.; Piekarski, C. M.; Saavedra, Y. M. B.; Lopes Silva, D. A. Opportunities to integrate ecosystem services into life cycle assessment (LCA): a case study of milk production in Brazil. Ecosyst. Serv. 2024, 69, 101646.
17. EMBRAPA. The consumer market for milk and dairy products. Juiz de Fora: Embrapa Dairy Cattle. 2019. http://www.infoteca.cnptia.embrapa.br/infoteca/handle/doc/1110792 (accessed 2026-01-16).
18. Karkou, E.; Teo, C. J.; Savvakis, N.; Poinapen, J.; Arampatzis, G. Industrial circular water use practices through the application of a conceptual water efficiency framework in the process industry. J. Environ. Manage. 2024, 370, 122596.
19. Damian, C. S.; Devarajan, Y.; Jayabal, R. A comprehensive review of the resource efficiency and sustainability in biofuel production from industrial and agricultural waste. J. Mater. Cycles. Waste. Manag. 2024, 26, 1264-76.
20. Al‐hammadi, M.; Güngörmüşler, M. From refuse to resource: exploring technological and economic dimensions of waste‐to‐energy. Biofuels. Bioprod. Bioref. 2025, 19, 570-92.
21. Scherhaufer, S.; Moates, G.; Hartikainen, H.; Waldron, K.; Obersteiner, G. Environmental impacts of food waste in Europe. Waste. Manag. 2018, 77, 98-113.
22. Salihoglu, G.; Salihoglu, N. K.; Ucaroglu, S. Banar M. Food loss and waste management in Turkey. Bioresour. Technol. 2017, 248(PA), 88-99.
23. Veteikytė, A.; Šiekštelė, R.; Tvaska, B.; Matijošytė, I. Sequential application of waste whey as a medium component for Kluyveromyces lactis cultivation and a co-feeder for lipase immobilization by CLEA method. Appl. Microbiol. Biotechnol. 2017, 101, 3617-26.
24. Brändström, J.; Saidani, M. Comparison between circularity metrics and LCA: a case study on circular economy strategies. J. Clean. Prod. 2022, 371, 133537.
25. European Commission. European Green Deal COM 640. Brussels. 2019. https://eur-lex.europa.eu/legal-content/PT/TXT/?uri=COM%3A2019%3A640%3AFIN (accessed 2026-01-16).
26. Bleischwitz, R.; Yang, M.; Huang, B.; et al. The circular economy in China: Achievements, challenges and potential implications for decarbonisation. Resour. Conserv. Recycl. 2022, 183, 106350.
27. Rood, T.; Muilwijk, H.; Westhoek, H. Food for the Circular Economy. PBL Netherlands Environmental Assessment Agency. Haia. 2017. https://www.pbl.nl/uploads/default/downloads/PBL-2017-Food-for-the-circular-economy-2878.pdf (accessed 2026-01-16).
28. Ahmad, T.; Aadil, R. M.; Ahmed, H.; et al. Treatment and utilization of dairy industrial waste: a review. Trends. Food. Sci. Technol. 2019, 88, 361-72.
29. Principato, L.; Ruini, L.; Guidi, M.; Secondi, L. Adopting the circular economy approach on food loss and waste: the case of Italian pasta production. Resour. Conserv. Recycl. 2019, 144, 82-9.
30. Oliveira, M. M. D.; Lago, A.; Dal’Magro, G. P. Food loss and waste in the context of the circular economy: a systematic review. J. Clean. Prod. 2021, 294, 126284.
31. WRAP. Household food & drink waste: a product focus. 2014. https://www.wrap.ngo/resources/report/household-food-drink-waste-product-focus (accessed 2026-01-16).
32. Lipinski, B. FLW quantification method ranking tool. WRI. 2016. https://flwprotocol.org/flw-standard/ (accessed 2026-01-16).
33. Östergren, K.; Gustavsson, J.; Bos-Brouwers, H.; et al. FUSIONS definitional framework for food waste - full report. Project report FUSIONS. 2014. https://hal.inrae.fr/hal-02800861/file/2014_Barbara%20redlingshofer_FUSIONS%20Definitional%20framework%2003072014_1.pdf (accessed 2026-01-16).
34. Campbell, C. G.; Feldpausch, G. L. Invited review: the consumer and dairy food waste: an individual plus policy, systems, and environmental perspective. J. Dairy. Sci. 2022, 105, 3736-45.
35. ADPF. Managing climate and environment. Dairy sector food waste action plan. Stop Food Waste Australia. 2023. https://endfoodwaste.com.au/wp-content/uploads/2023/11/Dairy-Food-Waste-Action-Plan-Report.pdf (accessed 2026-01-16).
36. Abiq - Brazilian Association of Cheese Industries. News, 2019. https://abiq.com.br/ (accessed 2026-01-16).
37. Buzby, J. C.; Farah-Wells, H.; Hyman, J. The estimated amount, value, and calories of postharvest food losses at the retail and consumer levels in the United States. USDA-ERS Economic Information Bulletin Number 121. https://papers.ssrn.com/sol3/papers.cfm?abstract_id=2501659 (accessed 2026-01-16).
38. Al-Obadi, M. Dairy wastage footprint analysis: a farm-to-fork life cycle approach across dairy supply chain. In Proceedings of the First Central American and Caribbean International Conference on Industrial Engineering and Operations Management, Port-au-Prince, Haiti, June 15-16, 2021. https://ieomsociety.org/proceedings/2021haiti/245.pdf (accessed 2026-01-16).
39. Kechagias, E. P.; Gayialis, S. P.; Panayiotou, N.; Papadopoulos, G. A. A holistic framework for evaluating food loss and waste due to marketing standards across the entire food supply Chain. Foods 2024, 13, 3273.
40. Glanz, R. Causes of food waste generation in households - an empirical analysis. Department of Water, Atmosphere and Environment and School of Applied Sciences, University of Natural Resources and Applied Life Sciences, Vienna and Cranfield University. 2008. https://www.readkong.com/page/university-of-natural-resources-and-applied-life-sciences-1185871 (accessed 2026-01-16).
41. Parfitt, J.; Barthel, M.; Macnaughton, S. Food waste within food supply chains: quantification and potential for change to 2050. Philos. Trans. R. Soc. Lond. B. Biol. Sci. 2010, 365, 3065-81.
42. Mehner, E.; Fantin, V.; Pizzichini, D.; Vaccari, M. Decentralised by-product valorisation in the dairy value chain: an opportunity for sustainable intensification. J. Clean. Prod. 2024, 478, 143958.
43. Nicolás, P.; Ferreira, M. L.; Lassalle, V. A review of magnetic separation of whey proteins and potential application to whey proteins recovery, isolation and utilization. J. Food. Eng. 2019, 246, 7-15.
44. Mirzakulova, A.; Sarsembaeva, T.; Suleimenova, Z.; et al. Whey: composition, processing, application, and prospects in functional and nutritional beverages-a review. Foods 2025, 14, 3245.
45. Martínez-Ruano, J. A.; Restrepo-serna, D. L.; Carmona-garcia, E.; Giraldo, J. A. P.; Aroca, G.; Cardona, C. A. Effect of co-digestion of milk-whey and potato stem on heat and power generation using biogas as an energy vector: techno-economic assessment. Appl. Energy. 2019, 241, 504-18.
46. Prazeres, A. R.; Carvalho, F.; Rivas, J. Cheese whey management: a review. J. Environ. Manage. 2012, 110, 48-68.
47. Giulianetti de Almeida, M. P.; Mockaitis, G.; Weissbrodt, D. G. Got Whey? Sustainability endpoints for the dairy industry through resource biorecovery. Fermentation 2023, 9, 897.
48. Ribera-pi, J.; Badia-fabregat, M.; Calderer, M.; et al. Anaerobic membrane bioreactor (AnMBR) for the treatment of cheese whey for the potential recovery of water and energy. Waste. Biomass. Valor. 2020, 11, 1821-35.
49. Quaiser, J.; Gilbert, E. M. Wastewater treatment in the dairy processing industry - recovering energy using anaerobic technology. 2016. https://www.researchgate.net/publication/297685564_Wastewater_treatment_in_the_dairy_processing_industry_-_recovering_energy_using_anaerobic_technology (accessed 2026-01-16).
50. Meneses, Y. E.; Flores, R. A. Feasibility, safety, and economic implications of whey-recovered water in cleaning-in-place systems: a case study on water conservation for the dairy industry. J. Dairy. Sci. 2016, 99, 3396-407.
51. Gil, F.; Taf, R.; Mikula, K.; et al. Advancing sustainable agriculture: converting dairy wastes into amino acid fertilizers. Sustain. Chem. Pharm. 2024, 42, 101782.
52. Mozejko-Ciesielska, J.; Moraczewski, K.; Czaplicki, S.; Singh, V. Production and characterization of polyhydroxyalkanoates by Halomonas alkaliantarctica utilizing dairy waste as feedstock. Sci. Rep. 2023, 13, 22289.
53. Jansen, M. Duckweed: a key component for recycling dairy processing wastewater. 2018. https://www.ucc.ie/en/newtrients/blog/duckweed-a-key-component-for-recycling-dairy-processing-wastewater.html (accessed 2026-01-16).
54. O’Mahoney, R.; Coughlan, N. E.; Walsh, É.; Jansen, M. A. K. Cultivation of lemna minor on industry-derived, anaerobically digested, dairy processing wastewater. Plants 2022, 11, 3027.
55. Galanakis, C. M. Food waste recovery: processing technologies and industrial techniques. 2015 Elsevier. https://shop.elsevier.com/books/food-waste-recovery/galanakis/978-0-12-800351-0 (accessed 2026-01-21).
56. Chandrasekaran, M. Valorization of food processing by-products, 1th ed.; Taylor & Francis Group, Florida, 2013, pp739-56. https://www.routledge.com/link/link/p/book/9781138199422 (accessed 2026-01-21).
57. Luo, N.; Olsen, T.; Liu, Y.; Zhang, A. Reducing food loss and waste in supply chain operations. Transp. Res. Part. E. Logist. Transp. Rev. 2022, 162, 102730.
58. Romadlon, F.; Wan Ahmad, W. N. K.; Shamsuddin, A.; et al. Systematic review on mitigation of food loss and waste in the milk supply chain. E3S. Web. Conf. 2025, 603, 04006.
Cite This Article
How to Cite
Download Citation
Export Citation File:
Type of Import
Tips on Downloading Citation
Citation Manager File Format
Type of Import
Direct Import: When the Direct Import option is selected (the default state), a dialogue box will give you the option to Save or Open the downloaded citation data. Choosing Open will either launch your citation manager or give you a choice of applications with which to use the metadata. The Save option saves the file locally for later use.
Indirect Import: When the Indirect Import option is selected, the metadata is displayed and may be copied and pasted as needed.
About This Article
Special Topic
Copyright

Data & Comments
Data
0


Comments
Comments must be written in English. Spam, offensive content, impersonation, and private information will not be permitted. If any comment is reported and identified as inappropriate content by OAE staff, the comment will be removed without notice. If you have any queries or need any help, please contact us at support@oaepublish.com.