


Defining soil carbon benchmark values of agroecosystems across a diversity of tropical soil environments
 0
0 
Abstract
Soil organic carbon (SOC) plays an important role in carbon and nutrient cycling, agricultural productivity, and climate regulation, yet its variability and environmental controls remain poorly constrained in tropical regions characterized by a diversity of soils, climates, and land-use histories. We conducted a regional-scale assessment of SOC across Puerto Rico to evaluate how land use, soil properties, and climate influence SOC variability and to examine the applicability of existing benchmark frameworks in tropical agroecosystems. We compiled SOC data from 586 soil pedons representing nine US Department of Agriculture (USDA) soil orders and multiple land-use categories, with SOC concentrations standardized to the 0-30 cm depth. We evaluated land-use effects and relationships between SOC and environmental variables. SOC concentrations differed by land use, with greater values generally observed in wetlands and forests, intermediate values in pastures or grazing lands, and lower values in agricultural lands. Environmental factors associated with SOC variability differed by land use, with climate and soil suborder more strongly associated with SOC in forests, soil texture and suborder in pastures, and a combination of soil order, texture, temperature, and pH in agricultural systems. We also compared the effectiveness of two SOC benchmarking approaches: the Soil Health Gap model and a Scores Benchmark based on empirical cumulative distributions applied to soils of the tropics in our database. The limited availability of primary forests poses a challenge for applying benchmarks that require undisturbed reference conditions, while the island’s broad climatic range allows for testing the robustness of SOC benchmarks across a diversity of soil environmental conditions. The Soil Health Gap showed differences among soil orders and climate, whereas the Scores Benchmark provided a more flexible framework for contextualizing SOC across heterogeneous tropical landscapes. Our findings support the use of context-specific SOC benchmarks to evaluate land-use change and soil assessment efforts in tropical regions without assuming undisturbed reference conditions.
Keywords
INTRODUCTION
Soil organic carbon (SOC) plays a fundamental role in ecosystem functioning, influencing soil structure, water retention, nutrient availability, and microbial processes[1,2]. As one of the largest terrestrial carbon reservoirs[3], changes in SOC directly affect atmospheric concentrations of carbon dioxide and methane. Understanding how SOC responds to environmental and land-use changes is therefore essential for both climate change mitigation and agricultural sustainability. Soil organic carbon is widely used as a core soil health indicator because it influences multiple biological, chemical, and physical soil processes, including nutrient cycling, microbial activity, and structure, and because it responds predictably to management and environmental gradients[4,5]. However, predicting SOC dynamics at regional scales remains challenging due to the complex interactions among climate, soil properties, and biotic factors[2,6,7]. Ignoring these interactions can result in large uncertainties in model outcomes[8]. Developing predictive soil health tools, such as benchmarks, provides a means to establish reference conditions for SOC across land uses, climates, and soil types, helping to reduce these uncertainties.
Globally, the conversion of forests to agricultural lands typically reduces SOC, with a few exceptions in well-managed pastures with large belowground inputs[9-12]. Such land-use changes contribute substantially to greenhouse gas emissions and smaller SOC stocks through reduced organic inputs and increased soil disturbance, which accelerates decomposition[13,14]. These effects are particularly pronounced in tropical regions, where deforestation is estimated to cause the loss of more than half of the originally stored soil organic carbon in the upper soil layer[12]. Yet, SOC responses to land-use change in the tropics remain highly variable[9], partly because of uneven research coverage across the region’s diverse climates, soils, and management systems[11]. To address these biases, large-scale, integrative assessments of SOC across tropical environmental gradients are urgently needed.
Recent efforts to define soil health indicators and benchmarks have advanced our ability to assess how land use affects soil properties and functions[2,15]. Recognizing SOC as a core indicator of soil health underscores the importance of understanding its variability across tropical climates and soil environments[4,5]. Such understanding can guide sustainable land management and policy design aimed at reducing soil carbon losses and enhancing soil resilience.
Several benchmark frameworks have been developed to contextualize SOC values, including reference-condition approaches such as the Soil Health Gap model and score-based benchmarks derived from empirical SOC distributions. In this study, benchmarks are defined as soils used to establish expected SOC ranges under comparable environmental and pedogenic conditions, derived from empirical regional data. The Soil Health Gap is defined as the difference between soil health in undisturbed systems and that in managed croplands within the same agroecosystem[16]. However, the concept of “undisturbed” reference soils poses challenges in regions where deforestation has been extensive and land-use histories are poorly documented, making it difficult to define reliable baseline SOC conditions. In tropical regions, many forests are successional and reflect past human use rather than long-term undisturbed conditions, complicating their use as reference systems for SOC benchmarking[17,18]. In the absence of unconverted forests, successional or secondary forests can serve as reference proxies due to their capacity for aboveground biomass recovery[19,20], yet SOC recovery in these forests is often inconsistent[18,21,22]. As a result, using secondary forests in the Soil Health Gap benchmark may lead to biased assessments where no primary forests remain, overestimating “recovery” and underestimating losses when available reference soils already have reduced SOC stocks.
An alternative approach is to develop score-based benchmarks that use the distribution of SOC values within specific environmental conditions to assess soil health. These models generate standardized scores that allow users to evaluate whether SOC levels are low or high relative to regional variability. Examples include the Comprehensive Assessment of Soil Health (CASH), which employs cumulative distributions of regional data from the northern United States[22], and the Soil Management Assessment Framework (SMAF), which integrates biological, chemical, and physical indicators using normalized 0-1 scores[23]. A more recent tool, the Soil Health Assessment Protocol and Evaluation (SHAPE), builds on both approaches by grouping soils according to climatic and edaphic similarities[24]. These frameworks demonstrate the value of using region-specific benchmarks to interpret SOC variability, but their development for tropical ecosystems remains limited. Creating such benchmarks requires a detailed understanding of the climatic and physicochemical factors that regulate SOC dynamics.
Climate and soil properties are key drivers of SOC at both global and regional scales[25,26]. Temperature and precipitation regulate organic matter inputs and decomposition rates, while soil texture and mineralogy affect SOC stabilization and loss[27-29]. Although clay content is often considered a strong predictor of SOC[30-32], its explanatory power can vary across environmental conditions, with other soil variables, such as pH, fine silt, clay, and mineralogy becoming more important[6]. In an earlier study in the U.S. Caribbean, Vaughan et al.[7] reported that clay alone was a poor predictor of SOC and suggest combining clay + silt for better results. Geologic substrates can mediate the effects of climate and land use on SOC at regional scales[7,33,34]. These studies highlight the need to better understand interactions between land use, soil properties, and climate to improve quantification of SOC inventories and modeling efforts of SOC response to environmental change.
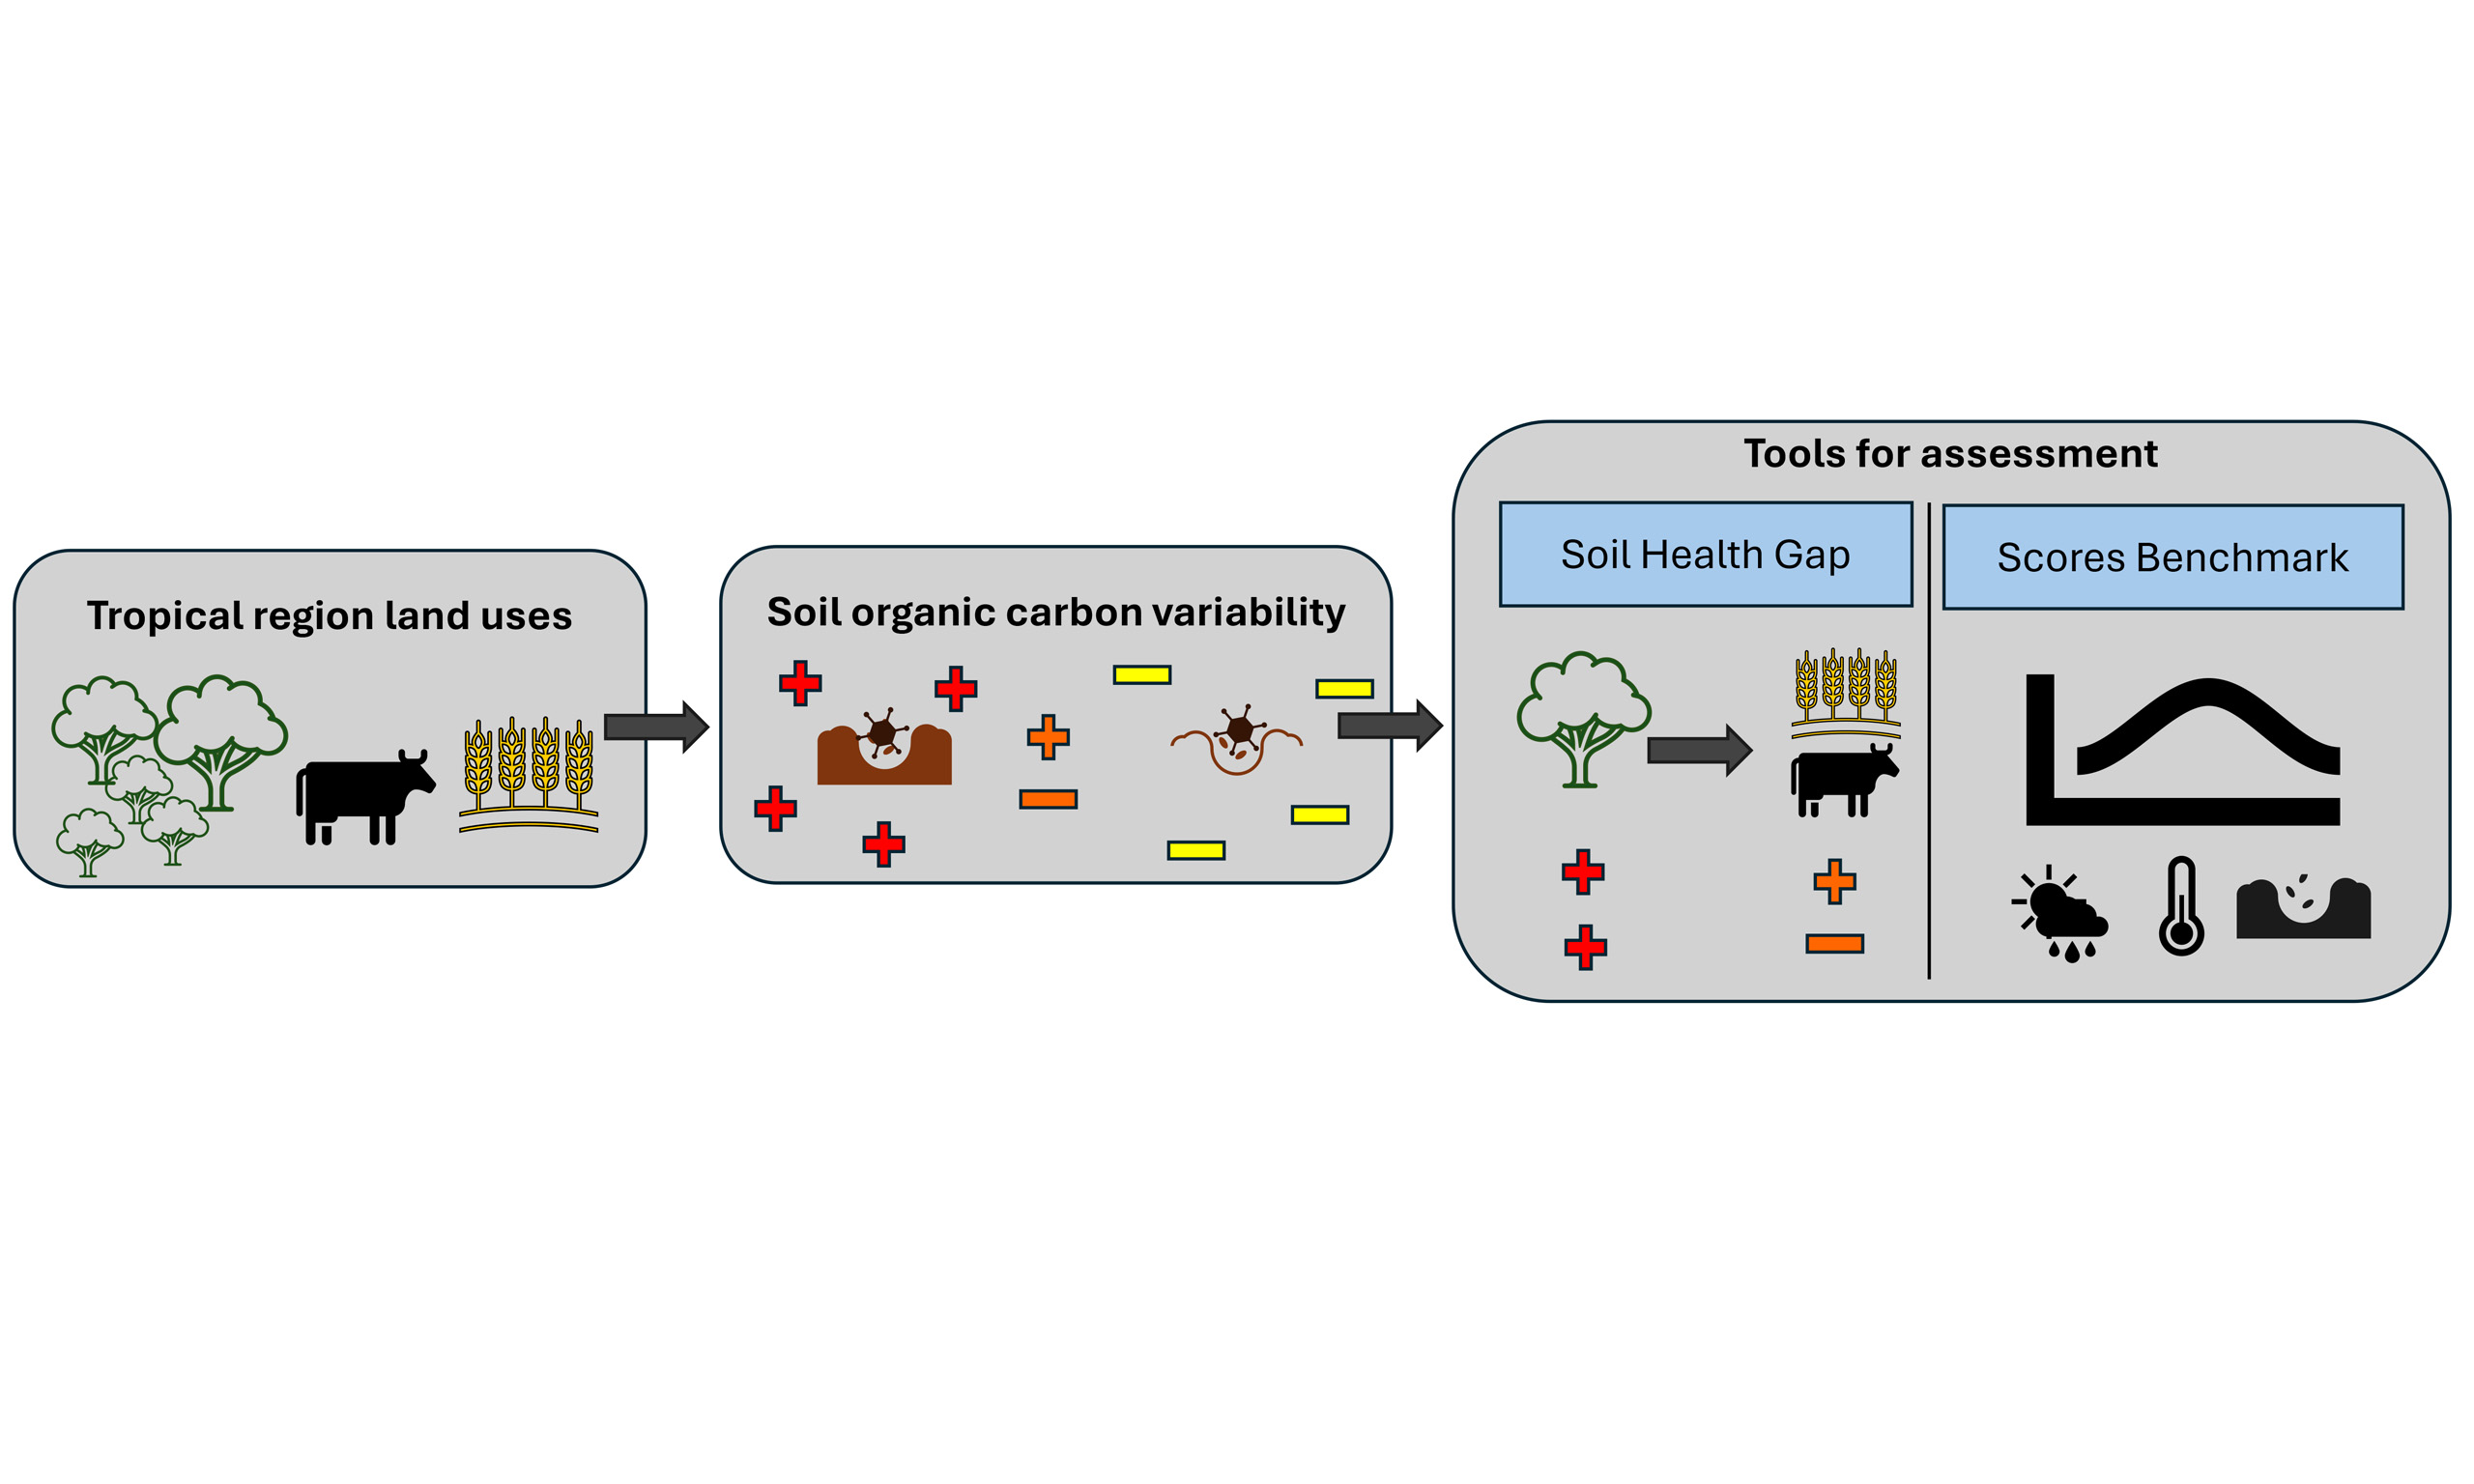
In this study, we (1) evaluated how agricultural land use and vegetation cover influence SOC variability across a region with a diversity of soil and climate environments representative of tropical ecosystems; (2) identified the primary factors controlling SOC within each land-use type; and (3) developed a regionally-derived Scores Benchmark using the statistical distribution of SOC values to represent variability across environmental gradients, and compared it with the conceptual Soil Health Gap framework to evaluate their applicability for tropical soil health assessment. We hypothesized that agricultural lands would exhibit smaller average SOC stocks and reduced variability compared to forests, reflecting the effects of intensive management and residue removal. We further hypothesized that SOC variability at the regional scale would be modulated by climate, while within-land-use variability depends on soil physicochemical characteristics. Lastly, we expected that the Soil Health Gap model would be less effective for tropical regions lacking primary forest reference sites, and that a Score-based benchmark capturing geographic variability provides a more practical and scalable approach. We use Puerto Rico as a case study due to its well-documented land-use history, diversity of soils and climates, and extensive SOC datasets. By synthesizing 586 pedons representing nine US Department of Agriculture (USDA) soil orders, our work contributes a regionally grounded framework for improving SOC prediction and benchmarking in tropical environments. Together, these objectives frame a core question of whether SOC variability in tropical agroecosystems is better interpreted through context-specific benchmarks that account for soil and climatic heterogeneity rather than reference-based approaches.
METHODS
A case study: Puerto Rico
The Caribbean Area Natural Resources Conservation Service (NRCS) has identified soil health as a priority for improving agricultural productivity and reducing soil erosion in Puerto Rico[35]. Historically, the island experienced extensive deforestation for agriculture and livestock, with approximately 78% of land cleared during the 1900s[36]. During the 20th century, massive migration and economic shifts toward industrial and service sectors led to widespread agricultural land abandonment[37]. Today, about 42% of Puerto Rico’s land is identified as suitable for agricultural production[38], including 23% for row crops, livestock, dairy, hay, and fruits, and 19% for forestry and agroforestry activities. In Puerto Rico, transitions among these land uses may have altered organic matter inputs, soil structure, and biogeochemical processes, leading to persistent legacies in SOC that vary across soil types and climatic gradients. As a result, present-day SOC patterns reflect not only current land use but also cumulative effects of historical land management and recovery trajectories, representing conditions observed in other tropical landscapes.
Puerto Rico, located between 17°45’ and 18°30’N and 65°45’ and 67°15’W, covers approximately 8,740 km2. The island exhibits sharp climatic gradients, from dry semi-deciduous forests in the southwest to moist and wet forests in the northeast, and an elevation range from sea level to 1,338 m at Cerro de Punta. The climate is tropical maritime[39], with mean annual temperatures ranging from 20 °C in high elevations to 26 °C in coastal areas and mean annual precipitation spanning 850-4,500 mm. These strong climatic gradients, combined with complex topography and soil diversity, provide the opportunity to assess environmental effects on SOC under different land uses.
The island’s soils encompass 10 of the 12 USDA soil orders (Alfisols, Entisols, Histosols, Inceptisols, Mollisols, Oxisols, Ultisols, Vertisols, Aridisols, and Spodosols). The coexistence of the diversity of soils within a relatively small area reflects the interaction of steep climatic gradients, diverse parent materials, variable drainage conditions, and long-term weathering across contrasting geomorphic settings on the island providing a space for a range of soil representations in the region[40,41]. This diversity provides an excellent context for examining SOC dynamics across contrasting environments.
Data collection
A regional SOC dataset was assembled by integrating data from multiple sources, including pedon analyses from the USDA NRCS and published research studies in the literature. From the NRCS Soil Characterization Database, we retrieved 234 pedons analyzed by the Kellogg Soil Survey Laboratory in Lincoln, NE using the SoilDB package in R[42]. For each pedon, we extracted latitude, longitude, soil series, soil order and suborder, SOC concentration (%), and particle-size fractions (% sand, % silt, % clay). Land use was determined by overlaying pedon coordinates with the 2001 National Land Cover Database (NLCD) in Google Earth Engine. The NLCD classes were reclassified into five land-use categories: agriculture (cultivated crops), pastures (pasture, hay, and herbaceous lands used for grazing), forests (evergreen and woody vegetation), rangelands (herbaceous and shrubby vegetation), and wetlands (emergent herbaceous wetlands). We complemented the NRCS data with 352 pedons compiled from published studies that included SOC concentration, land use, geographic coordinates, soil order, and textural information for sites in Puerto Rico[7,34,43].
Soil orders and suborders were verified using the Taxonomic Classification of the Soils of Puerto Rico[41] to ensure consistency with updated Soil Taxonomy classifications, as soil classifications have been revised since many of the original samples and datasets were collected. The combined dataset comprised 586 pedons representing nine soil orders and five principal land-use types (see locations in Figure 1). For each pedon location, mean annual temperature (MAT) and mean annual precipitation (MAP) were extracted from the WorldClim database (1 km2 resolution). The SOC concentration at 0-30 cm distribution overall, and variation across land use and soil order can be seen in Figure 2. Because bulk-density data were not consistently available, we used SOC concentration rather than stock; although this approach may introduce some bias when comparing sites[44], it adequately serves the purpose of analyzing relative SOC variability and developing benchmark models.
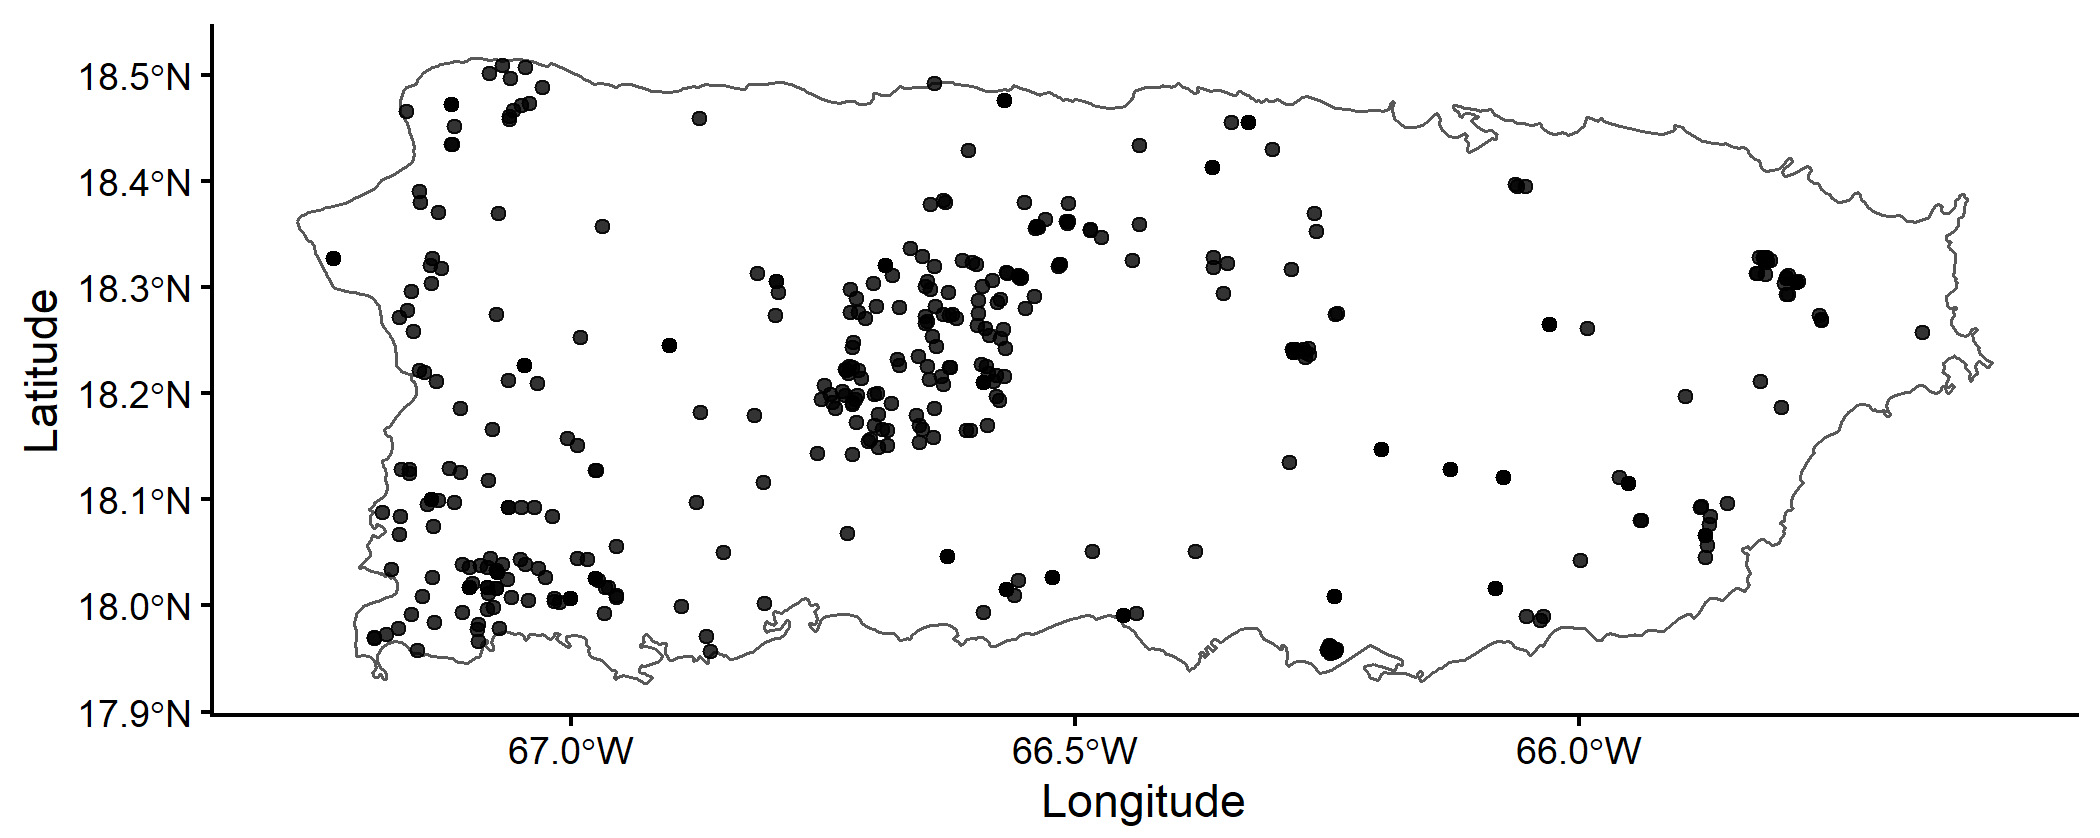
Figure 1. Map showing the 586 pedons geographical distribution across the island of Puerto Rico.
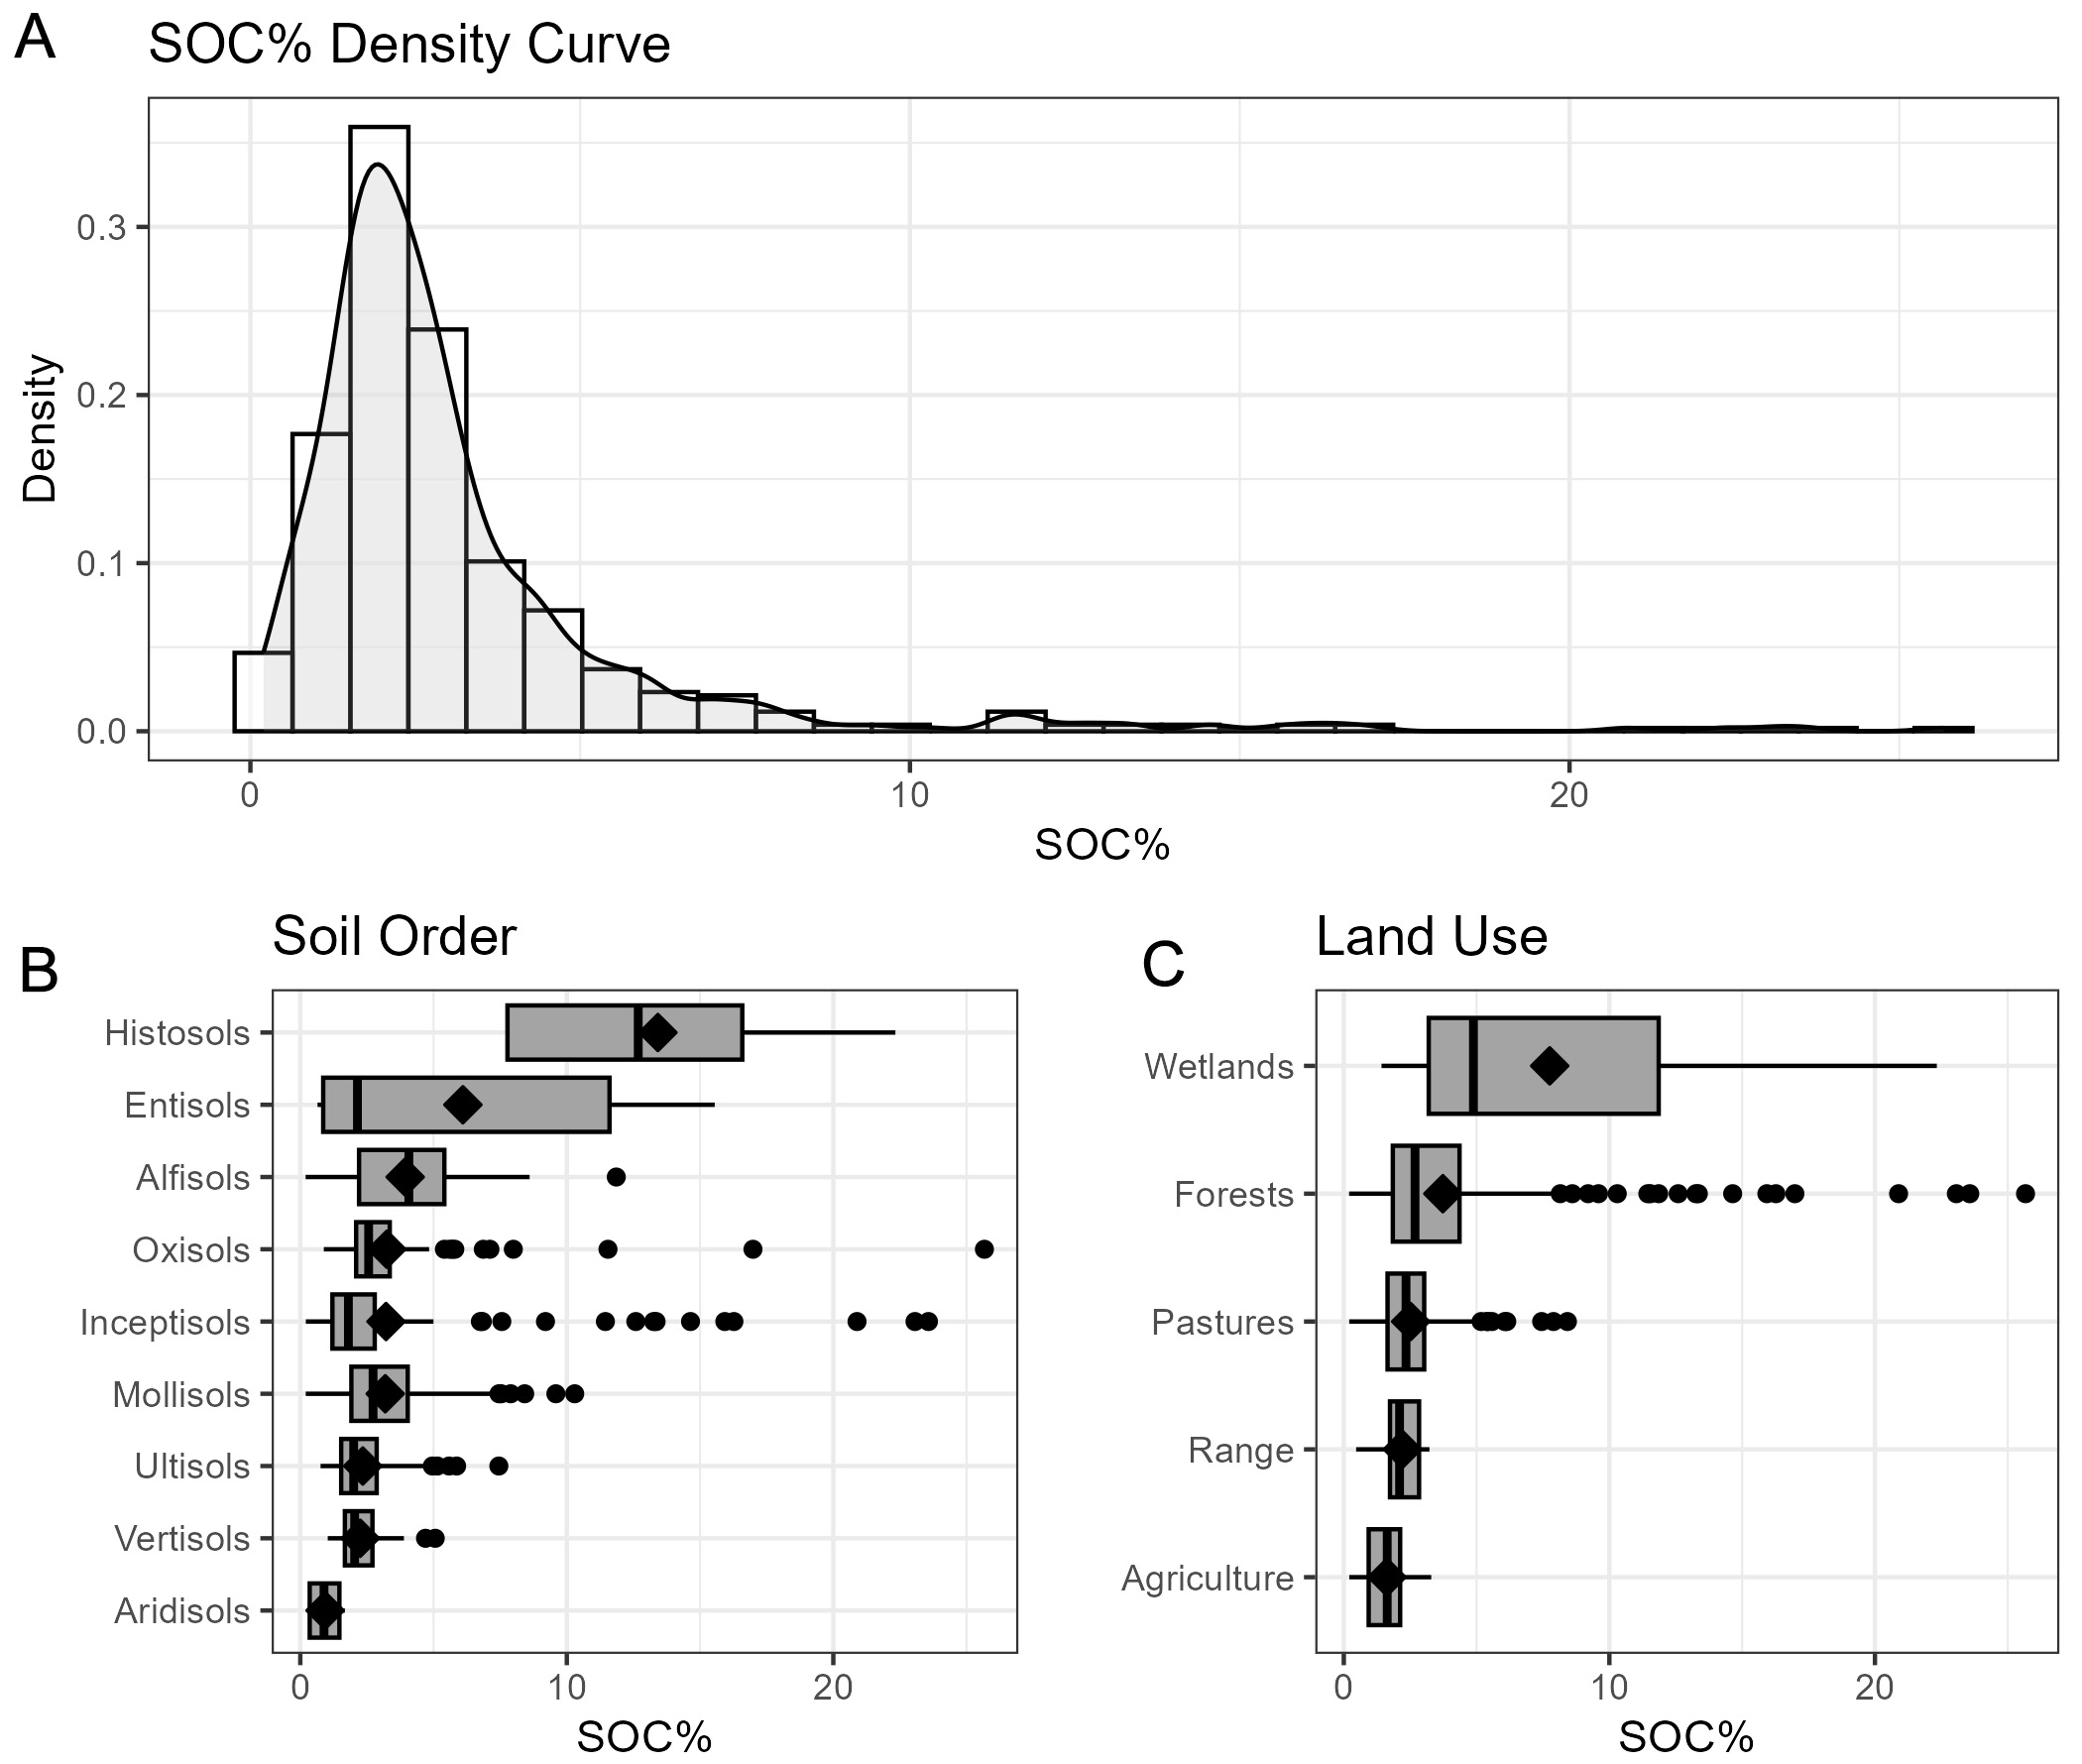
Figure 2. Soil organic carbon concentrations from 0-30 cm depth layers: (A) density and distribution across (B) soil orders and (C) land uses across a database of 586 pedons in Puerto Rico. SOC: Soil organic carbon.
Data analysis
Data analysis proceeded in three steps: (1) evaluation of land-use effects on SOC, (2) identification of environmental and edaphic controls within land-use types, and (3) development and evaluation of SOC benchmark models. For consistency, all pedons were standardized to the 0-30 cm depth by averaging SOC and the associated variables across all horizons within this interval, which represents the most biologically active portion of the soil profile affected by land-use change[3]. We first evaluated the effect of land use on SOC using one-way analysis of variance (ANOVA), followed by Tukey’s honest significant difference (HSD) tests for pairwise comparisons. To identify the dominant environmental factors controlling SOC within each land-use type, the dataset was subdivided into agriculture, pasture, and forest subsets. Within each, we examined the influence of soil order, suborder, USDA textural class, MAT, MAP, silt + clay content, and soil pH using ANOVA and simple linear regression. We used silt + clay content based on previous research in Puerto Rico that found this was a better predictor than clay alone on SOC across a range of soil orders, land uses, and climate[7,45].
Stepwise multiple regression (forward and backward selection) was performed using the step function of the MASS package in R[46]. Prior to analysis, all variables were assessed for normality. Variables that did not meet normality assumptions were log-transformed prior to analysis. Statistical significance is reported at P < 0.05 unless otherwise noted.
To develop SOC benchmarks, we first identified the variables explaining the largest proportion of SOC variability across all land uses using stepwise regression. We then applied a Random Forest model (randomForest package[47];) to assess variable importance and support benchmark development and visualized with the varImpPlot function of the caret package[48]. Two conceptual benchmark models were tested. In the Soil Health Gap Benchmark, we calculated the difference in mean SOC between forest and agricultural or pasture soils within each soil order and climate class. Climate classes followed the Köppen classification[49,50], with precipitation categorized as Dry (< 1,000 mm), Moist (1,000-2,500 mm), or Wet (> 2,500 mm) and temperature classes as < 21 °C, 22-25 °C, or > 26 °C. ANOVA and Tukey HSD tests were used to determine whether soil order or land use significantly affected the SOC gap.
For the Scores Benchmark, we excluded Histosols, rangelands, and wetlands because of limited sample sizes and trained a Random Forest model using 70% of the data, reserving 30% for validation. Predicted SOC values were then used to calculate empirical cumulative distribution functions (ECDFs) for each soil order, which provided normalized 0-1 SOC scores representing the distribution of values across environmental gradients. Model performance was evaluated using the coefficient of determination (R2) and root-mean-square error (RMSE). All statistics were conducted in R[51]. This analysis builds on earlier exploratory work presented in Díaz-Vallejo[52], with substantial refinement and expansion for journal publication.
RESULTS
Data descriptive results
Within the 0-30 cm layer, SOC concentrations among individual horizons ranged from 0.01% to 46.6% [Figure 2A and Table 1], illustrating the wide variability of surface and organic-rich layers across Puerto Rico’s soils. When averaged by pedon to represent integrated topsoil conditions, SOC values ranged from 0.12% to 23.6% (mean = 2.9%, sd = 2.7%, Table 1). The combined fine fraction (silt + clay) ranged from 8% to 99% (mean = 80%, sd 16.91%, Table 1). Climatic gradients were also well represented in the dataset, with MAT spanning 18-27 °C and MAP ranging from 750 mm to 3,150 mm yr-1. Forest and pasture pedons accounted for most observations, followed by agricultural, wetland, and rangeland soils [Supplementary Table 1].
Summary statistics for soil organic carbon concentrations, silt + clay concentrations and mean annual temperature, and mean annual precipitation across a database of 586 pedons in Puerto Rico
| Min | Median | Mean | Max | Sd | |
| SOC (%) raw | 0.02 | 2.14 | 3.07 | 46.67 | 3.27 |
| SOC (%) 0-30cm averaged | 0.12 | 2.21 | 2.92 | 23.57 | 2.68 |
| Silt + Clay (%) | 2.60 | 83.10 | 80.90 | 100.00 | 16.91 |
| MAT (°C) | 18.10 | 24.00 | 23.98 | 26.70 | 1.64 |
| MAP (mm) | 752.00 | 1,810.00 | 1,804.68 | 3,156.00 | 513.51 |
Land-use effects on soil carbon
Mean SOC concentrations at 0-30 cm differed among land uses (ANOVA, P < 0.001; Table 2; Figure 2C). All pairwise comparisons were significant [Supplementary Table 2] except those involving rangelands, which did not differ from agriculture (P = 0.126), forests (P = 0.995), or pastures (P = 0.165, Supplementary Table 2). Wetlands exhibited the greatest SOC (7.75 ± 5.80%), followed by forests (3.70 ± 3.51%), pastures (2.51 ± 1.36%), rangelands (2.20 ± 0.68%), and agriculture (1.62 ± 0.70%).
Analysis of variance results for testing differences among land use types across a database of 586 pedons in Puerto Rico
| Df | Sum of squares | Mean of squares | F value | P-value | |
| Land use | 4 | 54.61 | 13.651 | 29.5 | < 0.0001 |
| Residuals | 581 | 268.87 | 0.463 |
Factors affecting soil organic carbon in agricultural land and pastures
We evaluated the effects of soil order, soil suborder, MAT, MAP, silt + clay (%), pH, and USDA texture class on SOC (%) in Agriculture [Tables 3 and 4, Figure 3] and Pastures [Tables 3 and 4, Figure 4].
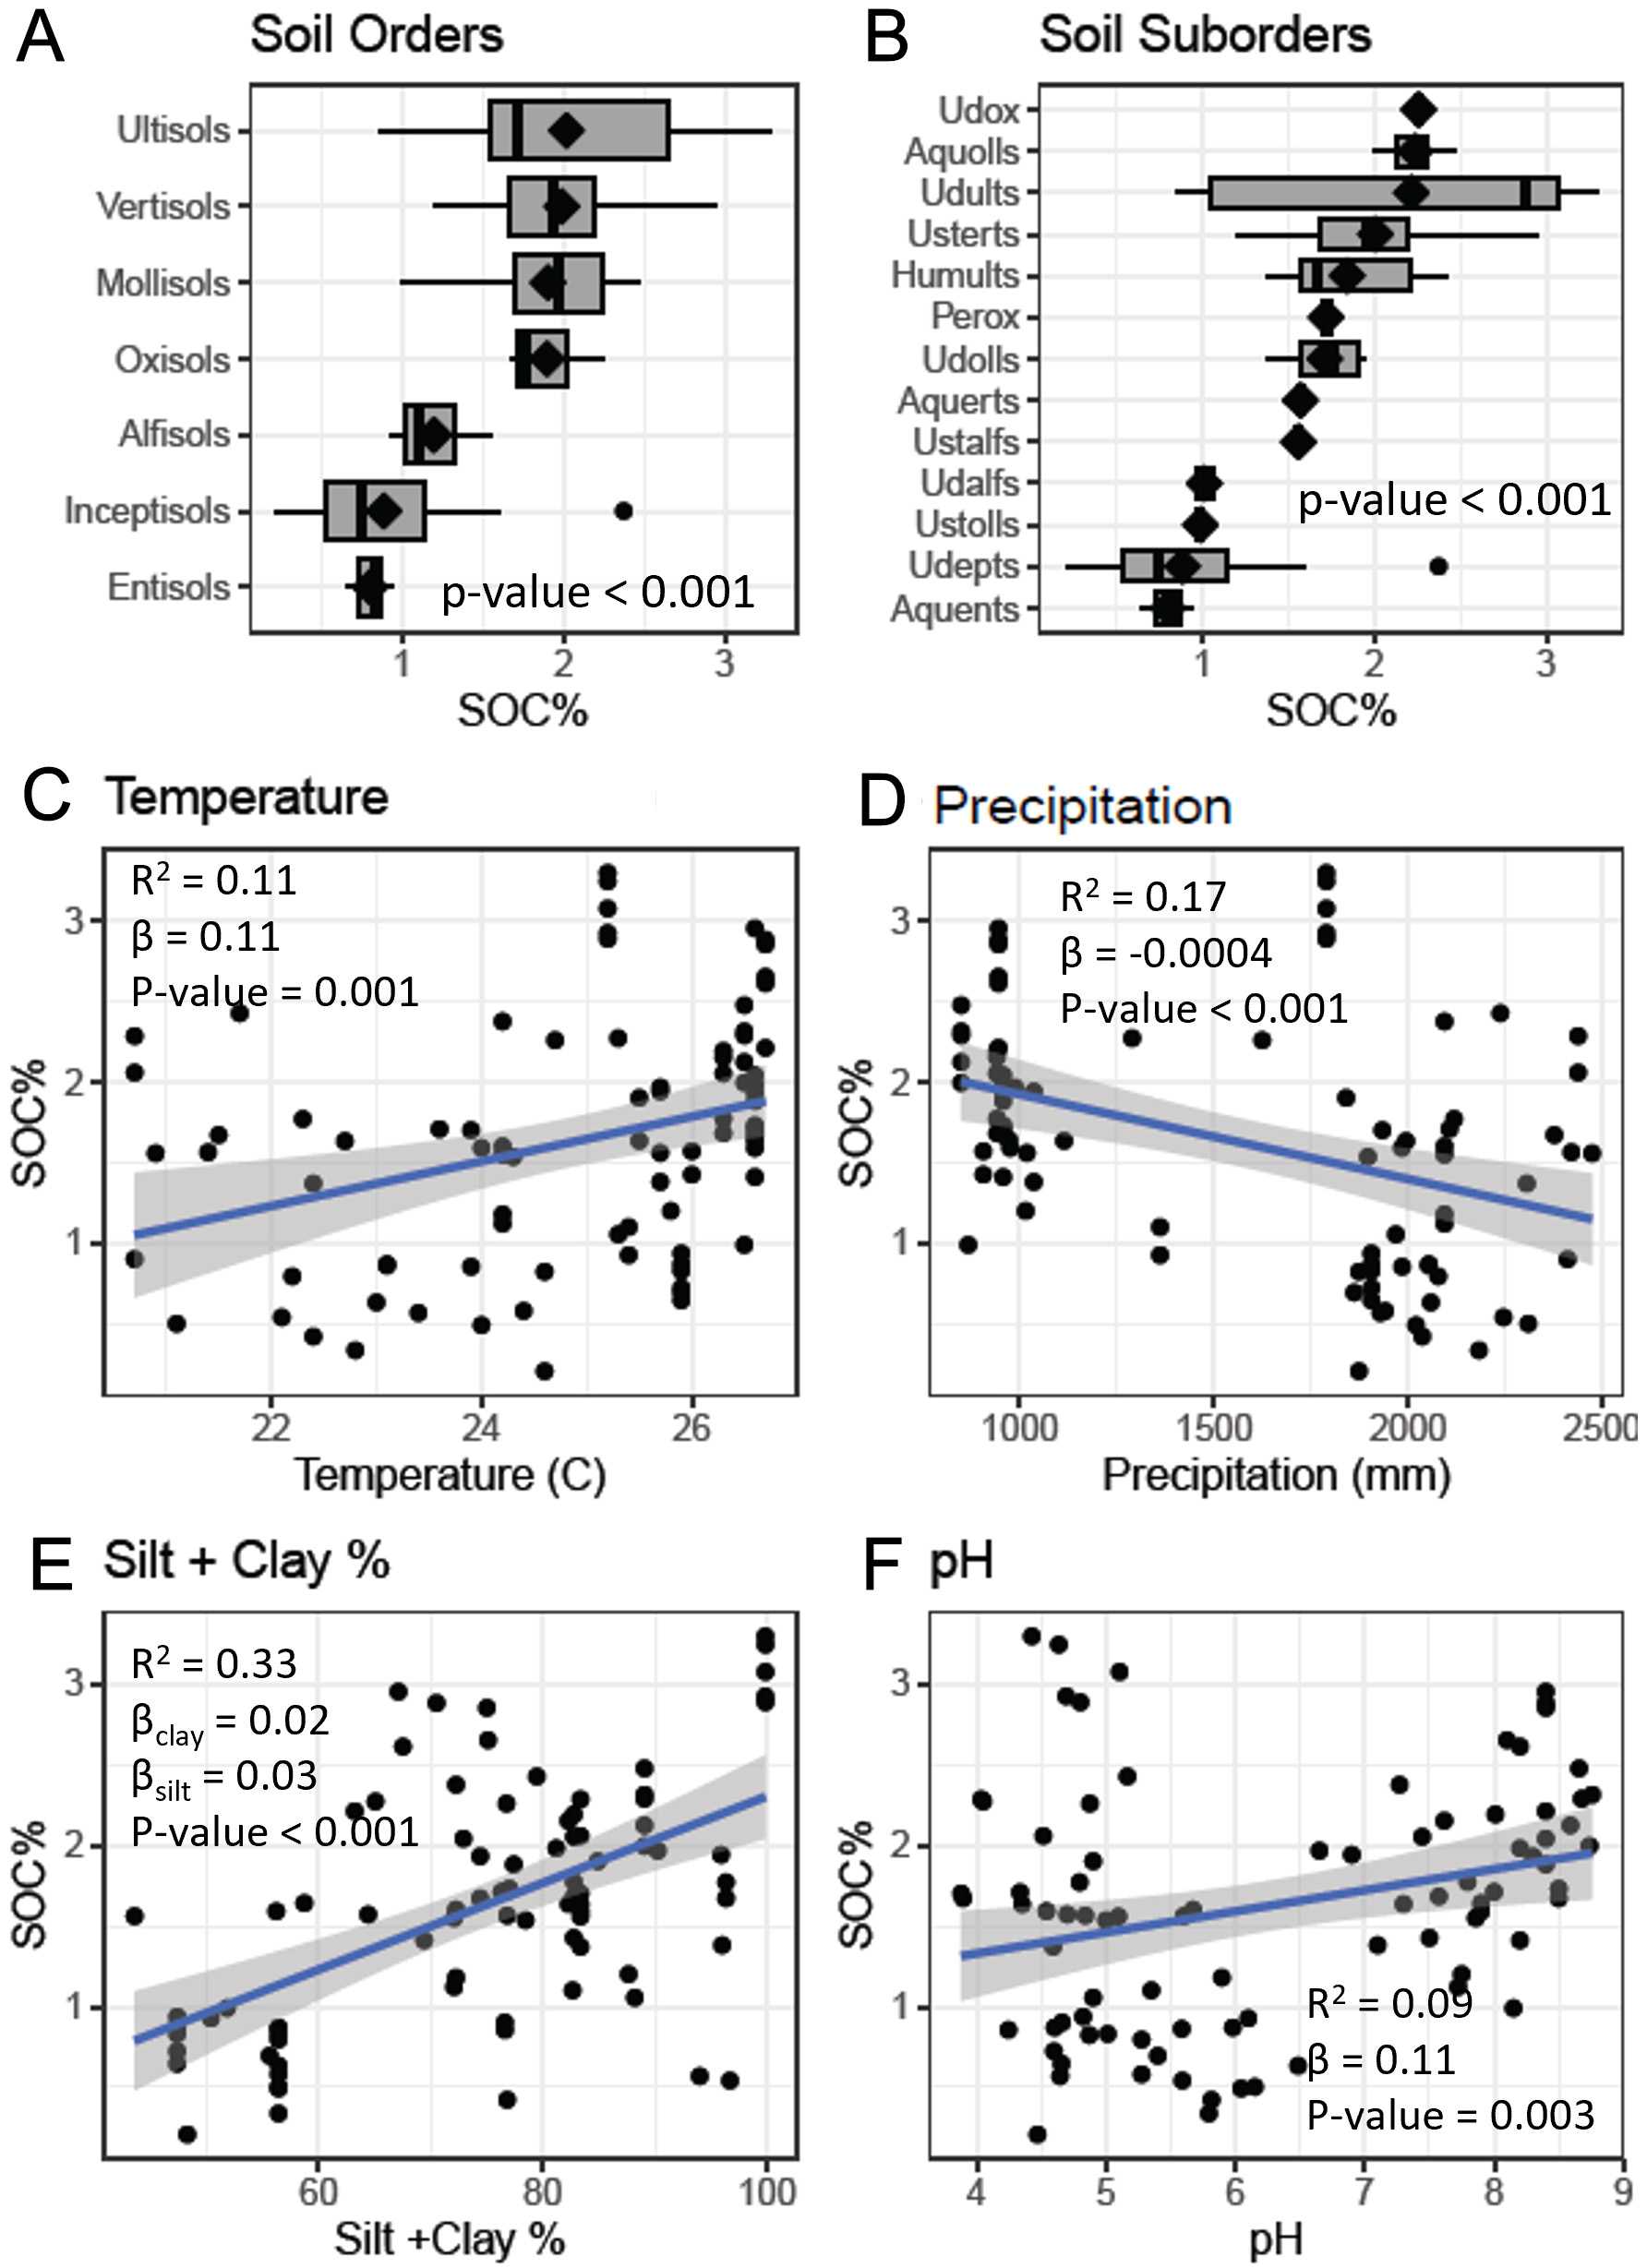
Figure 3. Agricultural lands soil organic content distribution across (A) soil orders, (B) soil suborders, (C) mean annual temperature, (D) mean annual precipitation, (E) Silt + Clay, and (F) pH across a database of 586 pedons in Puerto Rico. SOC: Soil organic carbon.
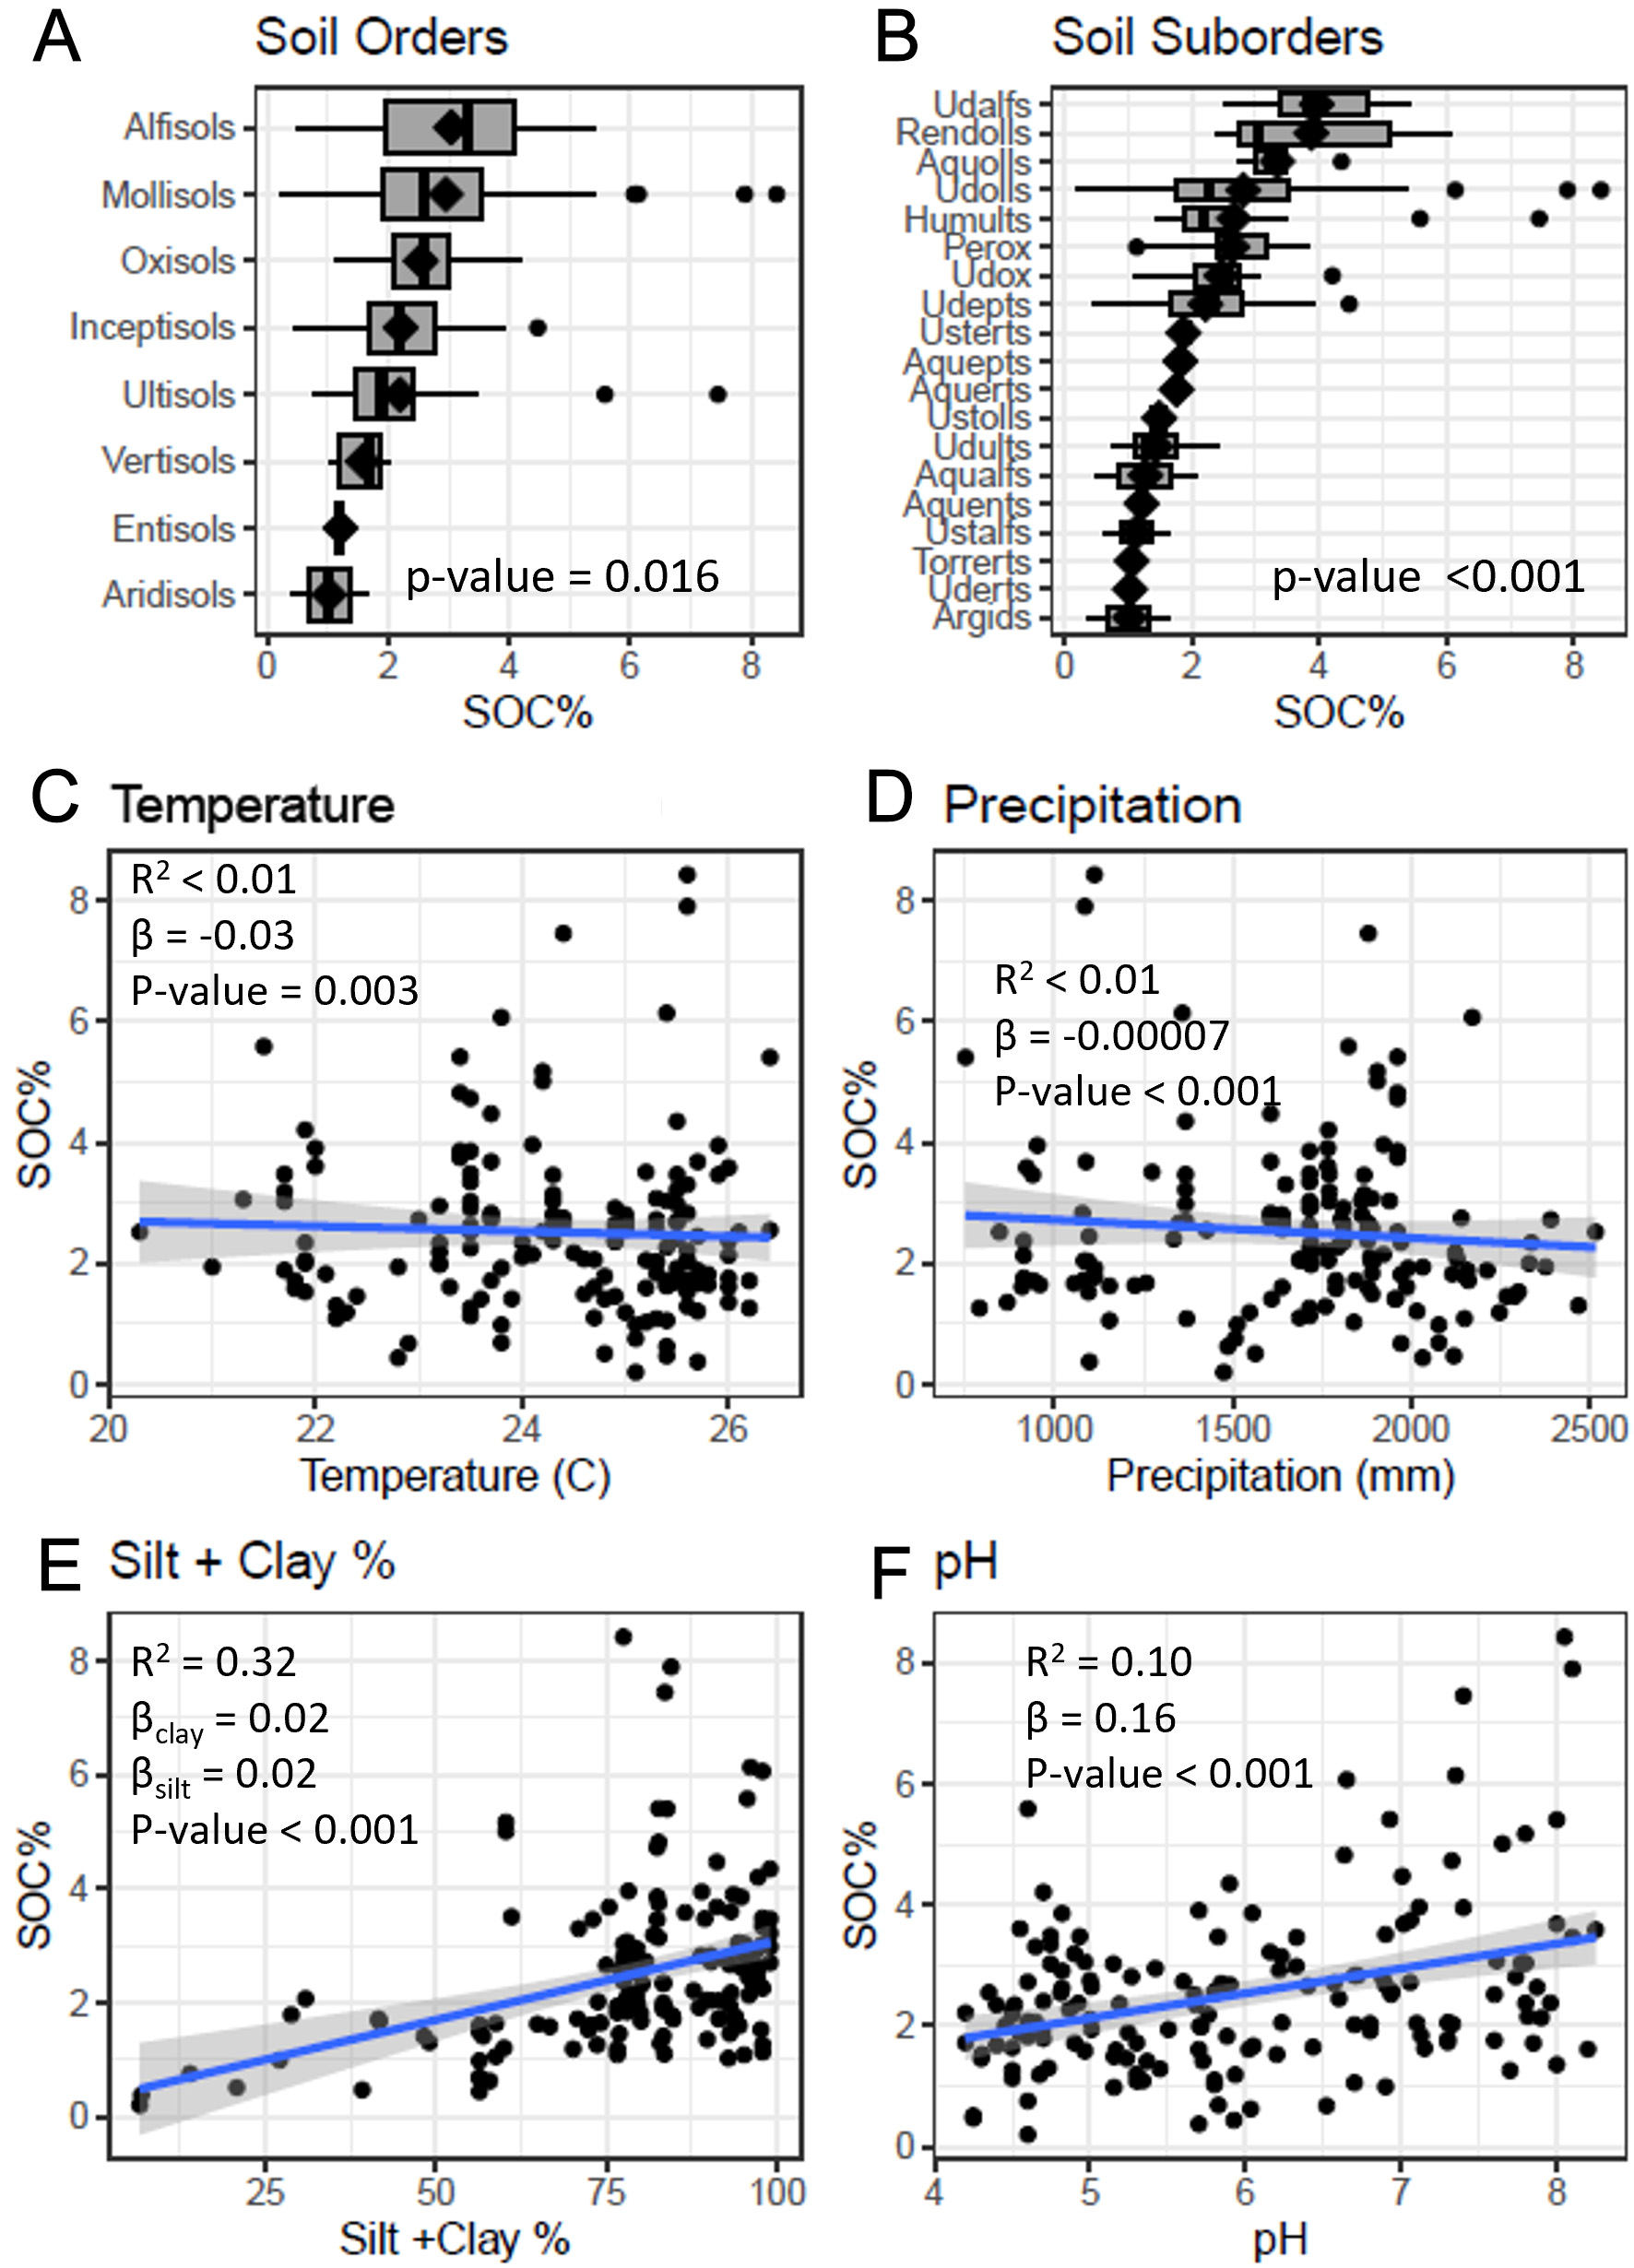
Figure 4. Pasture lands soil organic content distribution across (A) soil orders, (B) soil suborders, (C) mean annual temperature, (D) mean annual precipitation, (E) Silt + Clay, and (F) pH across a database of 586 pedons in Puerto Rico. SOC: Soil organic carbon.
Analysis of variance testing difference of SOC among soil orders, suborders, and USDA texture classification across a database of 586 pedons in Puerto Rico
| Factors | Df | Sum of squares | Mean of squares | F value | P-value | |
| Agricultural lands | ||||||
| Soil order | 6 | 14.970 | 2.495 | 15.720 | < 0.0001 | |
| Residuals | 78 | 12.380 | 0.159 | |||
| Soil suborder | 12 | 15.840 | 1.320 | 8.260 | < 0.0001 | |
| Residuals | 72 | 11.510 | 0.160 | |||
| USDA texture classification | 7 | 7.241 | 1.034 | 3.962 | 0.001 | |
| Residuals | 77 | 20.104 | 0.261 | |||
| Pasture lands | ||||||
| Soil order | 7 | 5.690 | 0.812 | 2.575 | 0.016 | |
| Residuals | 152 | 47.950 | 0.315 | |||
| Soil suborder | 18 | 15.660 | 0.870 | 3.230 | < 0.0001 | |
| Residuals | 141 | 37.980 | 0.269 | |||
| USDA texture classification | 9 | 19.080 | 2.120 | 9.202 | <0.0001 | |
| Residuals | 150 | 34.550 | 0.230 | |||
| Forest lands | Soil order | 6 | 11.060 | 1.844 | 3.386 | 0.003 |
| Residuals | 289 | 157.370 | 0.545 | |||
| Soil suborder | 17 | 82.930 | 4.878 | 15.860 | < 0.0001 | |
| Residuals | 278 | 85.510 | 0.308 | |||
| USDA texture classification | 10 | 38.320 | 3.832 | 8.364 | < 0.0001 | |
| Residuals | 282 | 129.200 | 0.458 |
Regression analysis results from testing SOC relationship to MAT, MAP, silt + clay %, and soil pH across a database of 586 pedons in Puerto Rico
| Factors | Estimate | Standard error | T-value | P-value | F value | R2 | |
| Agricultural lands | |||||||
| Intercept | -6.952 | 0.820 | -8.483 | < 0.0001 | 11.050 | 0.107 | |
| MAT | 0.109 | 0.033 | 3.324 | 0.001 | |||
| Intercept | -3.550 | 0.168 | -21.150 | < 0.0001 | 18.750 | 0.174 | |
| MAP | 0.000 | 0.000 | -4.330 | < 0.0001 | |||
| Intercept | -5.919 | 0.263 | -22.534 | < 0.0001 | 21.500 | 0.328 | |
| Clay% | 0.018 | 0.003 | 5.231 | < 0.0001 | |||
| Silt% | 0.027 | 0.004 | 6.114 | < 0.0001 | |||
| Intercept | -4.937 | 0.239 | -20.660 | < 0.0001 | 9.178 | 0.089 | |
| pH | 0.112 | 0.037 | 3.030 | 0.003 | |||
| Pasture lands | |||||||
| Intercept | -3.045 | 0.829 | -3.674 | < 0.0001 | 0.833 | -0.001 | |
| MAT | -0.031 | 0.034 | -0.913 | 0.363 | |||
| Intercept | -3.670 | 0.201 | -18.227 | < 0.0001 | 0.438 | -0.004 | |
| MAP | 0.000 | 0.000 | -0.662 | 0.509 | |||
| Intercept | -5.222 | 0.167 | -31.203 | < 0.0001 | 38.090 | 0.320 | |
| Clay% | 0.018 | 0.002 | 8.005 | < 0.0001 | |||
| Silt% | 0.017 | 0.002 | 7.227 | < 0.0001 | |||
| Intercept | -4.735 | 0.226 | -20.920 | < 0.0001 | 17.840 | 0.096 | |
| pH | 0.157 | 0.037 | 4.224 | < 0.0001 | |||
| Forest lands | |||||||
| Intercept | 0.606 | 0.588 | 1.029 | 0.304 | 49.500 | 0.142 | |
| MAT | -0.177 | 0.025 | -7.036 | < 0.0001 | |||
| Intercept | -4.578 | 0.176 | -25.967 | < 0.0001 | 37.900 | 0.112 | |
| MAP | 0.001 | 0.000 | 6.157 | < 0.0001 | |||
| Intercept | -5.194 | 0.205 | -25.345 | < 0.0001 | 34.670 | 0.187 | |
| Clay% | 0.019 | 0.003 | 7.172 | < 0.0001 | |||
| Silt% | 0.023 | 0.003 | 7.799 | < 0.0001 | |||
| Intercept | -3.689 | 0.208 | -17.738 | < 0.0001 | 0.566 | -0.001 | |
| pH | 0.028 | 0.037 | 0.752 | 0.453 |
Agricultural soils
Soil order (P < 0.001, R2 = 0.51) and suborder (P < 0.001, R2 = 0.50) were strong predictors of SOC in agricultural soils. Climate variables also contributed (MAT: P = 0.001, R2 = 0.10; MAP: P < 0.001, R2 = 0.17). Among soil properties, silt + clay (P < 0.001, R2 = 0.32) and texture class (P < 0.001, R2 = 0.19) explained 20%-32% of variability, while pH had a negligible effect (P = 0.003, R2 = 0.08). A stepwise multiple regression identified a best-fit model for agricultural soils including soil order, silt + clay, MAT, and pH (P < 0.001, R2 = 0.60; Table 5).
Stepwise model results for best model for SOC on each land use type and the whole region of Puerto Rico
| R2 | F value | P-value | ||
| Agricultural lands | SOC = o β0 + β1(Soil Oder) + β2(Silt+Clay) + β3(Annual Temperature) + β4(pH) + e | 0.60 | 15.09 | < 0.0001 |
| Pasture lands | SOC = β0 + β1(Soil Suborder) + β2(Silt+Clay) + β3(pH) + e | 0.45 | 7.674 | < 0.0001 |
| Forest lands | SOC = β0 + β1(Soil Suborder) + β2(Texture Classification) + β3(Annual Temperature) + e | 0.598 | 17.66 | < 0.0001 |
| Whole region | SOC = β0 + β1(Soil Suborder) + β2(Land use type) + β3(Texture Classification) + β4(pH) + β5(Annual Temperature) + e | 0.55 | 18.34 | < 0.0001 |
Pasture soils
Suborder (P < 0.001, R2 = 0.20) explained more variability in SOC than soil order (P = 0.015, R2 = 0.06) for pasture soils [Figure 4]. In contrast to the agricultural soils, MAT (P = 0.36) and MAP (P = 0.509) were not significant. Silt + clay (P < 0.001, R2 = 0.32) and texture class (P < 0.001, R2 = 0.32) were each associated with about one-third of the variance; pH contributed to 10% (P = 0.003, R2 = 0.10). The best stepwise model for pastures included suborder, silt + clay, and pH (P < 0.001, R2 = 0.45; Table 5).
Factors affecting soil organic carbon in forest soils
In forests [Tables 3 and 4, Figure 5], suborder emerged as the dominant factor (P < 0.001, R2 = 0.46), explaining almost half of the variability in SOC, whereas soil order contributed little (P = 0.003, R2 = 0.05). This striking contrast underscores the value of finer taxonomic resolution when evaluating SOC variability within forest soils. Climate variables were significant (MAT: P = 0.001, R2 = 0.14; MAP: P < 0.001, R2 = 0.11) although they did not explain a large source of the variability on their own. Silt + clay (P < 0.001, R2 = 0.19) and texture class (P < 0.001, R2 = 0.20) were also associated with SOC, whereas pH was not (P = 0.452, R2 < 0.001). A stepwise regression identified suborder, texture class, and MAT as the best model (P < 0.001, R2 = 0.60; Table 5).
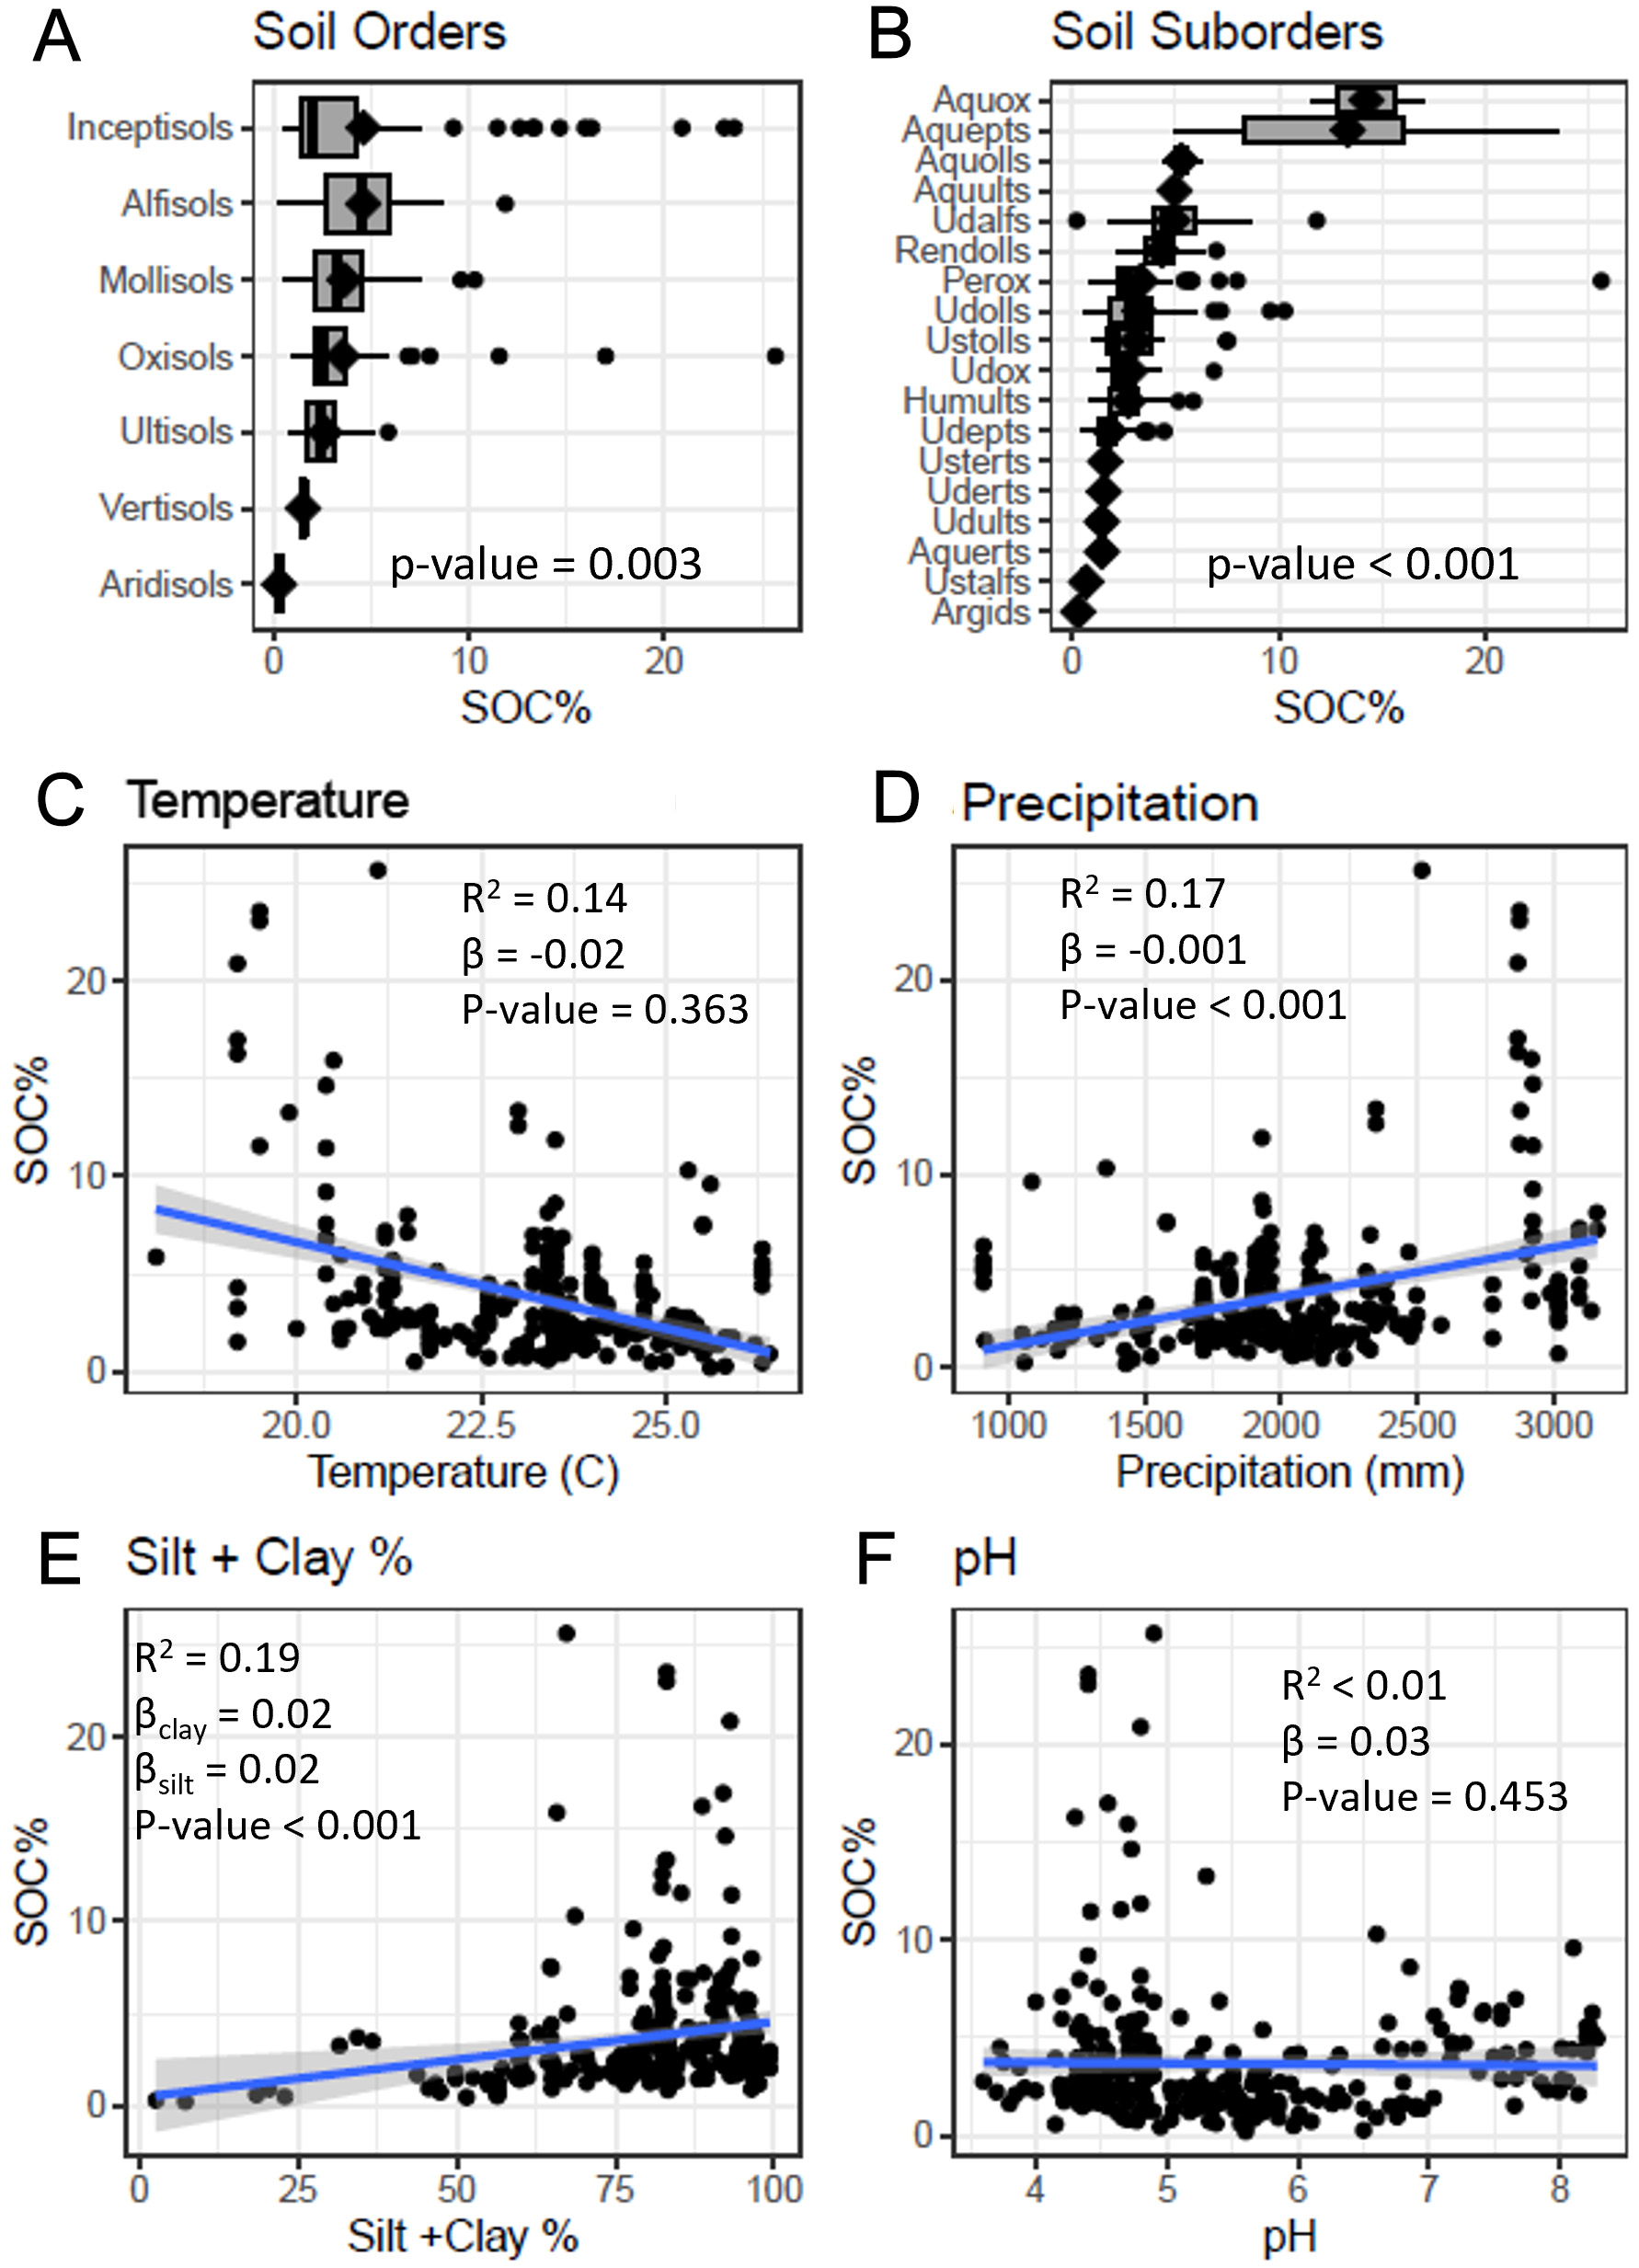
Figure 5. Forests soil organic content soil organic content distribution across (A) soil orders, (B) soil suborders, (C) mean annual temperature, (D) mean annual precipitation, (E) Silt + Clay, and (F) pH across a database of 586 pedons in Puerto Rico. SOC: Soil organic carbon.
Development of a SOC benchmark
Scores Benchmark: To identify island-wide drivers of SOC across land uses, we fit a consolidated stepwise regression that included land use as a factor. The best model comprised soil suborder, land-use type, texture class, MAT, and soil pH (P < 0.001, R2 = 0.55; Table 5). Due to limited sample size within each soil suborder, we decided to continue developing the benchmark using the soil order taxonomic level [Figure 6].
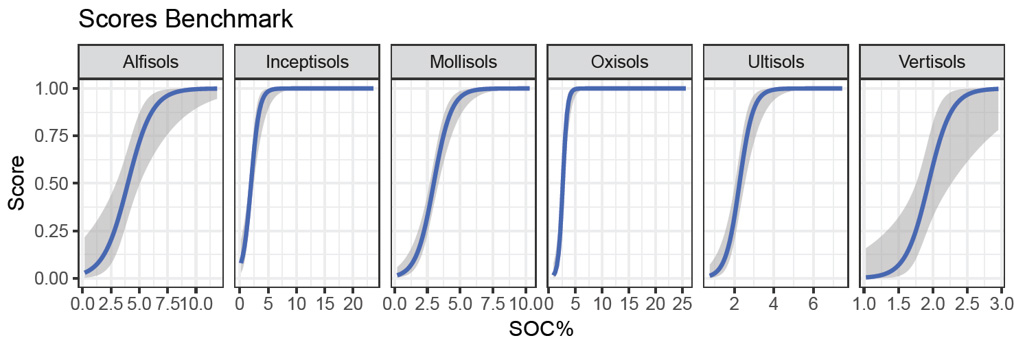
Figure 6. Soil organic carbon Score Benchmark calculated using an empirical cumulative distribution by soil order across a database of 586 pedons in Puerto Rico. SOC: Soil organic carbon.
The validation of the model resulted in an R2 = 0.59 with RMSE = 0.49 [Figure 7], indicating moderate predictive skill sufficient for comparative scoring at regional scales, while leaving room for improvement with added management variables.
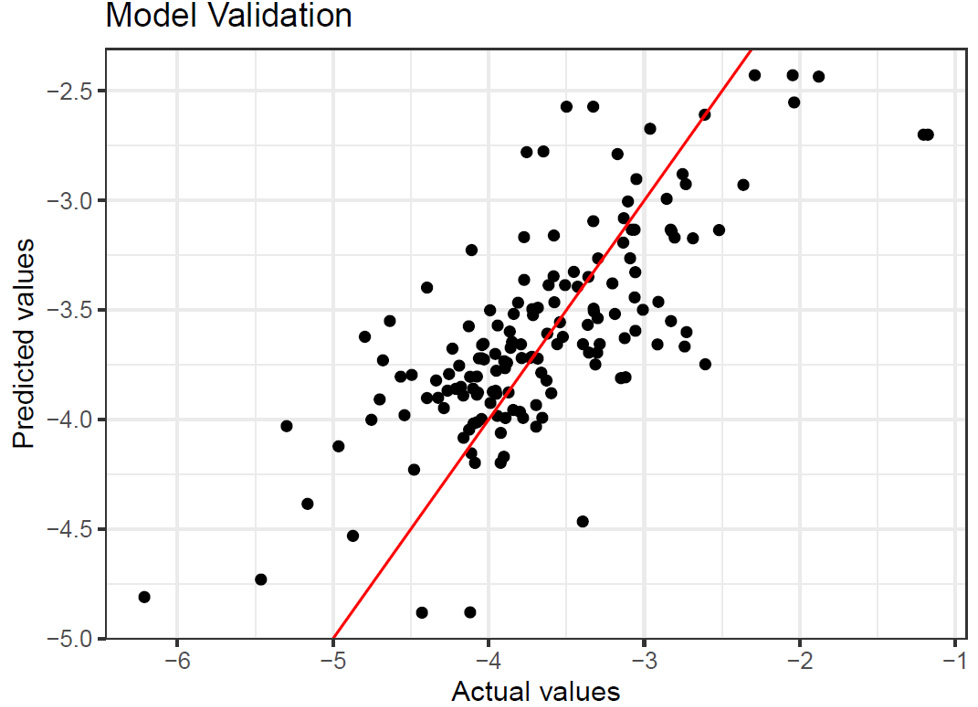
Figure 7. Random forest model validation. RMSE: Root-mean-square error.
The Random Forest analysis of variable importance (IncMSE) indicated that all candidate variables, including MAP and soil order, exceeded the 20% threshold [Figure 8], supporting their inclusion in benchmark development.
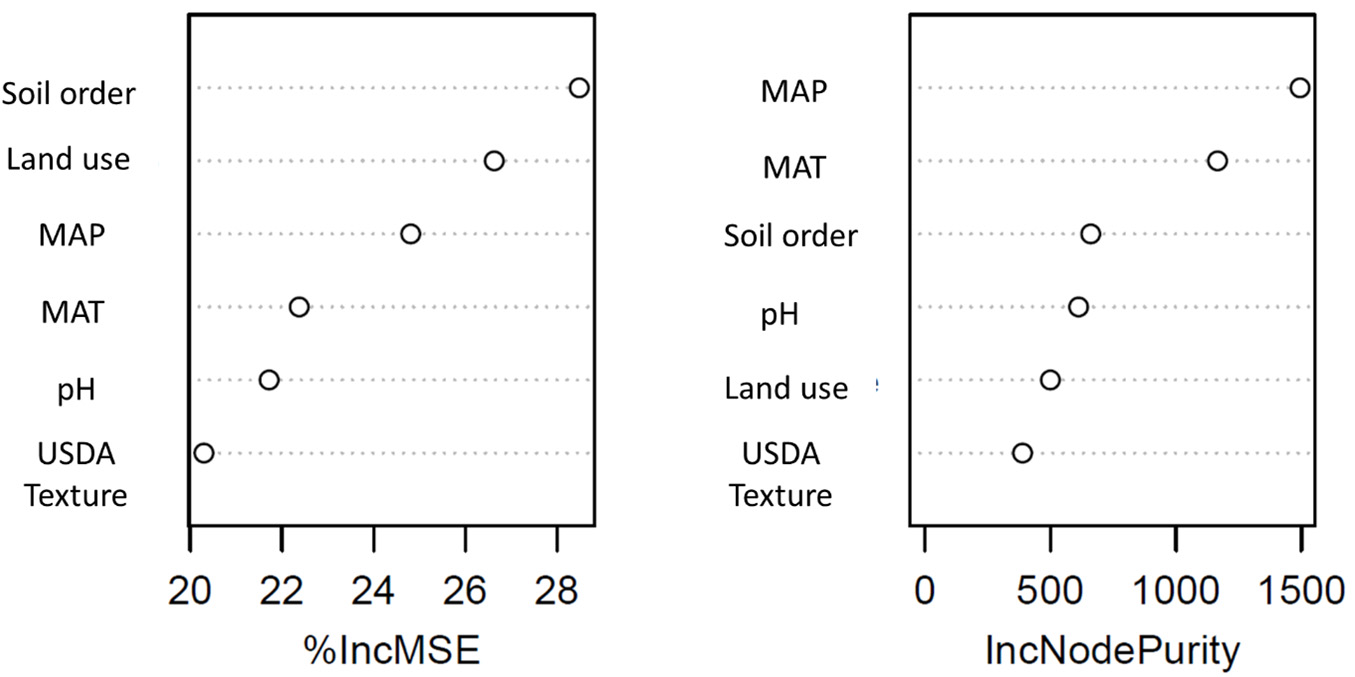
Figure 8. Random forest variable importance. MAP: Mean annual precipitation; MAT: mean annual temperature, USDA Texture: US department of agriculture texture classifications.
Soil Health Gap Benchmark: We calculated the land use gap as mean SOC in forests minus SOC in agriculture or pastures [Figure 9], and within each soil order and climate class [Figure 10]. Forests on Alfisols, Inceptisols, Mollisols, Oxisols, and Ultisols had greater SOC than managed lands, whereas on Aridisols and Vertisols, forests had reduced SOC. Soil order significantly influenced the magnitude of the gap between forests and managed land uses (P = 0.012; Table 6). The gap was larger for agriculture than pastures (P = 0.068; Figure 9). Incorporating climatic variables sharpened these contrasts underscoring climate’s modulation of the gap direction [Figure 10].
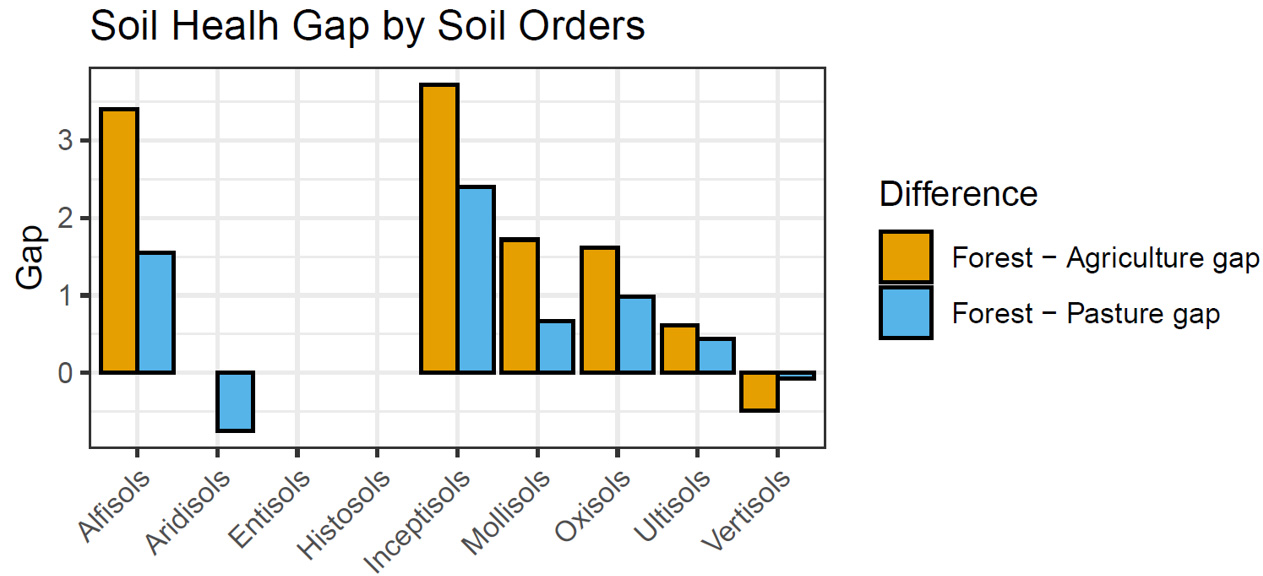
Figure 9. Soil organic carbon Soil Health Gap Benchmark by soil order. Gap: The difference of SOC % in forest vs. agricultural lands or pastures. SOC: Soil organic carbon.
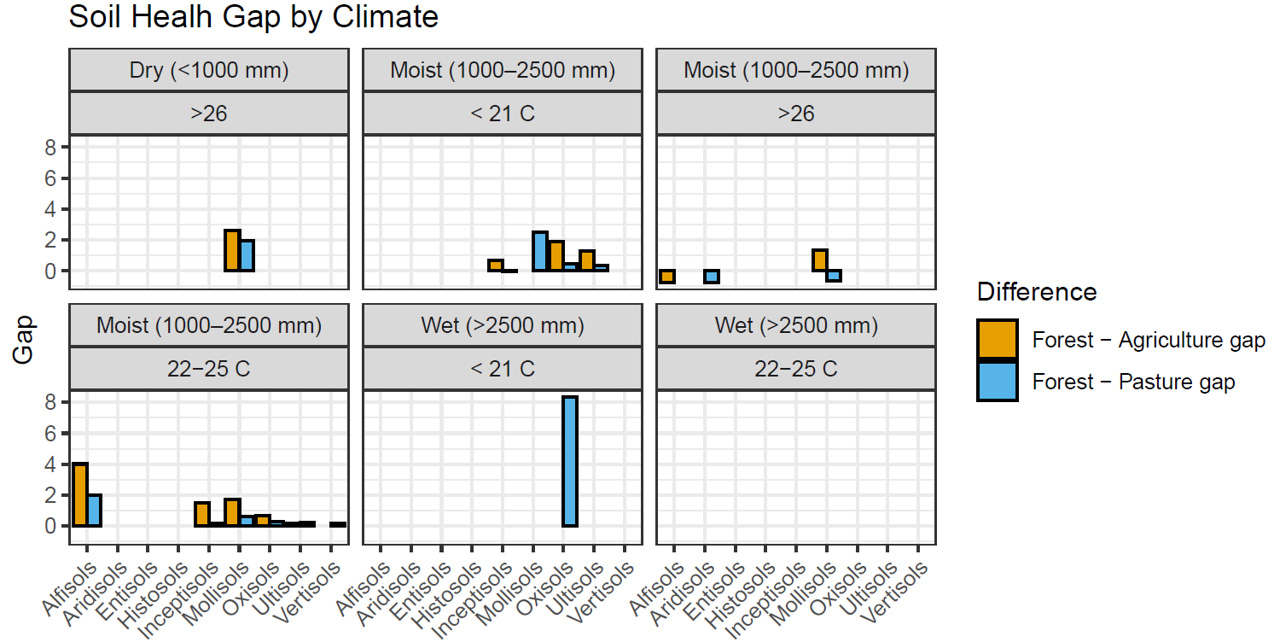
Figure 10. Soil organic carbon Soil Health Gap Benchmark by soil order and climate classes. Gap: The difference of SOC in forest vs. agricultural lands or pastures. SOC: Soil organic carbon.
Analysis of variance testing difference of SOC gap among soil orders and land use type across a database of 586 pedons in Puerto Rico
| Df | Sum of squares | Mean of squares | F value | P-value | |
| Soil order | 6 | 19.231 | 3.205 | 9.708 | 0.0123 |
| Land use type | 1 | 1.774 | 1.774 | 5.372 | 0.0682 |
| Residuals | 5 | 1.651 | 0.33 |
Together, these results highlight contrasting strengths and limitations of the two benchmark approaches. The Scores Benchmark captured continuous SOC variability across soil orders and climatic gradients with moderate predictive skill, supporting its use for regional-scale comparisons. In contrast, the Soil Health Gap Benchmark revealed large variability in SOC differences between forests and managed lands that depended strongly on soil order and climate class, indicating greater sensitivity to reference conditions and environmental context.
DISCUSSION
This study provides a regional-scale assessment of SOC variability across a diversity of tropical soil environments in Puerto Rico. By combining 586 pedons spanning nine soil orders, multiple climates, and contrasting land uses, we evaluated environmental and edaphic controls on SOC and examined two benchmark approaches, the Soil Health Gap and the Scores Benchmark, to assess soil health. Together, these results highlight the complexity of soil carbon dynamics in tropical agroecosystems and the need for flexible frameworks that account for land-use history, soil properties, and climatic heterogeneity.
Variability in SOC across different land uses
The results of our study highlight the strong influence of vegetation cover and land use change on SOC dynamics. SOC concentrations were highly variable in forested areas and wetlands. In forests, this variability reflects a combination of factors, including land use legacies, climatic gradients, and intrinsic soil characteristics. Historical disturbances such as deforestation, grazing, and cultivation could have left persistent imprints on SOC in the secondary forests[18].
Consequently, forest soils today represent a mosaic of successional stages, with many secondary forests still recovering belowground carbon despite aboveground biomass regrowth. In Puerto Rico, that majority of forest cover is in different stages of recovery from past agricultural or pasture use[40], reflecting the island’s long history of deforestation and reforestation cycles that continue to shape present-day soil-carbon stocks. Similar patterns of carbon accumulation in secondary tropical forests have been documented across U.S. Caribbean forests[53], where soil organic carbon storage depends strongly on forest age, disturbance history, and climatic zone. Climatic variability, particularly in temperature and precipitation, further modulates decomposition and organic matter inputs[54], while textural and mineralogical differences influence carbon stabilization mechanisms[6,29]. These interacting factors explain the wide range of SOC values observed in our forest sites and underscore the importance of considering both ecological and historical context when interpreting land-use effects.
Differences in SOC among forests, pastures, and agricultural systems in Puerto Rico reflect not only contrasting land-use histories but also fundamentally different pathways of organic matter input and decomposition environments that regulate carbon stabilization. Forest soils are primarily influenced by surface-derived inputs from leaf litter and woody debris, which break down within organic horizons and near-surface mineral layers, producing vertically stratified SOC pools that are sensitive to microclimate, litter quality, and moisture availability[18,55]. Consistent with this mechanism, forest SOC in our study exhibited high variability and strong dependence on soil suborder and climate, particularly mean annual temperature and precipitation, reflecting heterogeneous decomposition environments determined by successional stage and climatic gradients. In contrast, pasture and agricultural systems are dominated by root-derived carbon inputs and experience varying degrees of soil disturbance, which alter microbial decomposition efficiency and promote greater incorporation of organic carbon into mineral-associated organic matter (MAOM) rather than particulate organic matter (POM)[29,56]. This mechanism is consistent with our results showing that silt + clay content explained a substantial proportion of SOC variability in pastures and agricultural lands, while climatic variables were comparatively weak predictors, particularly in pastures. In tropical systems, the balance between these decomposition and stabilization pathways is further modulated by soil mineralogy and land-use legacies, leading to divergent SOC trajectories following land-use change[19]. Collectively, these mechanistic differences help explain why some pasture soils in our dataset exhibited SOC concentrations comparable to forests, whereas agricultural soils showed consistently lower SOC and reduced variability, underscoring the need for benchmark frameworks that explicitly account for land-use - specific decomposition pathways and edaphic controls when interpreting SOC variability in heterogeneous tropical landscapes. Although we did not directly quantify SOC fractions or microbial processes in this study, these established mechanisms provide a useful framework for interpreting the land-use - specific patterns observed in our dataset[57].
Large SOC variance in wetland soils can likewise be attributed to the diverse range of soil orders, hydrologic regimes, and climatic conditions encompassed in our dataset. Wetland pedons included Entisols, Histosols, Inceptisols, Mollisols, Ultisols, and Vertisols, spanning mean annual temperatures of 25.4-26.5 °C and precipitation from 867-1,864 mm. Variations in water saturation frequency and soil characteristics shape the intensity of redox-driven biogeochemical processes[58]. For example, Vertisols in drier areas contained 1%-7% SOC, while Histosols and Entisols in saturated environments such as mangrove swamps, marshes, and floodplains reached 7%-25% SOC. These contrasts indicate that wetlands act as carbon hotspots, but their hydrologic uniqueness also means they should be considered a distinct benchmark category rather than directly compared to well-drained soils. Wetland soils in Puerto Rico also have a long history of cultivation and other agricultural use, which affects their hydrology and SOC dynamics[59-61].
Agricultural soils exhibited the lowest SOC concentration and variance as expected. This limited variability likely results from management homogenization, where residue removal and high biomass export constrain organic matter accumulation[40,62]. Although the return of crop residues can replenish SOC[62], our dataset lacked detailed information on crop type or management intensity, preventing finer-scale interpretation. These findings suggest SOC in croplands is primarily constrained by climate and soil, but management homogenization reduces within-class variability.
In contrast, pasture lands showed substantially greater SOC variability reflecting the interactive influence of management and environment. The literature documents divergent SOC responses to forest-to-pasture conversion, with increases[63,64] and decreases[64,65] both reported. In our study, some pastures and agricultural sites, particularly those on Alfisols, Mollisols, and Aridisols, exhibited SOC levels comparable to or even exceeding nearby forests. These patterns suggest that long-term pasture stabilization and continuous vegetation cover can promote SOC retention under favorable soil conditions[54,66,67]. Differences in the magnitude and direction of SOC between pastures and successional forests have been attributed to soil properties (including soil mineralogy), pasture age, grazing intensity and historical legacies of cultivation pre-reforestation[68]. Overall, grasslands and pastures contribute substantial organic inputs through root turnover and permanent cover[69], reinforcing that SOC trajectories following land conversion are not unidirectional but depend on soil type, climate, and management history.
Soil carbon environmental controls vary within land use types
The environmental controls on SOC varied among land use types, revealing distinct drivers of SOC dynamics in soils of the tropics. In forest systems, variability was mainly associated with soil suborder, texture, and temperature, while pH exerted little influence. Many forest pedons in this study are derived from karst, a common substrate in the northern part of Puerto Rico. These soils contain free calcium carbonates, as indicated by strong effervescence reactions both in the field and laboratory[7,70]. These calcareous soils, characterized by high pH and calcium content, can protect organic matter from decomposition through several mechanisms, including cation bridging and mineral-organic complexation[6,32,70,71]. The resulting aggregates enhance physical protection of organic matter[72]. However, in our dataset, acidic soils such as Oxisols also contained high SOC, suggesting that carbon stabilization in forest soils operates through multiple, overlapping pathways rather than a single linear relationship with pH.
Despite representation of a large rainfall gradient in the sites sampled (750-3,200 mm MAP), precipitation had a significant but modest effect on SOC in forests, explaining about 11% of the variance. SOC accretion rates during tropical forest succession are typically greater in moist and wet life zones than in dry forests[69], and temperature can also influence carbon storage during succession[21]. Thus, climatic factors remain important regulators of organic matter turnover and vegetation productivity, even when their statistical influence appears weaker relative to edaphic variables. The relatively low explanatory power of climate variables compared to soil properties emphasizes that SOC dynamics in forest soils depend on complex interactions between climate, mineralogy, and past land use, especially in a geologically diverse region[7].
In agricultural systems, climate and soil properties jointly influenced SOC. Mean annual precipitation explained nearly 20% of the variability, and MAT, soil order, pH, and the proportion of silt + clay together accounted for roughly 60% of SOC variance. These results align with global patterns indicating that SOC in croplands is primarily governed by environmental constraints and secondarily by management practices[9]. Similar relationships have been observed historically in Puerto Rico, where early soil surveys documented strong associations between organic matter and fine-textured fractions under agricultural use[73], and subsequent studies linked climate and land-use legacies to SOC distribution across the island’s reforested and cultivated landscapes[74]. The unexplained variability likely reflects differences in cropping systems, management, and residue, factors not captured in our dataset but known to strongly influence carbon accumulation[75]. The dominance of climatic and soil factors in our models also suggests that intensive management homogenizes surface conditions, thereby reducing the sensitivity of SOC to environmental gradients.
In contrast, pasture lands were predominantly influenced by soil properties, particularly soil suborder, silt + clay content, and pH, which together explained 45% of the SOC variance. Neither MAT nor MAP were significant predictors, contrasting with the global meta-analysis by Dlamini et al.[76], which showed that climate conditions influence the magnitude of SOC responses to grassland degradation. This decoupling of SOC from climate likely reflects the moderating effect of permanent vegetation cover and grazing intensity on organic matter turnover. Fine-textured soils are expected to promote greater SOC content due to the stabilization of organic matter by clay and silt particles, protecting it from decomposition[72,76]. The remaining unexplained variance may be attributed to differences in grazing pressure, compaction, and nutrient inputs, factors that shape SOC cycling but were not captured in our dataset.
Our findings also highlight the importance of soil suborders as a predictor of SOC, especially in forests and pastures. While soil order classification integrates broad pedogenic processes, it often masks critical variations related to moisture and temperature regimes[41] or landforms[33]. Suborder-level differentiation captures these finer environmental controls and therefore provides a more precise framework for interpreting SOC dynamics in tropical landscapes. Whereas Vaughan et al.[7] reported strong relationships between SOC and soil order, our results suggest that suborder-level information, linked to local formation environments, offers improved explanatory power when assessing SOC concentrations across a diversity of tropical soils.
Benchmark models for predicting SOC values regionally
Benchmark models for predicting SOC at regional scales are essential for assessing soil health and guiding agricultural and soil conservation decisions. In this study, we evaluated two models, the Soil Health Gap and the Scores Benchmark, to test their applicability in tropical systems with diverse climates, soil environments, and vegetation types. Both frameworks serve distinct purposes: the Gap Benchmark identifies depletion or recovery relative to reference sites, while the Scores Benchmark quantifies SOC status within the broader regional distribution. Our results show that each has value and also inherent limitations when applied across the heterogeneous landscapes of the tropics.
The Scores Benchmark offers the advantage of translating observed variability into quantitative scores, allowing users to position their SOC values within the expected range for specific environmental conditions.Score-based soil assessment frameworks, including Soil Management Assessment Framework (SMAF[23];), Comprehensive Assessment of Soil Health (CASH[22];), and the more recent Soil Health Assessment Protocol and Evaluation (SHAPE[24];) approach, demonstrate how benchmarking can provide regionally relevant, quantitative metrics that account for edaphic and climatic context and respond to management practices.
In our dataset, soil type, land use, USDA texture class, mean annual temperature, and pH collectively explained about ~50%-60% of SOC variability. Despite excluding explicit management data, the Scores Benchmark achieved moderate predictive accuracy, indicating that environmental variables alone capture much of the SOC variability across a range of soils of the tropics. Future developments should integrate information on tillage, crop type, grazing intensity, and residue management to refine accuracy and extend applicability. Given its ability to represent multiple controlling factors simultaneously and function across scales, the Scores Benchmark provides a more flexible and transferable approach for soil health assessment in diverse tropical landscapes.
The Soil Health Gap Benchmark, in contrast, is more effective at site-level comparisons between agricultural or pasture soils and their forest counterparts. By using forest soil as reference conditions, this model can reveal depletion or enrichment trends associated with management. Its performance, however, depends heavily on the quality of the reference system. In Puerto Rico, where most forests are secondary, SOC values may not represent undisturbed[18], leading to inconsistent gap estimates. Furthermore, applying the Gap Benchmark at large scales introduces uncertainty because climatic gradients strongly affect SOC differences between managed and natural lands[9,26,67]. Temperature, precipitation, and ecological zone interactions can exaggerate or mask true management effects[27,28,77]. The predominance of secondary forests adds additional variability, as studies show that SOC responses during tropical forest succession can range from gains to losses or no net change[11,68,78]. These challenges limit the Gap Benchmark’s scalability beyond localized studies.
Both approaches contribute valuable but different insights. The Scores Benchmark provides a generalized, continuous scale for evaluating soils relative to regional expectations, while the Gap Benchmark offers targeted insights into site-specific carbon loss or recovery. For the tropics, where environmental heterogeneity and land-use history legacies influence soil conditions, score-based models are likely more reliable and scalable. Nevertheless, integrating both frameworks could yield the most robust assessments of SOC to inform soil health characterization: Scores Benchmarks for regional diagnostics and Gap Benchmarks for localized monitoring and management evaluation. As the U.S. Department of Agriculture’s Natural Resources Conservation Service recognizes SOC as a key dynamic property underpinning soil resilience, developing benchmarks that are both scientifically rigorous and accessible to policymakers and farmers remains essential. Our findings indicate that the Scores Benchmark, by contextualizing SOC relative to climatic and edaphic factors, offers the most practical tool for tropical regions, enabling users to determine whether their soils perform above or below the regional carbon potential.
Conclusion
This study evaluated how agriculture, pasture, and forest land uses influence SOC variability across the environmentally heterogeneous landscape of Puerto Rico and used this regional synthesis to evaluate SOC benchmarking approaches for tropical systems. SOC differed among land uses, with soil suborder, land use type, USDA texture classification, mean annual temperature, and soil pH jointly explaining a substantial proportion of observed variability. The magnitude and direction of SOC differences among forests, pastures, and agricultural lands varied across soil orders and climatic conditions, demonstrating that land-use effects on SOC in tropical systems are strongly conditioned by environmental context.
These results are particularly relevant given that much of the existing SOC literature in the tropics has emphasized highly weathered soils and humid environments, despite the broader range of soils, climates, and land-use histories that characterize tropical regions. Our findings show that SOC responses to land use cannot be reliably interpreted using a single reference condition or narrow environmental subset, underscoring the need for benchmarking approaches that accommodate this uneven coverage of tropical conditions.
Comparison of benchmark frameworks highlighted important differences in their applicability. The Soil Health Gap approach was highly sensitive to soil order and climate, reflecting its reliance on reference assumptions that are difficult to satisfy in tropical landscapes shaped by long and complex land-use histories. In contrast, the Scores Benchmark captured SOC variability across diverse soils and land uses by situating observed values within empirically derived distributions, allowing SOC to be evaluated relative to regional environmental and edaphic context rather than assumed undisturbed states.
Together, these results demonstrate that score-based SOC benchmarks offer a practical and scalable framework for addressing gaps in tropical SOC assessment. By grounding interpretation in observed regional variability, this approach supports soil health assessment programs, land-use evaluation, and monitoring efforts in tropical regions where undisturbed reference conditions are limited. In addition, this framework improves the interpretation of SOC data for climate adaptation and mitigation initiatives by providing a scientifically defensible basis for comparing SOC across heterogeneous soils and land-use histories, thereby strengthening the evidence base for management and policy decisions in tropical systems.
DECLARATIONS
Acknowledgments
We would like to express our sincere appreciation to the private landowners who kindly granted permission to access the research sites. Their cooperation and willingness to facilitate fieldwork were essential to the successful completion of this study. We are also deeply grateful to the members of the BiogeoLab for their consistent support, collegiality, and the collaborative environment that enriched this research. We would also like to acknowledge that this manuscript builds in part on research conducted for the doctoral dissertation of the first author (Díaz-Vallejo, 2023), with substantial revision, expansion, and reinterpretation for journal publication.
Authors’ contribution
Made substantial contributions to conception and design of the study and performed data analysis and interpretation: Diaz-Vallejo, E. J.
Performed data acquisition, and technical and material support: Vaughan, E.
Performed data acquisition, as well as provided technical and material support: Sotomayor, D.
Performed data acquisition: Matos, M.; Rios, S.; Santiago, C.
Made contributions to conception and design of the study and provided administrative, technical, and material support: Marin-Spiotta, E.
Availability of data and materials
Data and materials are available from the corresponding authors upon reasonable request.
AI and AI-assisted tools statement
Not applicable
Financial support and sponsorship
Funding was provided by a Vilas Research Award from the University of Wisconsin-Madison, the UW-Madison Department of Geography, U.S. National Science Foundation Behavioral and Cognitive Sciences CAREER Award #1349952 and cooperative agreement #68-7482-12-525 from the U.S. Department of Agricultural Natural Resources Conservation Service National Soil Survey Center to EMS. Support was also provided by an Evelyn L. Pruitt Fellowship from the Society of Women Geographers, an O.N. Allen Soil and Environmental Microbiology Small Grant, and an Advanced Opportunity Fellowship from the University of Wisconsin-Madison to EDV.
Conflicts of interest
All authors declared that there are no conflicts of interest
Ethical approval and consent to participate
Not applicable.
Consent for publication
Not applicable.
Copyright
© The Author(s) 2026.
Supplementary Materials
REFERENCES
2. Kleber, M.; Bourg, I. C.; Coward, E. K.; Hansel, C. M.; Myneni, S. C. B.; Nunan, N. Dynamic interactions at the mineral-organic matter interface. Nat. Rev. Earth. Environ. 2021, 2, 402-21.
3. Henneron, L.; Balesdent, J.; Alvarez, G.; et al. Bioenergetic control of soil carbon dynamics across depth. Nat. Commun. 2022, 13, 7676.
4. Liptzin, D.; Norris, C. E.; Cappellazzi, S. B.; et al. An evaluation of carbon indicators of soil health in long-term agricultural experiments. Soil. Biol. Biochem. 2022, 172, 108708.
5. Koorneef, G. J.; Pulleman, M. M.; Comans, R. N.; et al. Assessing soil functioning: what is the added value of soil organic carbon quality measurements alongside total organic carbon content? Soil. Biol. Biochem. 2024, 196, 109507.
6. Rasmussen, C.; Heckman, K.; Wieder, W. R.; et al. Beyond clay: towards an improved set of variables for predicting soil organic matter content. Biogeochemistry 2018, 137, 297-306.
7. Vaughan, E.; Matos, M.; Ríos, S.; Santiago, C.; Marín-spiotta, E. Clay and climate are poor predictors of regional-scale soil carbon storage in the US Caribbean. Geoderma 2019, 354, 113841.
8. Luo, Y.; Ahlström, A.; Allison, S. D.; et al. Toward more realistic projections of soil carbon dynamics by Earth system models. Global. Biogeochem. Cycles. 2016, 30, 40-56.
9. Zhao, Y.; Xu, Y.; Cha, X.; et al. A global meta-analysis of land use change on soil mineral-associated and particulate organic carbon. Glob. Chang. Biol. 2025, 31, e70111.
10. Ma, Y.; Xie, T.; Li, X. Spatial variation of soil organic carbon in the Qinghai Lake watershed, northeast Qinghai-Tibet Plateau. CATENA 2022, 213, 106187.
11. Powers, J. S.; Corre, M. D.; Twine, T. E.; Veldkamp, E. Geographic bias of field observations of soil carbon stocks with tropical land-use changes precludes spatial extrapolation. Proc. Natl. Acad. Sci. U. S. A. 2011, 108, 6318-22.
12. Veldkamp, E.; Schmidt, M.; Powers, J. S.; Corre, M. D. Deforestation and reforestation impacts on soils in the tropics. Nat. Rev. Earth. Environ. 2020, 1, 590-605.
13. Smith, P.; Soussana, J. F.; Angers, D.; et al. How to measure, report and verify soil carbon change to realize the potential of soil carbon sequestration for atmospheric greenhouse gas removal. Glob. Chang. Biol. 2020, 26, 219-41.
14. Poeplau, C.; Don, A. Sensitivity of soil organic carbon stocks and fractions to different land-use changes across Europe. Geoderma 2013, 192, 189-201.
15. Janzen, H. H.; Janzen, D. W.; Gregorich, E. G. The ‘soil health’ metaphor: Illuminating or illusory? Soil. Biol. Biochem. 2021, 159, 108167.
16. Maharjan, B.; Das, S.; Acharya, B. S. Soil health gap: a concept to establish a benchmark for soil health management. Glob. Ecol. Conserv. 2020, 23, e01116.
17. Food and Agriculture Organization of the United Nations (FAO). Status of the world’s soil resources (summary report). Rome (IT): FAO; 2015. https://www.fao.org/fileadmin/user_upload/newsroom/docs/FAO-world-soils-report-SUMMARY.pdf (accessed 2026-03-12).
18. Poorter, L.; Craven, D.; Jakovac, C. C.; et al. Multidimensional tropical forest recovery. Science 2021, 374, 1370-6.
19. Keller, N.; Anthony, M. A.; van der Voort, T. S.; et al. Soil carbon as a blind spot in tropical rainforest restoration. Curr. Biol. 2025, 35, R765-81.
20. Robinson, N.; Drever, C. R.; Gibbs, D. A.; et al. Protect young secondary forests for optimum carbon removal. Nat. Clim. Chang. 2025, 15, 793-800.
21. Marín‐spiotta, E.; Sharma, S. Carbon storage in successional and plantation forest soils: a tropical analysis. Glob. Ecol. Biogeogr. 2012, 22, 105-17.
22. Idowu, O.; Van Es, H.; Abawi, G.; et al. Use of an integrative soil health test for evaluation of soil management impacts. Renew. Agric. Food. Syst. 2009, 24, 214-24.
23. Andrews, S. S.; Karlen, D. L.; Cambardella, C. A. The soil management assessment framework: a quantitative soil quality evaluation method. Soil. Sci. Soc. Am. J. 2004, 68, 1945-62.
24. Nunes, M. R.; Veum, K. S.; Parker, P. A.; et al. The soil health assessment protocol and evaluation applied to soil organic carbon. Soil. Sci. Soc. Am. J. 2021, 85, 1196-213.
25. Luo, Z.; Feng, W.; Luo, Y.; Baldock, J.; Wang, E. Soil organic carbon dynamics jointly controlled by climate, carbon inputs, soil properties and soil carbon fractions. Glob. Chang. Biol. 2017, 23, 4430-9.
26. Wiesmeier, M.; Urbanski, L.; Hobley, E.; et al. Soil organic carbon storage as a key function of soils - a review of drivers and indicators at various scales. Geoderma 2019, 333, 149-62.
27. Zhang, S.; Wang, M.; Xiao, L.; et al. Reconciling carbon quality with availability predicts temperature sensitivity of global soil carbon mineralization. Proc. Natl. Acad. Sci. U. S. A. 2024, 121, e2313842121.
28. Hobley, E. U.; Baldock, J.; Wilson, B. Environmental and human influences on organic carbon fractions down the soil profile. Agric. Ecosyst. Environ. 2016, 223, 152-66.
29. Lavallee, J. M.; Soong, J. L.; Cotrufo, M. F. Conceptualizing soil organic matter into particulate and mineral-associated forms to address global change in the 21st century. Glob. Chang. Biol. 2020, 26, 261-73.
30. Heckman, K.; Hicks Pries, C. E.; Lawrence, C. R.; et al. Beyond bulk: density fractions explain heterogeneity in global soil carbon abundance and persistence. Glob. Chang. Biol. 2022, 28, 1178-96.
31. Sokol, N. W.; Whalen, E. D.; Jilling, A.; Kallenbach, C.; Pett‐ridge, J.; Georgiou, K. Global distribution, formation and fate of mineral‐associated soil organic matter under a changing climate: a trait‐based perspective. Funct. Ecol. 2022, 36, 1411-29.
32. Manzoni, S.; Cotrufo, M. F. Mechanisms of soil organic carbon and nitrogen stabilization in mineral-associated organic matter-insights from modeling in phase space. Biogeosciences 2024, 21, 4077-98.
33. Mayes, M.; Marin-spiotta, E.; Szymanski, L.; Akif Erdoğan, M.; Ozdoğan, M.; Clayton, M. Soil type mediates effects of land use on soil carbon and nitrogen in the Konya Basin, Turkey. Geoderma 2014, 232-234, 517-27.
34. Sotomayor-Ramírez, D.; Cruz, L.; Pérez-Alegría, L. R. Soil organic matter stocks and spatial distribution in the Rio Grande de Arecibo watershed. J. Agric. Univ. P. R. 2010, 94-1. https://revistas.upr.edu/index.php/jaupr/article/view/2582 (accessed 2026-03-12).
35. Natural Resources Conservation Service. Caribbean Soils Division [Internet]. Washington (DC): U.S. Department of Agriculture, Natural Resources Conservation Service; 2023. https://www.nrcs.usda.gov/state-offices/caribbean-area/caribbean-soils-division (accessed 2026-03-12).
36. Wadsworth, F. H. A forestry assignment to puerto rico: forestry memoirs of frank wadsworth. Impresos Emanuelli. Inc., Aguas Buenas, Puerto Rico, USA. 2014. https://books.google.com/books/about/A_Forestry_Assignment_to_Puerto_Rico.html?id=VIFlrgEACAAJ (accessed 2026-03-12).
37. Franco, P. A.; Weaver, P. L.; Eggen-McIntosh, S. Forest resources of Puerto Rico, 1990. Resour. Bull. SRS-22. Asheville, NC: U.S. Department of Agriculture, Forest Service, Southern Research Station. 4.5 p. https://research.fs.usda.gov/treesearch/30327 (accessed 2026-03-12).
38. Gould, W. A.; Wadsworth, F. H.; Quiñones, M.; Fain, S. J.; Álvarez-berríos, N. L. Land use, conservation, forestry, and agriculture in Puerto Rico. Forests 2017, 8, 242.
39. Daly, C.; Helmer, E. H.; Quiñones, M. Mapping the climate of Puerto Rico, Vieques and Culebra. Int. J. Climatol. 2003, 23, 1359-81.
40. Lugo, A. E.; Brown, S. Management of tropical soils as sinks or sources of atmospheric carbon. Plant. Soil. 1993, 149, 27-41.
41. Muñoz, M. A.; Lugo, W. I.; Santiago, C.; Matos, M.; Ríos, S.; Lugo, J. Taxonomic classification of the soils of Puerto Rico, 2017. https://www.uprm.edu/tamuk/wp-content/uploads/sites/299/2019/06/Taxonomic_classification_soils_PR_2018_reduced.pdf (accessed 2026-03-12).
42. Beaudette, D. E.; Skovlin, J.; Roecker, S.; Brown, A. Package ‘soilDB’. https://cran.r-project.org/web/packages/soilDB/soilDB.pdf (accessed 2026-03-12).
43. Georgiou, K.; Jackson, R. B.; Vindušková, O.; et al. Global stocks and capacity of mineral-associated soil organic carbon. Nat. Commun. 2022, 13, 3797.
44. Yan, L.; Gao, D.; Wang, H.; Meng, S.; Lin, G.; Fu, J. Depth-dependent stabilization mechanisms of soil organic carbon and total nitrogen in different mixed modes of subtropical Moso bamboo forests. Front. Microbiol. 2025, 16, 1671811.
45. Sotomayor-Ramirez, D.; Espinoza, Y. Soil aggregation and organic carbon fractions in the Rio Grande de Arecibo watershed. J. Agric. Univ. PR. 2010, 94, 25-39.
46. Ripley, B.; Venables, W. N.; Ripley, B. D. Modern Applied Statistics with S, Fourth edition. Springer, New York. https://cran.r-project.org/web/packages/MASS/index.html (accessed 2026-03-12).
47. Liaw, A.; Wiener, M. Classification and regression by randomForest. R. News. 2002, 2, 18-22. https://journal.r-project.org/articles/RN-2002-022/RN-2002-022.pdf (accessed 2026-03-12).
48. Kuhn, M. Building predictive models in R using the caret package. J. Stat. Soft. 2008, 28, 1-26.
49. Köppen, W. Versuch einer Klassifikation der Klimate, vorzugsweise nach ihren Beziehungen zur Pflanzenwelt. (Schluss). Geographische. Zeitschrift. 1900, 6, 593-611. https://www.jstor.org/stable/27803939 (accessed 2026-03-12).
51. The R Project for Statistical Computing. https://www.R-project.org/ (accessed 2026-03-12).
52. Diaz-Vallejo, E. J. Land-use change influences microbial and carbon dynamics in soils of the tropics. Ph.D. Dissertation, The University of Wisconsin-Madison; 2023. https://www.proquest.com/openview/863cacc687ba5aa97e925d6a0ea7958e/1?pq-origsite=gscholar&cbl=18750&diss=y (accessed 2026-03-12).
53. Silver, W. L.; Lugo, A. E.; Farmer, D. Soil organic carbon in tropical forests of the United States of America. In The Potential of U.S. Forest Soils to Sequester Carbon and Mitigate the Greenhouse Effect, CRC Press. https://www.taylorfrancis.com/chapters/edit/10.1201/9781420032277-22/soil-organic-carbon-tropical-forests-united-states-america-whendee-silver-ariel-lugo-delphine-farmer (accessed 2026-03-12).
54. Conant, R. T.; Ryan, M. G.; Ågren, G. I.; et al. Temperature and soil organic matter decomposition rates-synthesis of current knowledge and a way forward. Glob. Chang. Biol. 2011, 17, 3392-404.
55. Georgiou, K.; Koven, C. D.; Wieder, W. R.; et al. Emergent temperature sensitivity of soil organic carbon driven by mineral associations. Nat. Geosci. 2024, 17, 205-12.
56. Sokol, N. W.; Foley, M. M.; Blazewicz, S. J.; et al. The path from root input to mineral-associated soil carbon is dictated by habitat-specific microbial traits and soil moisture. Soil. Biol. Biochem. 2024, 193, 109367.
57. Vaughan, E. The influence of human activities and soil properties on soil carbon dynamics in a diversity of soils. The University of Wisconsin-Madison; 2020. https://search.library.wisc.edu/digital/AFGVYK665LPOX686 (accessed 2026-03-12).
58. Pérez-Alegría, L. R. Atmospheric carbon sequestration in tropical watersheds. In World Congress of Computers in Agriculture and Natural Resources, Proceedings of the 2002 Conference 2002 (p. 306). American Society of Agricultural and Biological Engineers. https://elibrary.asabe.org/abstract.asp?aid=8345 (accessed 2026-03-12).
59. Cook-Patton, S. C.; Leavitt, S. M.; Gibbs, D.; et al. Mapping carbon accumulation potential from global natural forest regrowth. Nature 2020, 585, 545-50.
60. Huang, X.; Ibrahim, M. M.; Luo, Y.; Jiang, L.; Chen, J.; Hou, E. Land use change alters soil organic carbon: constrained global patterns and predictors. Earths. Future. 2024, 12, e2023EF004254.
61. Mosquera Pérez, E. A. Biogeoquímica de suelos en humedales palustrinos en Puerto Rico. https://hdl.handle.net/20.500.11801/3657 (accessed 2026-03-12).
62. Chéron-Bessou, C.; Beillouin, D.; Thoumazeau, A.; et al. A global database on land use and management change effects on soil KMnO4-oxidisable organic carbon (POXC). Sci. Data. 2025, 12, 1697.
63. De Moraes, J. F.; Volkoff, B.; Cerri, C. C.; Bernoux, M. Soil properties under Amazon forest and changes due to pasture installation in Rondônia, Brazil. Geoderma 1996, 70, 63-81.
64. Neill, C.; Melillo, J. M.; Steudler, P. A,.; et al. Soil carbon and nitrogen stocks following forest clearing for pasture in the southwestern Brazilian Amazon. Ecol. Appl. 1997, 7, 1216-25.
65. Beillouin, D.; Cardinael, R.; Berre, D.; et al. A global overview of studies about land management, land-use change, and climate change effects on soil organic carbon. Glob. Chang. Biol. 2022, 28, 1690-702.
66. Lugato, E.; Lavallee, J. M.; Haddix, M. L.; Panagos, P.; Cotrufo, M. F. Different climate sensitivity of particulate and mineral-associated soil organic matter. Nat. Geosci. 2021, 14, 295-300.
67. Mayer, M.; Prescott, C. E.; Abaker, W. E.; et al. Tamm Review: Influence of forest management activities on soil organic carbon stocks: a knowledge synthesis. For. Ecol. Manag. 2020, 466, 118127.
68. Guo, L. B.; Gifford, R. M. Soil carbon stocks and land use change: a meta analysis. Glob. Chang. Biol. 2002, 8, 345-60.
69. Brown, S.; Lugo, A. E. Effects of forest clearing and succession on the carbon and nitrogen content of soils in Puerto Rico and US Virgin Islands. Plant. Soil. 1990, 124, 53-64.
70. Rowley, M. C.; Nico, P. S.; Bone, S. E.; et al. Association between soil organic carbon and calcium in acidic grassland soils from Point Reyes National Seashore, CA. Biogeochemistry 2023, 165, 91-111.
71. Underwood, T. R.; Bourg, I. C.; Rosso, K. M. Mineral-associated organic matter is heterogeneous and structured by hydrophobic, charged, and polar interactions. Proc. Natl. Acad. Sci. U. S. A. 2024, 121, e2413216121.
72. Georgiou, K.; Angers, D.; Champiny, R. E.; et al. Soil carbon saturation: what do we really know? Glob. Chang. Biol. 2025, 31, e70197.
73. Lugo‐lópez, M. A.; Bonnet, J. A.; Hernández‐medina, E.; Landrau, P.; Samuels, G. Soil organic matter levels and crop yields in Puerto Rico. Soil. Sci. Soc. Am. J. 1954, 18, 489-93.
74. Shamrikova, E. V.; Vanchikova, E. V.; Kyzyurova, E. V.; Zhangurov, E. V. Methods for measuring organic carbon content in carbonate-containing soils: a review. Eurasian. Soil. Sc. 2024, 57, 380-94.
75. Meng, X.; Meng, F.; Chen, P.; Hou, D.; Zheng, E.; Xu, T. A meta-analysis of conservation tillage management effects on soil organic carbon sequestration and soil greenhouse gas flux. Sci. Total. Environ. 2024, 954, 176315.
76. Dlamini, P.; Chivenge, P.; Chaplot, V. Overgrazing decreases soil organic carbon stocks the most under dry climates and low soil pH: a meta-analysis shows. Agric. Ecosyst. Environ. 2016, 221, 258-69.
77. Mcgroddy, M.; Silver, W. L. Variations in belowground carbon storage and soil CO2 flux rates along a wet tropical climate gradient1. Biotropica 2006, 32, 614-24.
Cite This Article
How to Cite
Download Citation
Export Citation File:
Type of Import
Tips on Downloading Citation
Citation Manager File Format
Type of Import
Direct Import: When the Direct Import option is selected (the default state), a dialogue box will give you the option to Save or Open the downloaded citation data. Choosing Open will either launch your citation manager or give you a choice of applications with which to use the metadata. The Save option saves the file locally for later use.
Indirect Import: When the Indirect Import option is selected, the metadata is displayed and may be copied and pasted as needed.
About This Article
Special Topic
Copyright

Data & Comments
Data
0


Comments
Comments must be written in English. Spam, offensive content, impersonation, and private information will not be permitted. If any comment is reported and identified as inappropriate content by OAE staff, the comment will be removed without notice. If you have any queries or need any help, please contact us at support@oaepublish.com.