


Multi-task neural network enhanced by data augmentation and ROI optimization for prognosis and MVI prediction in HCC using contrast-enhanced CT
 0
0 Abstract
Aim: Microvascular invasion (MVI) and recurrence significantly impact hepatocellular carcinoma (HCC) prognosis. This study aims to develop a multi-task deep learning (DL) model using contrast-enhanced computed tomography (CT) to predict preoperative MVI, recurrence-free survival (RFS), and overall survival (OS).
Methods: Preoperative CT scans from 308 patients across five institutions were collected for training and internal validation. A multi-task 3D neural network was trained using a novel augmentation strategy. An independent external cohort (n = 80) from Institution VI was used to rigorously assess generalizability. Model performance was assessed using the concordance index (C-index) for RFS/OS and the F1-score for MVI.
Results: In the training cohort (n = 192), the model achieved an MVI F1 score of 0.739, and C-indices of 0.965 (OS) and 0.869 (RFS). In the internal validation cohort (n = 116), the corresponding values were 0.716, 0.831, and 0.741, respectively. Notably, in the independent external cohort, the model maintained robust performance, with an OS C-index of 0.767, RFS C-index of 0.733, and MVI F1 score of 0.708. Class activation maps confirmed that the model focused on clinically relevant liver regions.
Conclusion: Our interpretable multi-task DL model demonstrates robust predictive capabilities for RFS, OS, and MVI in HCC patients across multiple centers, offering a non-invasive tool to enhance clinical decision-making.
Keywords
INTRODUCTION
Hepatocellular carcinoma (HCC) is among the most prevalent malignancies globally, particularly in Asia and Africa, where the prevalence of hepatitis B and C leads to significantly higher incidence rates compared to other regions[1]. HCC ranks as the third leading cause of cancer-related mortality worldwide[2], following lung and stomach cancers. While surgical resection remains the preferred treatment option, other modalities such as liver transplantation, local ablation, and transarterial chemoembolization offer therapeutic benefits but are constrained by factors such as donor availability, tumor size, and anatomical location[3]. Several studies have shown that recurrence is a common manifestation of surgical treatment failure in HCC, with microvascular invasion (MVI) being a major contributing factor[4,5]. Preoperative prediction of recurrence is essential for improving overall survival (OS) and tailoring treatment strategies. As a result, the accurate preoperative prediction of MVI and postoperative recurrence has become a central focus of current research in HCC management.
Currently, common approaches for predicting HCC prognosis and MVI rely on genetic data, blood biomarkers, and other clinical variables[6,7]. However, imaging data has been increasingly favored for its non-invasive nature, high standardization, and rich information density[8]. Imaging offers direct insights into tumor morphology, size, and blood flow - factors that are crucial for prognosis and have been extensively validated in clinical practice[9]. While genetic data and biomarkers show predictive potential[10,11], they often struggle to capture local tumor characteristics and dynamic changes due to limited sample sizes and testing constraints. Moreover, these results can be influenced by experimental conditions and sampling times, and factors such as high costs, small sample sizes, and complex processing limit their broader clinical application[12]. In contrast, imaging provides detailed structural and functional information, making it highly suitable for machine learning models[13]. Deep learning (DL), in particular, excels at processing complex, high-dimensional data such as three-dimensional (3D) computed tomography (CT) and magnetic resonance imaging (MRI) scans[14]. With the availability of large medical datasets and advances in computational power, DL has demonstrated significant advantages in medical imaging analysis, especially in automating feature extraction and pattern recognition. Unlike traditional algorithms, DL models can autonomously learn latent features from imaging data without manual annotation, making them ideal for tasks involving high-dimensional inputs[15]. Recent studies have also shown that DL models outperform conventional methods in cancer imaging diagnostics, particularly in lung cancer[16].
Although several HCC prognosis models based on imaging data exist, they are typically limited to single-task predictions, such as estimating survival rates or recurrence risk. These studies often face challenges such as small sample sizes, single-source data, and limited generalizability. Moreover, traditional imaging metrics used in these models fail to capture the 3D contextual information present in imaging data, overlooking the dynamic nature of HCC’s multi-stage development. As a result, these models underutilize the potential of DL in capturing the complex features of tumors and their microenvironments[17]. A recent study by Wang et al. demonstrated the feasibility of using multi-task DL with MRI images to predict both MVI and recurrence-free survival (RFS) in HCC[18]. However, the study’s use of a Transformer architecture introduces complexity, requiring large datasets - potentially millions of samples - to optimize model parameters and architecture. Furthermore, the performance of such models is highly sensitive to fine-tuning[19,20]. The scarcity of data in the medical field limits the broader application of these architectures. Therefore, designing strategies to augment the effective sample sizes during model training is essential for improving performance and generalizability.
To address these challenges, our study leverages multi-center data to develop an end-to-end, multi-task neural network model based on three-phase contrast-enhanced CT imaging in patients with HCC. This model is designed to provide robust predictions of survival time, recurrence risk, and MVI status. By integrating a multi-task learning framework, a novel sample size augmentation strategy, and multi-center data, we aim to enhance the model’s predictive accuracy and generalizability, ultimately improving its stability across different clinical settings.
METHODS
Patient cohorts
Given the retrospective design and the removal of personally identifiable information, the requirement for written informed consent was waived. The study protocol was approved by the Medical Ethics Committee of the First Affiliated Hospital of the Air Force Medical University (Approval No. KY20232280-X-1) and by the institutional review boards of all participating centers. Data were collected from five independent medical centers (Institutions I-VI). Institution I provided the training cohort, while Institutions II-V contributed to the internal validation cohort. Institution VI provided the external test cohort, which was used to evaluate the model’s generalizability in a setting independent of the model development centers. Eligible patients were identified through systematic screening of the electronic medical records and picture archiving and communication system (PACS) databases at each institution. The recruitment period for the training, internal validation, and external test cohorts (Institutions I-VI) spanned from January 2017 to December 2022. After applying the inclusion and exclusion criteria, 308 patients from Institutions I-V were included in the primary analysis (Training: n = 192; Internal Validation: n = 116), yielding 1,164 annotated contrast-enhanced CT sequences. Subsequently, 80 patients from Institution VI who met the same criteria were included as the independent external test cohort. The baseline characteristics of the included patients are summarized in Supplementary Table 1.
Inclusion criteria:
1. Histologically confirmed primary HCC.
2. Patients who underwent R0 liver resection.
3. Patients who had not received any other treatments before surgery.
4. Complete preoperative contrast-enhanced CT scans within one week before surgery.
Exclusion criteria:
1. Pediatric patients (age < 18 years).
2. Participants with clinical evidence of HCC rupture.
3. Patients with incomplete or missing follow-up data.
The inclusion criteria mandated that all patients undergo a curative-intent liver resection with negative margins (R0). In accordance with international guidelines [e.g., American Association for the Study of Liver Diseases (AASLD) and the European Association for the Study of the Liver (EASL)], R0 resection was defined as complete macroscopic removal of all detectable tumor lesions with histologically confirmed negative margins (margin ≥ 1 mm), ensuring that no residual malignancy remained in the liver remnant. All procedures were performed by senior hepatobiliary surgeons with over 15 years of experience to minimize operative bias.
Follow-up and definition of primary outcomes
Patient monitoring concluded in September 2024. The post-resection surveillance schedule involved quarterly visits for the initial two years, transitioning to biannual assessments thereafter. This protocol was strictly implemented across primary and external validation cohorts. The entire study population had a median follow-up duration of 922 days [interquartile range (IQR): 611-1,766 days]. Regarding clinical outcomes, OS was defined as the interval between the date of surgery and death from any cause. RFS was defined as the period from surgery to the first documented relapse or death. MVI was histologically confirmed by the detection of tumor emboli within vascular spaces using a systematic 7-point sampling technique to ensure extensive tissue coverage.
Imaging data
All patients underwent triphasic contrast-enhanced CT scans. A nonionic iodinated contrast agent, such as iopromide or iohexol, was administered at a dose of 1.5 mL/kg body weight and injected intravenously at a rate of 3-4 mL/s using a power injector. Scans were performed on 64- or 128-slice spiral CT scanners, with parameters set as follows: tube voltage of 120 kVp, automatic tube current modulation, a slice thickness of 5 mm, and a reconstructed slice thickness of 1 mm.
Arterial phase: Scans were obtained 25-30 s after contrast injection, with the patient holding their breath.
Portal venous phase: Following the arterial phase, normal breathing was resumed, and scans were obtained 60-70 s after contrast injection.
Delayed phase: Scans were conducted 180 s after contrast injection.
Imaging annotation and preprocessing
CT annotations were performed by two senior radiologists, who annotated each patient’s liver and tumor regions. After completion, the initial annotations were reviewed by a third annotator, and any discrepancies were resolved through discussion among the annotators. The annotated regions included both the liver and the tumor. All CT images were resampled using the SimpleITK library in Python to achieve a consistent voxel size of 1 mm × 1 mm × 1 mm. Additionally, a 4 mm tumor margin zone was created by expanding the area surrounding the tumor by 2 mm. The annotated data were then saved in NIfTI (.nii.gz) format for further analysis.
To reduce noise generated during CT scanning process, which could impact results, the imaging data were cropped to exclude values below the 2.5th percentile and above the 97.5th percentile. The remaining data were normalized using min-max scaling to the range [0, 1], ensuring consistency across centers and accelerating model convergence.
To assess the reproducibility of manual segmentation, a random subset of 30 patients from the training cohort was selected. Intra-observer reliability was assessed by having the primary radiologist re-annotate these cases after one week. Inter-observer reliability was evaluated by a second senior radiologist blinded to the original annotations. The spatial overlap was quantified using the Dice Similarity Coefficient (DSC).
Neural network structure
The neural network was developed using PyTorch, with DenseNet selected as the base architecture due to its dense connectivity, making it well-suited for analyzing complex, high-dimensional data such as CT scans. Unlike traditional statistical models that rely on discrete, predefined variables (e.g., tumor diameter, alpha-fetoprotein levels), the direct input for our neural network consists of 3D voxel-intensity arrays from preprocessed triphasic CT images. We modified the network by integrating three 3D convolutional layers corresponding to background liver tissue, tumor margins, and the tumor itself. These layers were fused to capture liver-specific characteristics while enhancing features of the tumor and its margins, an approach termed the region-of-interest enhancement strategy. The overall network architecture consisted of three base networks, each corresponding to one of the arterial, portal venous, and delayed phases of the CT scan [Figure 1].
Figure 1. Architecture of the proposed multi-task neural network. The model utilizes a DenseNet backbone with shared parameters to extract features from triphasic CT images (arterial, portal venous, and delayed). The network branches into three task-specific outputs: a classification head for MVI prediction and two survival heads for OS and RFS estimation. CT: Computed tomography; 3D Conv: three-dimensional convolution; BatchNorm: batch normalization; ELU: exponential linear unit; MaxPool: max pooling; MVI: microvascular invasion; OS: overall survival; RFS: recurrence-free survival.
Given the potential associations among survival, recurrence, and MVI in HCC patients, the model was designed as a multi-task network to allow parameter sharing across these tasks. At the end of the network, two linear layers were used to provide individual predictions of survival and recurrence risk, while a third linear layer with two outputs was used to predict MVI.
Multi-task learning optimization and evaluation metrics
To concurrently predict MVI status and survival outcomes (OS and RFS), we formulated the objective as a joint optimization problem. The global loss function is defined as a dynamic weighted combination of task-specific losses:
where
To address gradient imbalance and varying convergence scales among clinical tasks, we implemented a Dynamic Weight Averaging (DWA) strategy. Instead of treating loss weights as static hyperparameters, the weighting coefficients
The final weights are calculated using a temperature-scaled Softmax operator to ensure optimization stability:
Where K = 3 represents the number of tasks, and the temperature T was set to 2.0 to smooth the weighting distribution. This mechanism encourages the model to prioritize tasks with slower convergence rates, ensuring robust feature representation across all clinical endpoints.
For the quantitative assessment of prognostic performance, Harrell’s concordance index (C-index) was used to measure the discriminative capacity of the survival branches. The C-index is defined as the probability that the predicted risk scores η are concordant with the observed survival times T for any permissible pair of patients (i, j):
where
For the MVI classification task, performance was assessed using accuracy and the F1-score. The F1-score provides a robust metric for imbalanced datasets by calculating the harmonic mean of precision and recall:
where TP (True Positives), FP (False Positives), and FN (False Negatives) are derived from the confusion matrix. Precision is defined as TP/(TP + FP), and recall (Sensitivity) is defined as TP/(TP + FN).
DL model training
Given the scarcity of imaging data, several strategies were employed to enhance the dataset:
1. Arbitrary 3D rotations were applied along the image axes.
2. Random jittering of ± 3 days was introduced to the time variables for OS and RFS.
To mitigate the risk of overfitting and ensure generalizability in the high-dimensional feature space, we implemented a multifaceted regularization strategy. Specifically, dropout layers were embedded within the fully connected blocks to prevent co-adaptation of neurons, and weight decay (L2 regularization) was applied to constrain the model complexity. Furthermore, an early stopping mechanism was utilized to terminate training when the validation loss no longer decreased for 20 consecutive epochs, thereby preventing the model from memorizing noise in the training data.
Each sample underwent three rounds of augmentation, effectively tripling the training dataset. Model performance was monitored using the C-index for survival-related tasks and accuracy for classification tasks. PyTorch-Lightning was utilized to streamline the training process, and a combined loss function was applied to monitor overall training progress. This fusion loss consisted of two negative partial log-likelihood components and one cross-entropy loss, corresponding to the survival, recurrence, and MVI tasks, respectively. The weights for these three losses were automatically learned and adjusted during training.
Due to the specific challenges in survival analysis, where the number of positive events can influence C-index calculations, the Moment model from the TorchSurv package was employed to mitigate this effect. Additionally, we modified TorchSurv to support multi-task learning, with the source code available in the project repository, as detailed in the data availability section.
Model performance evaluation
After model training, OS and RFS curves were plotted for both the training and validation cohorts, alongside calibration curves for each task. For the survival and recurrence tasks, we also performed decision curve analysis (DCA) and receiver operating characteristic (ROC) curve analyses, while calculating the C-index. The C-index was computed using the scikit-survival package from PIP (PyPI), while DCA and ROC curves were plotted using the dcurves and survivalROC packages from Comprehensive R Archive Network (CRAN).
Statistical methods
In this study, OS and RFS were evaluated using Kaplan-Meier survival curves, and the log-rank test was applied to compare survival differences between groups. Model performance was assessed using the C-index and accuracy, which measure the predictive capability of survival models and classification tasks, respectively. The C-index, calculated using the TorchSurv package, was used to evaluate the accuracy of survival time ranking, while accuracy was computed as follows:
The combined loss function consisted of two negative partial log-likelihood losses and one cross-entropy loss, corresponding to survival, recurrence, and MVI, respectively. Calibration curves were used to evaluate the reliability of predicted probabilities, while DCA and ROC curves were employed to assess the clinical utility of the model across different decision thresholds.
For comparisons of categorical variables, either the chi-square test or Fisher’s exact test was applied, as appropriate. For continuous variables, the t-test or Mann-Whitney U test was used, depending on the data distribution. All data preprocessing and model training were performed using the PyTorch framework to ensure data consistency and training efficiency, with random 3D rotations used to augment the dataset. Unless otherwise specified, a P-value of less than 0.05 was considered statistically significant.
RESULTS
Patient cohorts and CT annotations
From January 2017 to December 2022, a total of 2,801 patients across five centers were screened in this study. After applying the inclusion and exclusion criteria, 388 patients were included in the final analysis. In total, 1,164 contrast-enhanced CT sequences were annotated. The baseline characteristics of the study population are summarized in Supplementary Table 1.
Inter- and intra-observer variability
Quantitative analysis revealed high reproducibility in manual segmentation. The mean DSC for intra-observer variability were 0.954 (arterial), 0.953 (venous), and 0.947 (delayed). For inter-observer variability, the mean DSCs were 0.928, 0.930, and 0.921, respectively. With all DSC values exceeding 0.90, the variation in model input attributable to human annotation was deemed negligible [Supplementary Table 2].
Model training
Using PyTorch-Lightning, we trained the DL model for 80 epochs. The loss and performance curves for each task, including MVI prediction accuracy and the C-index for OS and RFS, are shown in Figure 2. The results indicated that the lowest validation loss and peak performance metrics were achieved around epoch 50, after which overfitting began to affect validation performance. Thus, the model at epoch 50 was selected as the final model.
Figure 2. Training trajectory and convergence of the proposed model. The final model parameters were fixed at epoch 50 based on optimal validation performance, though the full 80-epoch course is shown to transparently demonstrate the onset of overfitting. (A and B) Prediction accuracy for MVI across the training and validation sets; (C-F) Evolution of the C-index for both OS and RFS throughout the learning process; (G-N) depicts the task-specific loss curves for MVI, OS, and RFS, as well as the total loss, showing the decreasing error rates in both cohorts. MVI: Microvascular invasion; OS: overall survival; RFS: recurrence-free survival; C-index: concordance index.
Model prediction of OS, RFS, and MVI
The final model achieved an MVI prediction F1 score of 0.739 (sensitivity: 75.9%, specificity: 88.4%, Supplementary Table 3A), an OS C-index of 0.965 [95% confidence interval (CI): 0.945-0.981], and an RFS C-index of 0.869 (95%CI: 0.825-0.910) in the training cohort. In the validation cohort, these metrics were 0.716 (Sensitivity: 95.1%, Specificity: 61.3%), 0.831 (95%CI: 0.702-0.923), and 0.741 (95%CI: 0.650-0.819), respectively [Figure 2].
The Kaplan-Meier curves based on the model’s risk scores also demonstrated good predictive ability [Figure 3]. Stratification analysis showed significantly poorer outcomes among the patients in the high-risk group. The Hazard Ratio (HR) for OS was 4.221 (95%CI: 2.943-6.056, P < 0.001) in the training cohort, 2.378 (95%CI: 1.470-3.847, P < 0.001) in the validation cohort, and 2.044 (95%CI: 1.205-3.466, P = 0.008) in the external cohort [Supplementary Table 3B]. When applied to unseen data from Institution VI, the model exhibited robust generalizability without the need for retraining or fine-tuning. The model achieved an F1 score of 0.708 for MVI prediction (sensitivity: 100.0%, specificity: 66.7%, Supplementary Table 3A). The C-indices for OS and RFS were 0.767 (95%CI: 0.599-0.907) and 0.733 (95%CI: 0.628-0.826), respectively [Supplementary Table 4].
Figure 3. Kaplan-Meier survival analysis stratified by model-predicted risk. Patients were categorized into high- and low-risk groups to compare outcomes. The (A-C) and (D-F) display the survival curves for OS and RFS, respectively. These comparisons encompass the training, internal validation, and external validation cohorts. Note: Analysis was truncated at 5 years (60 months) to emphasize the clinically significant window for HCC prognosis, despite raw follow-up data extending to 2,934 days. OS: Overall survival; RFS: recurrence-free survival; HCC: hepatocellular carcinoma.
ROC curves for OS and RFS at 1 and 2 years in both the training and validation cohorts demonstrated promising predictive power. For OS, the 1-year Area Under the Curve (AUCs) were 0.987 in the training cohort and 0.929 in the validation cohort, whereas the 2-year AUCs were 0.980 and 0.780, respectively [Figure 4A and B]. Similarly, the 1-year AUCs for RFS were 0.896 in the training cohort and 0.750 in the validation cohort, while the 2-year AUCs were 0.863 and 0.696, respectively [Figure 4C and D]. DCA further demonstrated that the model provided substantial net clinical benefit [Figure 4E-H]. In the external cohort, the 1-year AUCs for OS and RFS were 0.865 and 0.832 [Figure 4I-L]. Calibration curves for OS, RFS, and MVI [Figure 5] further supported the reliability of the model’s predictions, with predicted probabilities closely aligning with actual outcomes.
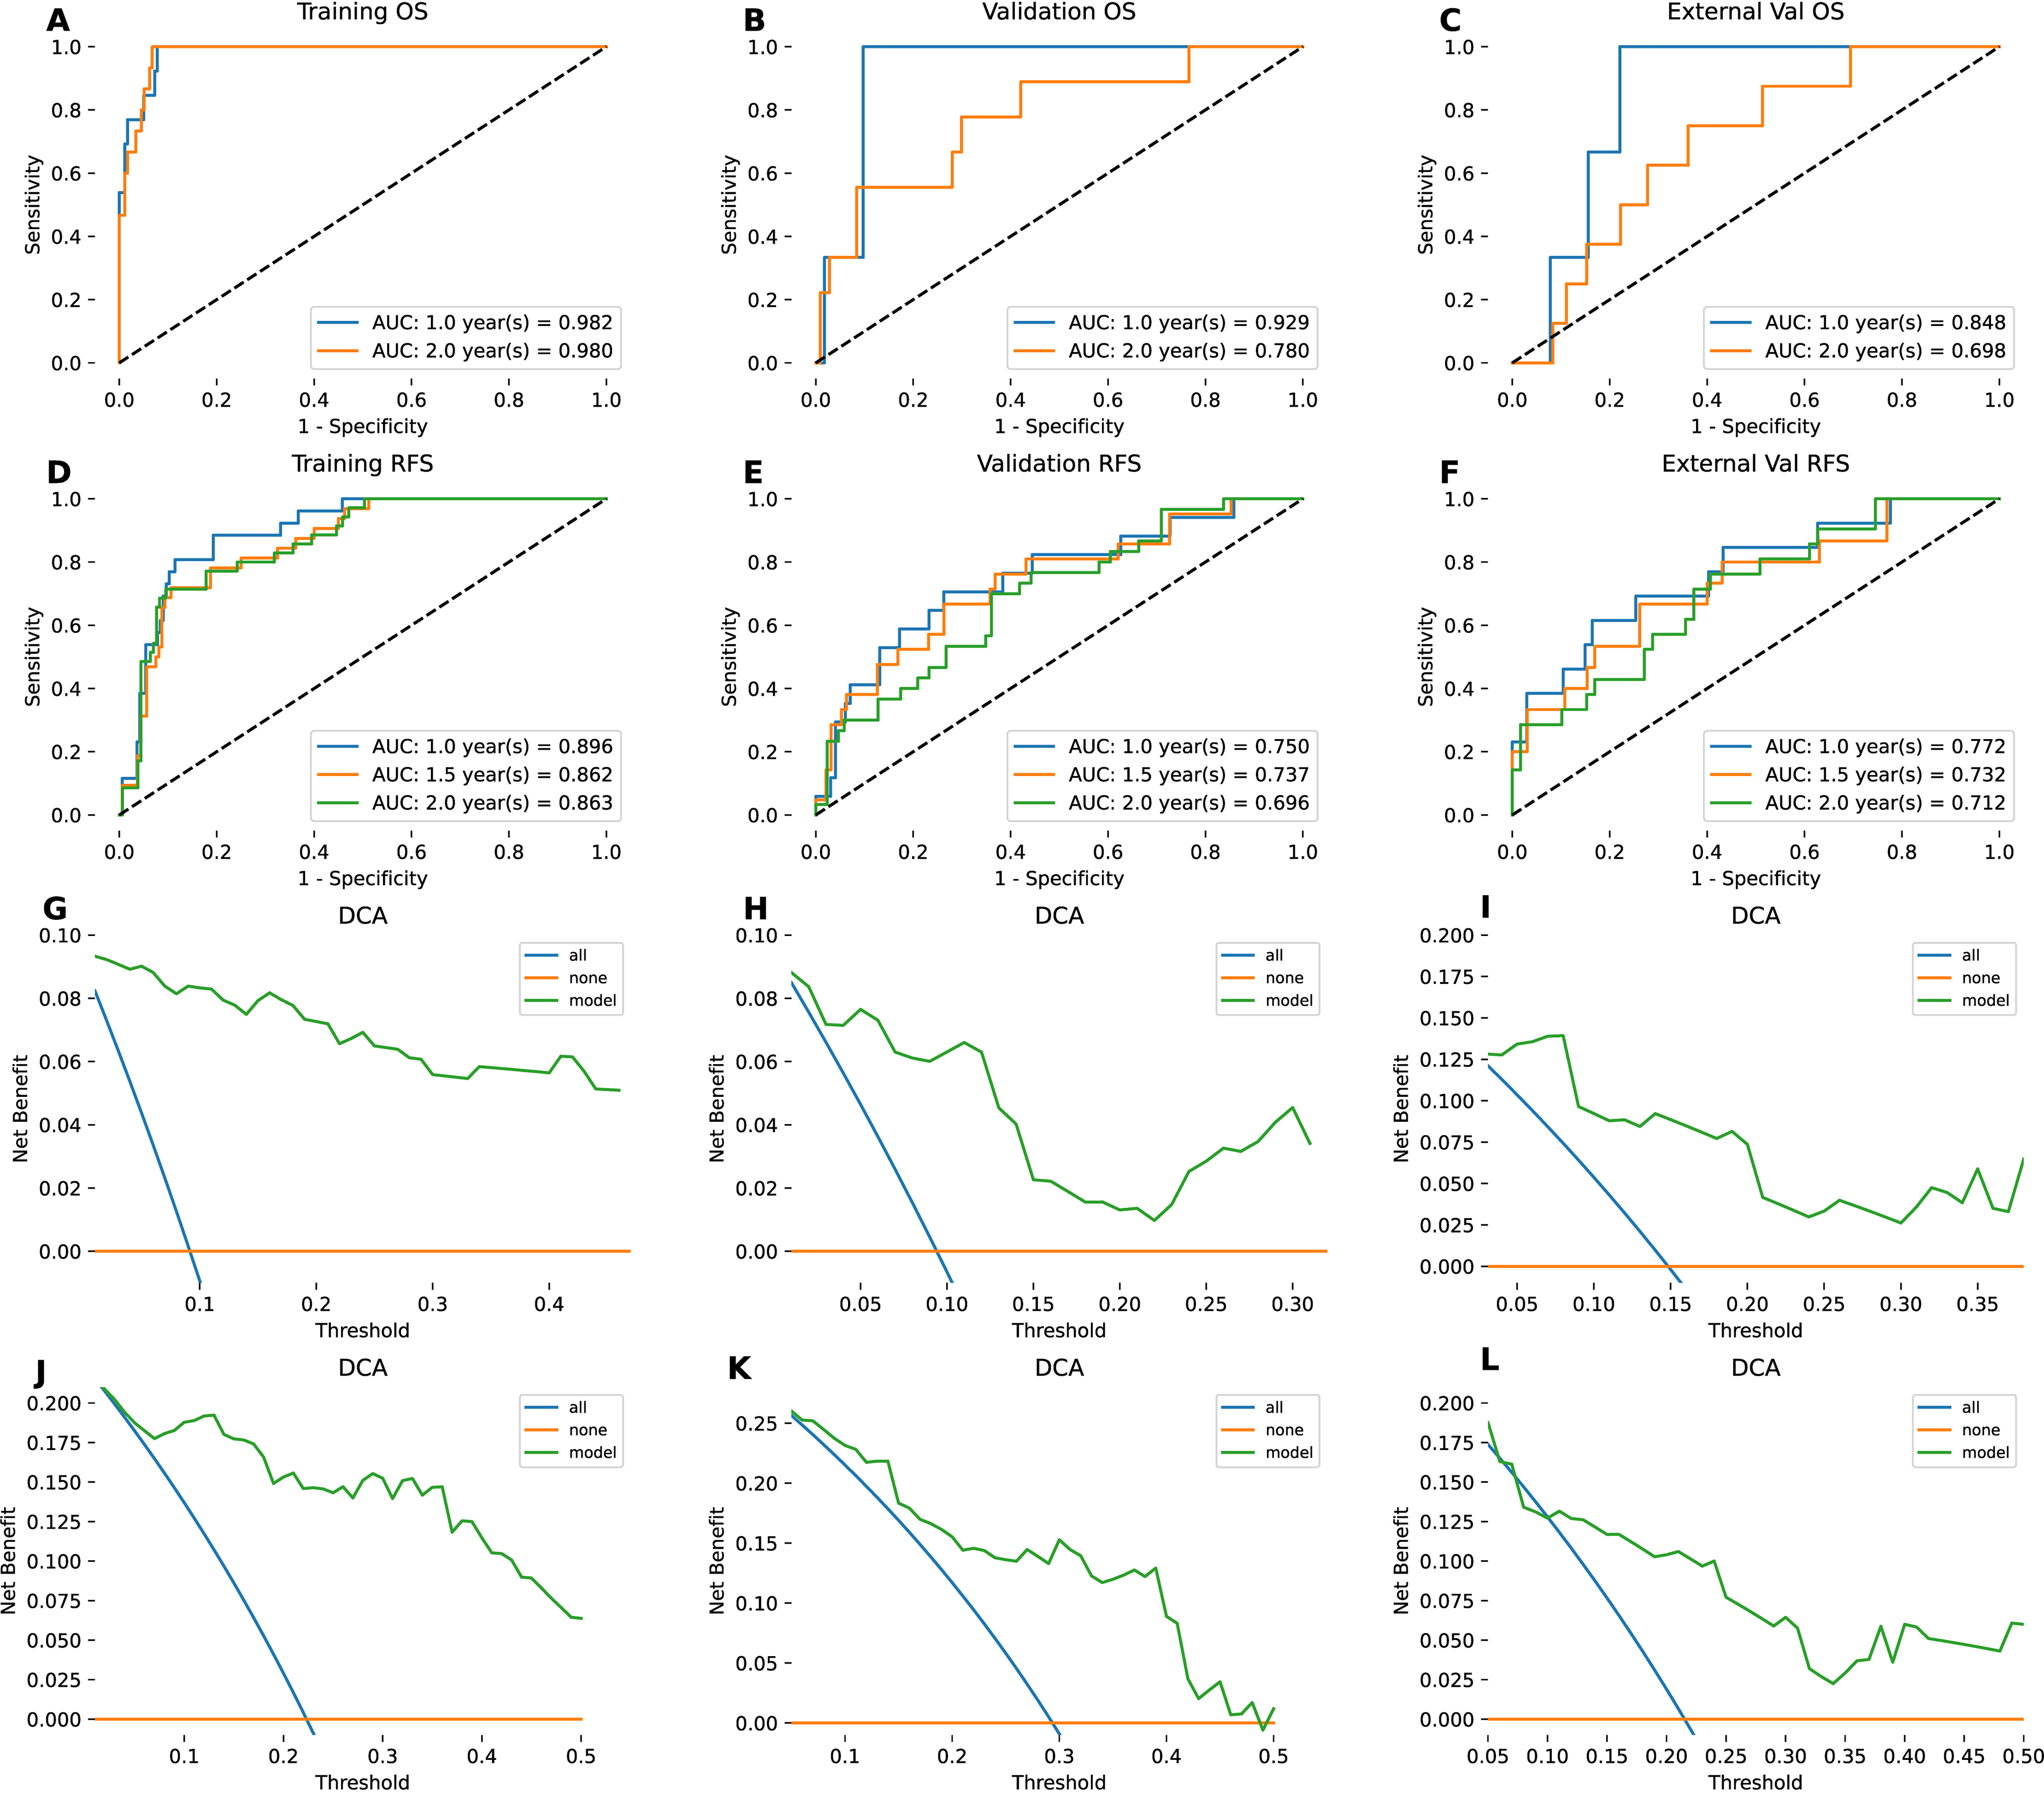
Figure 4. Assessment of discriminatory power and clinical utility. (A-F) ROC curves and corresponding AUC values, evaluating the model’s performance for OS and RFS across all three study cohorts (training, validation, and external); (G-L) DCA, highlighting the net clinical benefit for OS and RFS prediction in the respective datasets. Note: The 1.5-year metrics in A-C correspond to the 2-year metrics. To enhance visual clarity, data points for the 1.5-year survival rate have been excluded. ROC: Receiver operating characteristic; AUC: area under the curve; DCA: decision curve analysis; OS: overall survival; RFS: recurrence-free survival.
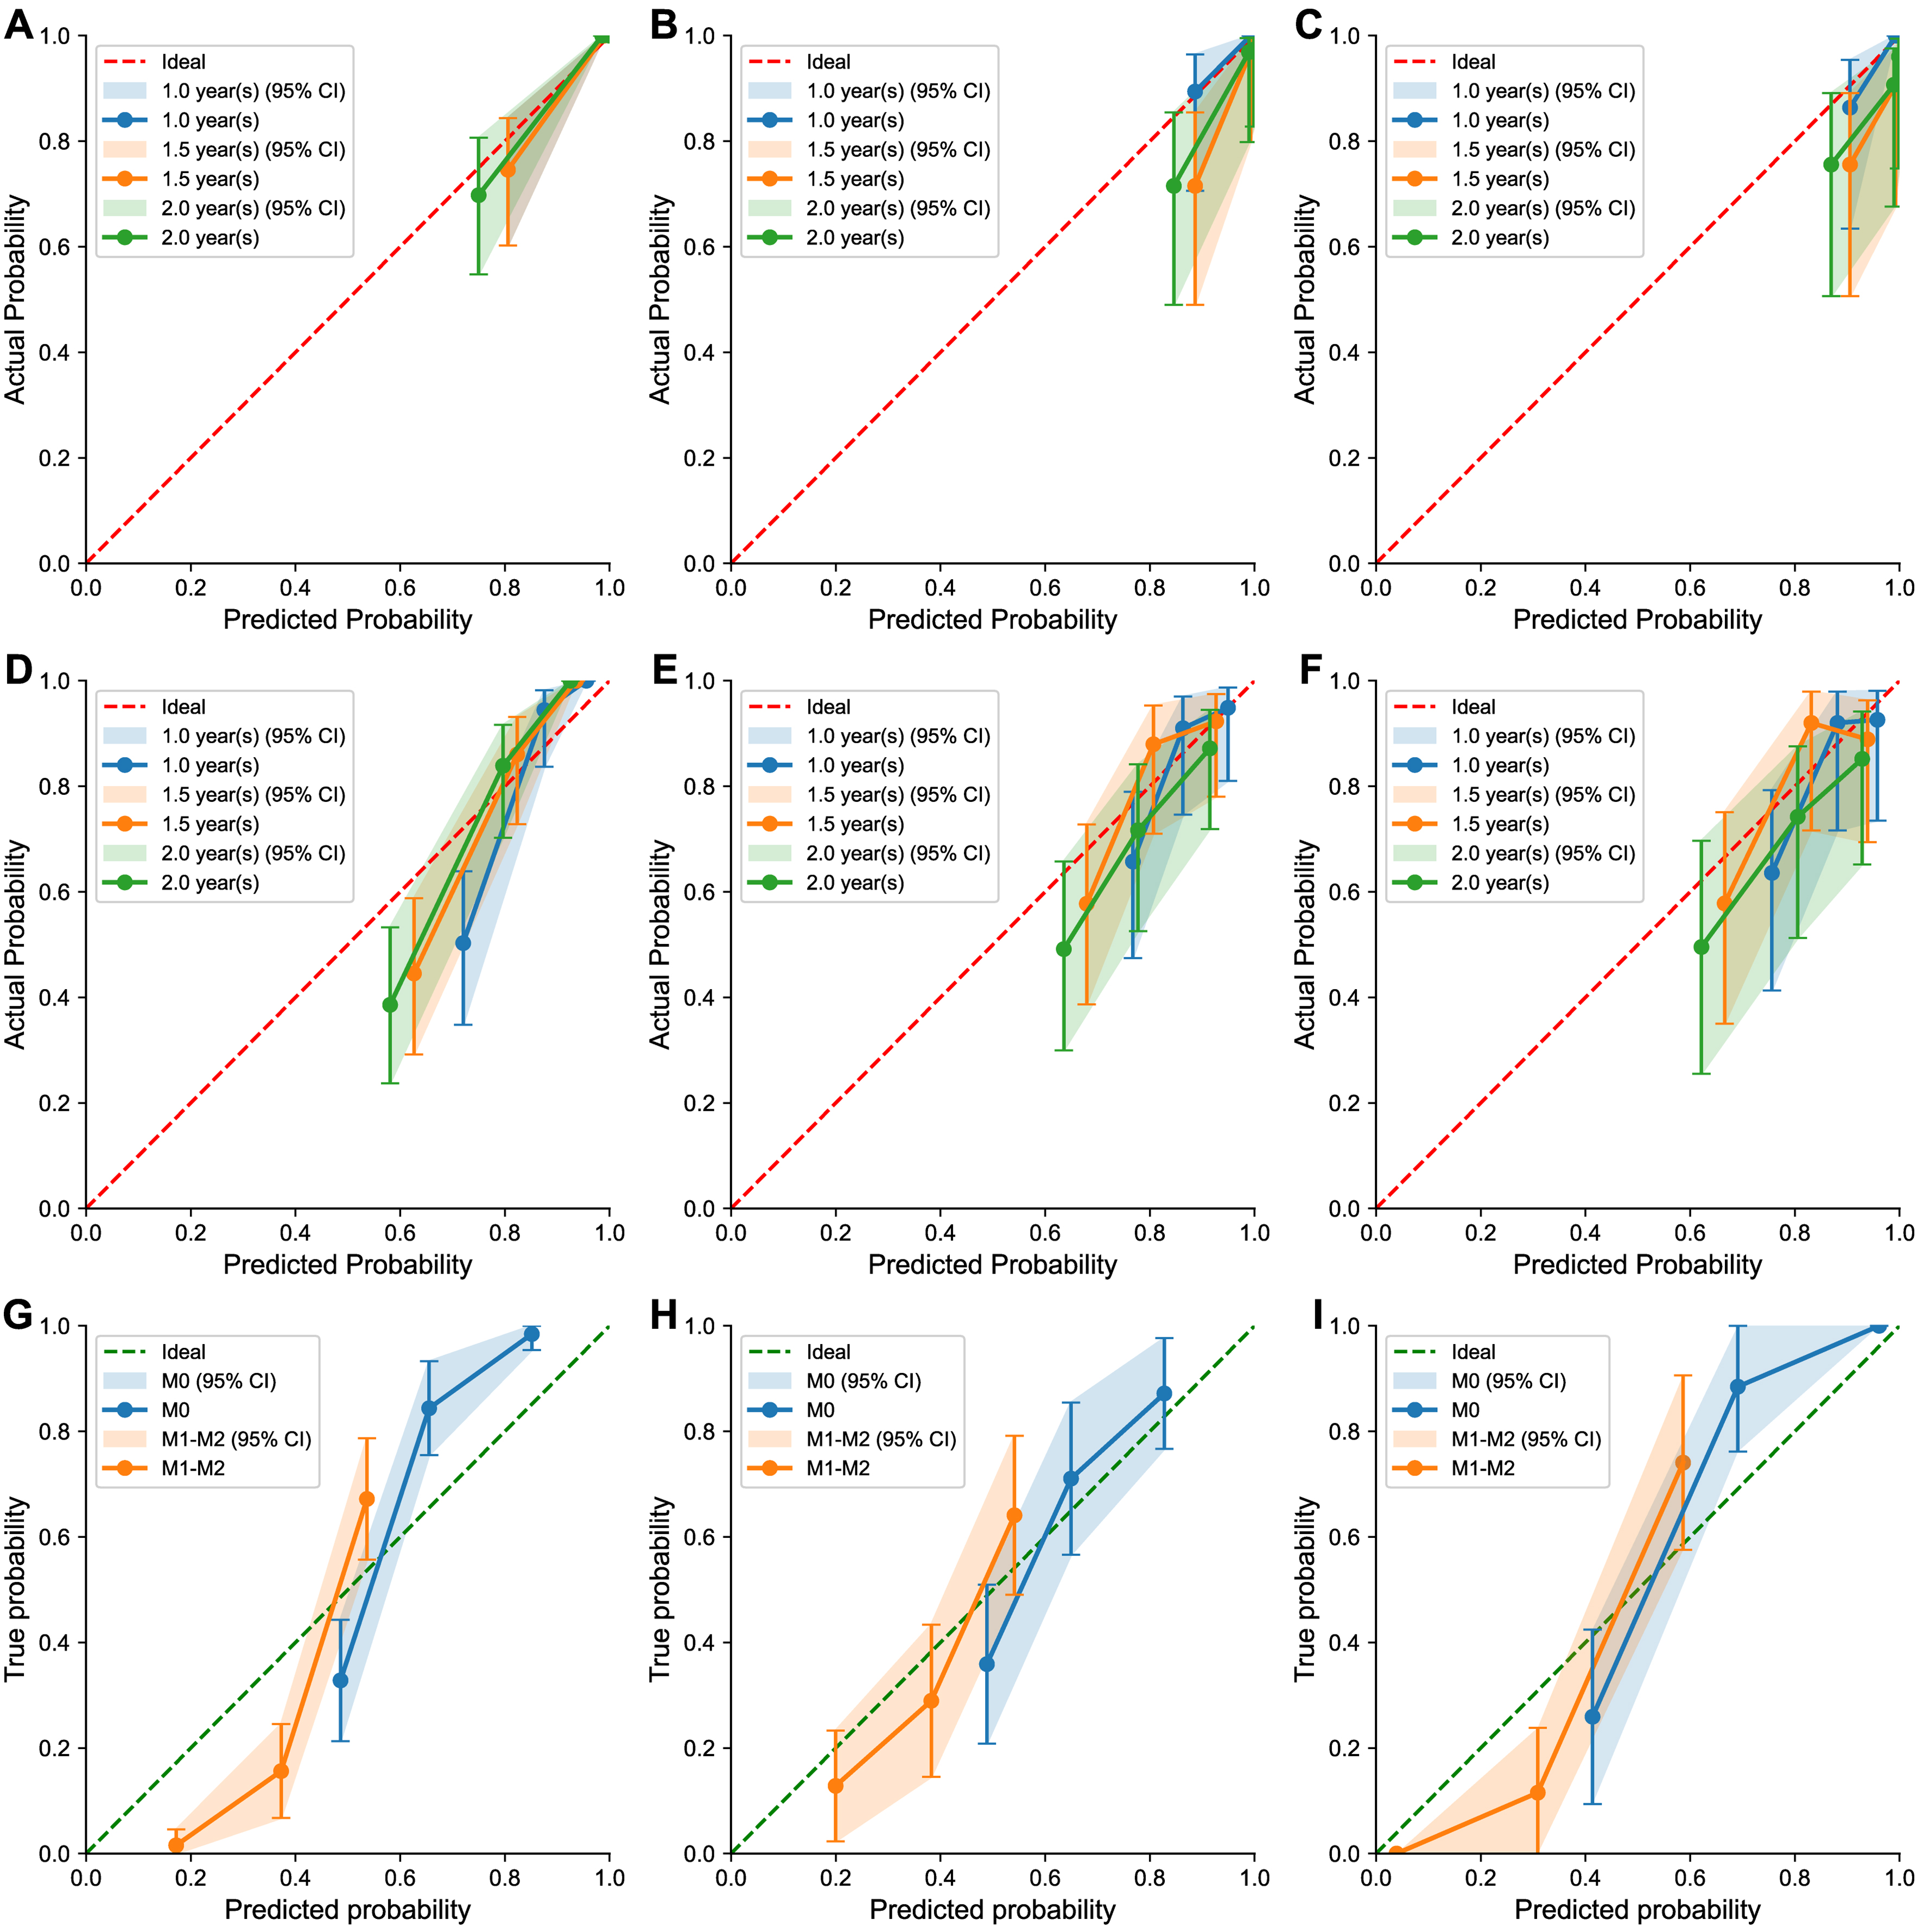
Figure 5. Goodness-of-fit assessment via calibration plots. These diagrams demonstrate the agreement between the model’s predicted probabilities and the observed clinical outcomes. The panels are organized by metric: (A-C) for overall survival, (D-F) for recurrence-free survival, and (G-I) for the prediction of MVI status. Each metric is evaluated across the training, internal validation, and external validation cohorts. OS: Overall survival; RFS: recurrence-free survival; MVI: microvascular invasion; CI: confidence interval; M0: no microvascular invasion; M1-M2: presence of microvascular invasion.
To further validate the incremental value of our DL approach, we compared its prognostic performance against standard clinical staging systems [including Barcelona Clinic Liver Cancer (BCLC) and Tumor Node Metastasis (TNM) classifications] and univariate clinical markers [e.g., Alpha-Fetoprotein (AFP), tumor size]. As detailed in Supplementary Table 4, traditional clinical variables demonstrated limited predictive power in all cohorts. In the validation cohort, the C-indices for BCLC and TNM staging ranged from 0.529 to 0.547 for predicting OS and RFS, which were significantly lower than those of our DL model. Although “Max Tumor Size” achieved a univariate C-index of 0.687 for OS in the validation cohort, it failed to maintain consistency in the external test cohort (C-index 0.535). In contrast, our multi-task DL model consistently outperformed these conventional clinical benchmarks across all cohorts, highlighting its superior ability to capture sub-visual prognostic heterogeneity.
Ablation study and quantitative interpretation
To validate the contribution of each model component, we conducted an ablation study [Supplementary Table 3C]. The results demonstrated that the full model, which integrated 3D structure, time jittering, and all three CT phases, achieved the best performance. Specifically, removing the venous phase resulted in the most significant performance drop (OS C-index decrease of 0.116), highlighting the critical prognostic value of this phase.
Furthermore, quantitative analysis of the class activation maps (CAMs) confirmed the model’s specific focus. As shown in Supplementary Table 3D, the activation ‘energy’ and ‘hit rate’ were significantly higher in the intra-tumoral and peritumoral regions. Approximately 88% of the model’s attention was concentrated on the tumor and its immediate microenvironment (1 cm margin), providing objective evidence that the model learns pathologically meaningful patterns rather than background noise.
CAMs reveal liver focus
CAMs generated from the model demonstrated that the network primarily focused on the liver region in both the training and validation cohorts, consistent with clinical observations [Figure 6]. The CAMs suggest that the model accurately identifies liver tissue and tumor-related features, contributing to its strong predictive performance.
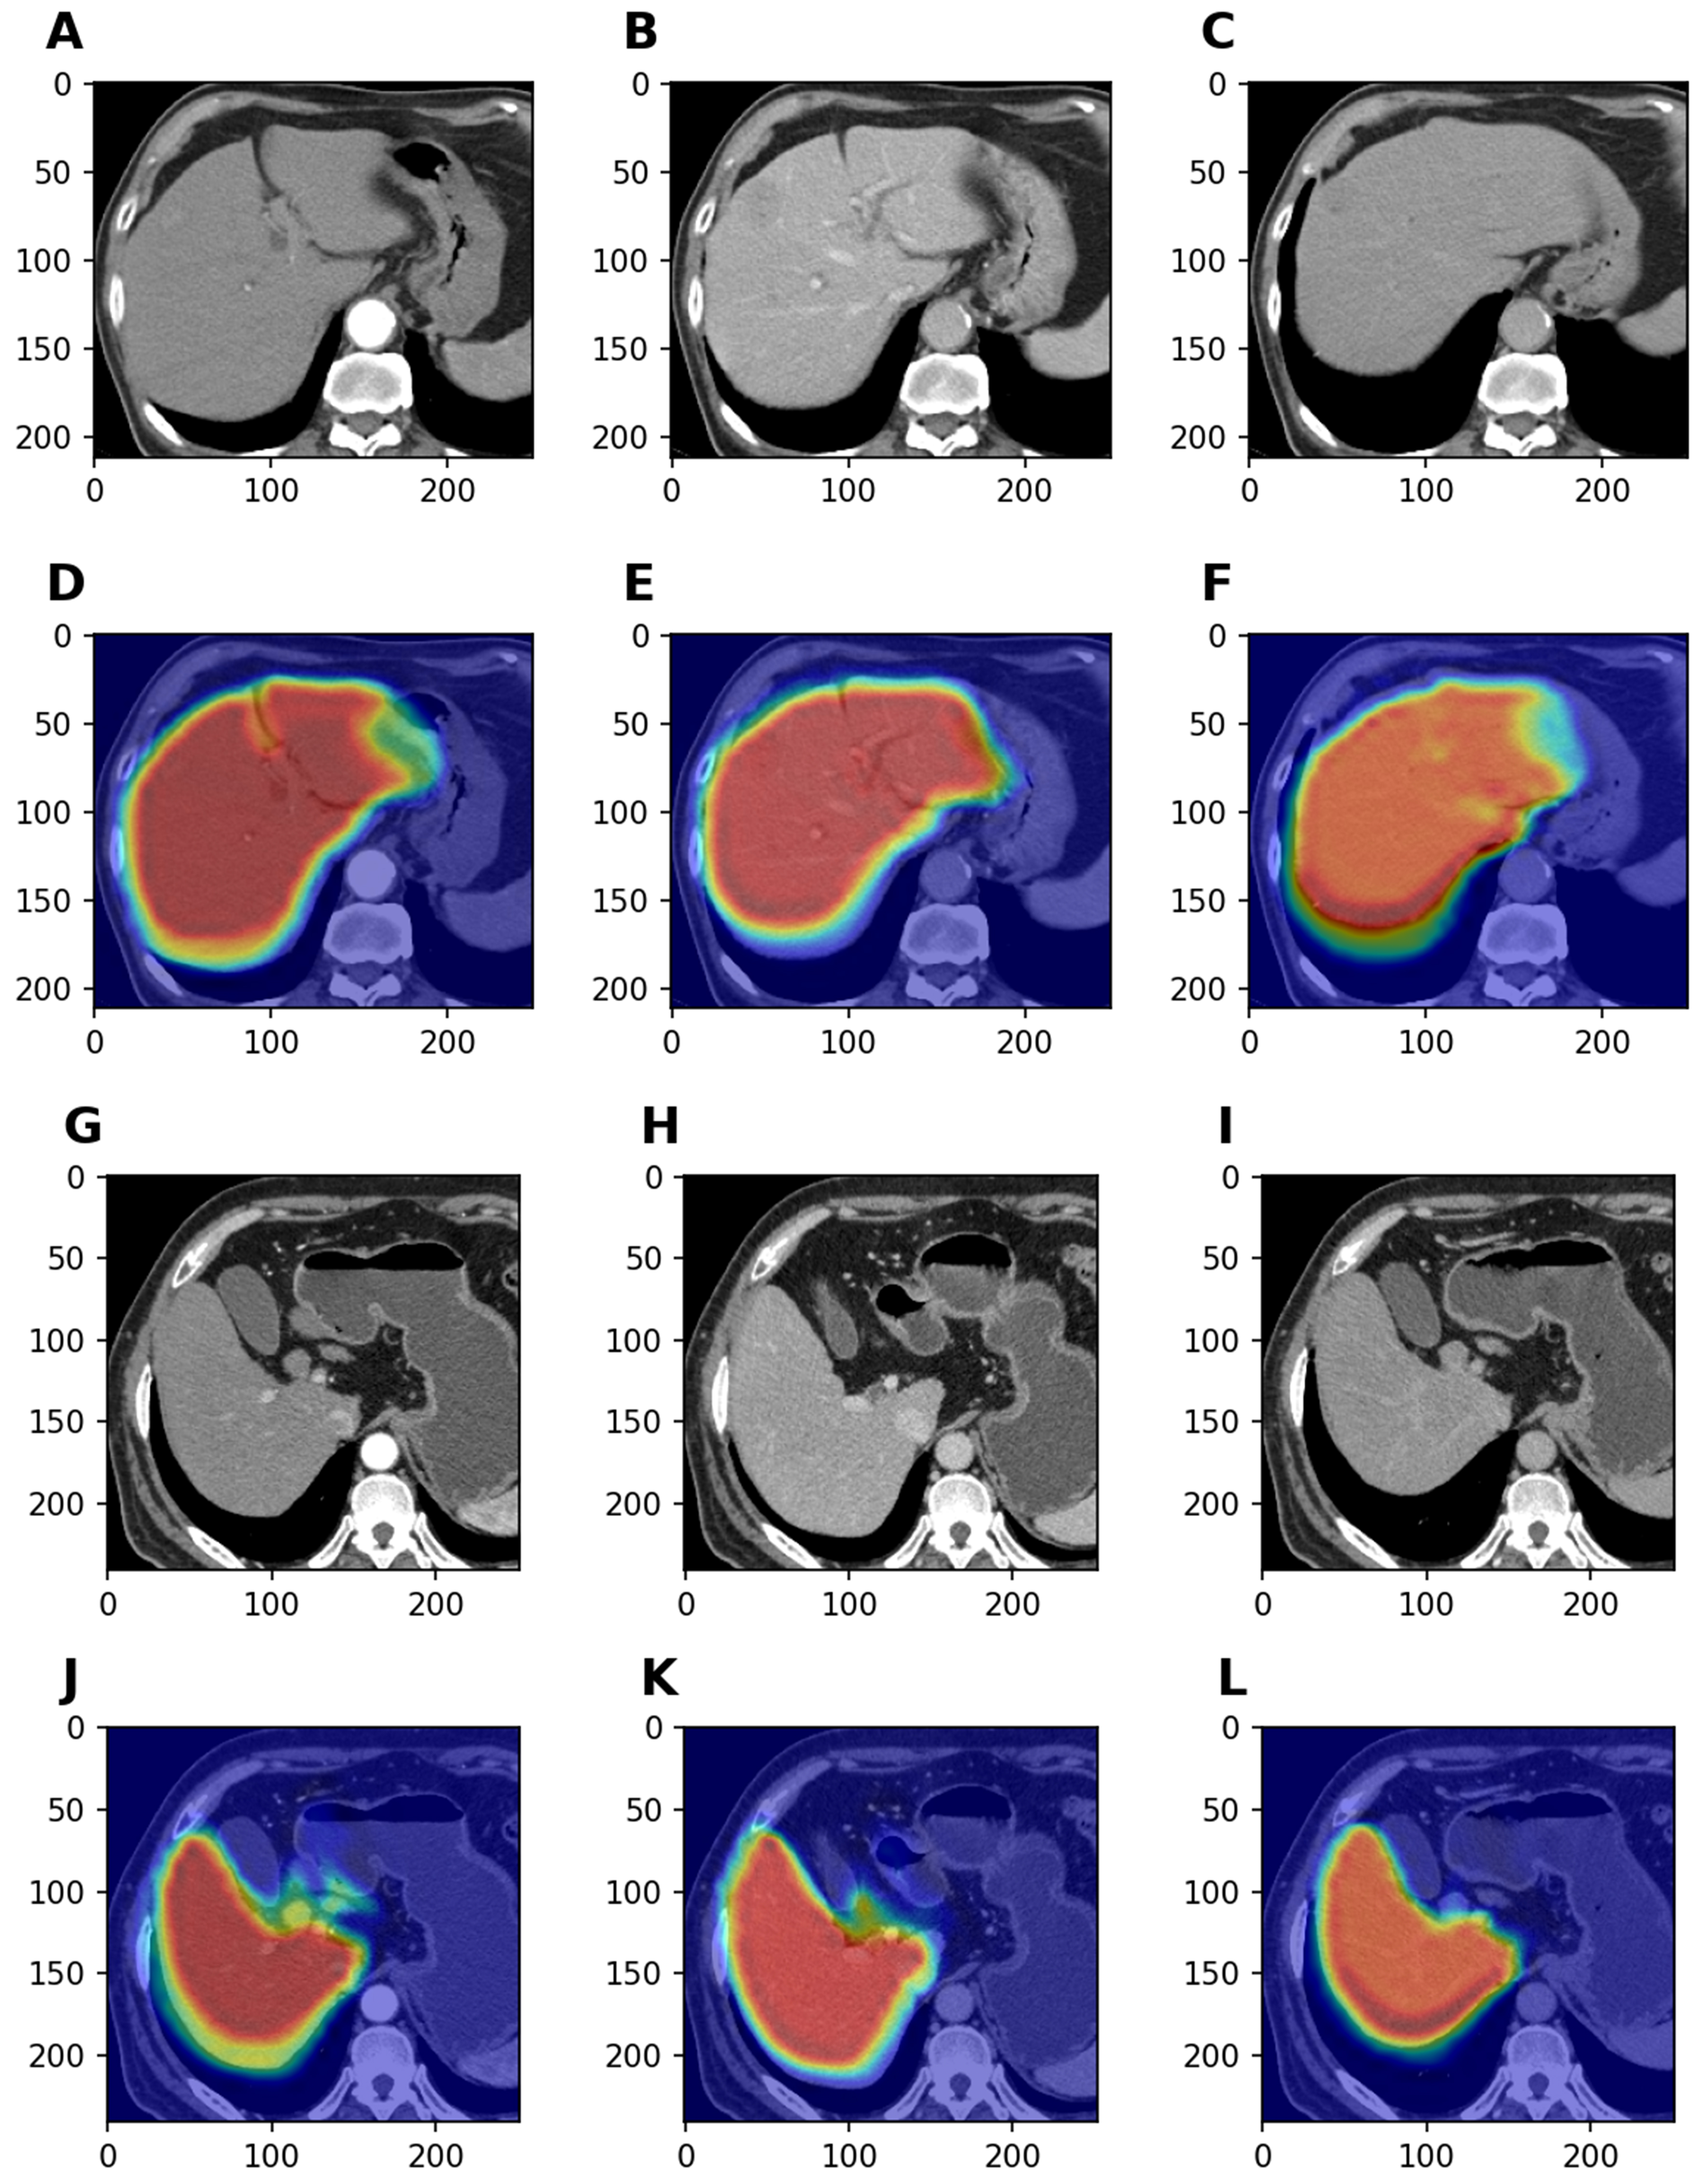
Figure 6. Visual interpretability using CAMs. These images highlight the specific liver regions on which the model focused during feature extraction. (A-F) show representative triphasic CT scans from the training cohort alongside their CAM-overlaid counterparts. Similarly, panel (G-L) displays original and attention-mapped images selected from the validation cohort. CAM: Class activation map; CT: computed tomography.
DISCUSSION
In this study, we developed and validated a multi-task neural network based on triphasic contrast-enhanced CT to simultaneously predict OS, RFS, and MVI status in HCC patients. Given the high recurrence rate in HCC patients and the strong association between recurrence and MVI[21], our model addresses a critical clinical need. The C-index values for OS and RFS, along with the MVI prediction accuracy in the validation cohort, reflect the model’s strong predictive capability, highlighting its significant potential for clinical application. To address the “black box” nature of DL models, we employed CAMs to provide visual insight into the model’s decision-making process by visualizing the most influential tumor and liver regions.
In contrast to traditional neural networks, this study employed a multi-task learning framework to improve model robustness. Compared with previously reported single-task models, such as those proposed by
Data scarcity remains a common challenge in medical imaging analysis. Nevertheless, our model achieved superior performance despite the limited sample size, likely attributable to specific methodological optimizations. First, we focused not only on the tumor but also on the liver and peritumoral areas. Since characteristics such as cirrhosis may be more embedded in the liver tissue, including annotations of both the liver and surrounding tumor area could enhance model performance, as demonstrated by Zhang et al.[26]. Second, the ROI-optimization strategy explicitly removed background noise, allowing the network to focus solely on relevant features. Third, we applied specific augmentation strategies. Traditional augmentations, such as deformation or compression, risk distorting the tumor’s original characteristics; therefore, we limited augmentation to random 3D rotations, which preserved tumor integrity while expanding the training data. For survival analysis tasks, we applied random time jittering to enhance the dataset while maintaining original event indicators, improving model robustness.
Despite the promising findings, several limitations should be acknowledged. First, although the multi-center design and the inclusion of an independent external test cohort (Institution VI) support the model’s robustness, the total sample size (n = 388) remains relatively modest for DL applications. Larger, prospective studies are needed to further validate these results. Second, while our rigorous variability analysis (DSC > 0.90) confirmed that manual segmentation is highly reproducible, it remains a time-consuming process that may hinder rapid clinical workflow. Future iterations of this work will aim to integrate automated segmentation tools, such as nnU-Net, to enhance clinical utility. Third, despite preprocessing efforts, potential selection bias inherent to retrospective studies cannot be entirely eliminated. Looking forward, research in HCC is progressing toward more personalized treatment strategies. Future studies should aim for multimodal analysis, integrating diverse data sources (e.g., molecular biology, pathology) with imaging data, to help overcome the limitations inherent to single modalities.
Beyond predictive accuracy, this model holds substantial potential for optimizing clinical workflows. We propose integrating this tool into the preoperative assessment pipeline, where a risk score is generated alongside standard radiology reports. Patients identified as “High-Risk” may benefit from wider surgical margins or anatomical resection rather than wedge resection to minimize recurrence risk. Furthermore, a high-risk score could serve as an indication for adjuvant therapies, such as TACE or immunotherapy, and warrant discussion in Multidisciplinary Team (MDT) meetings to tailor postoperative surveillance strategies.
In summary, the multi-task neural network model proposed in this study demonstrates strong predictive potential for assessing OS, RFS, and MVI in HCC patients. This provides a robust foundation for enhancing clinical decision-making in the future.
Conclusion
The neural network model proposed in this study offers a novel and effective tool for evaluating MVI, OS, and RFS in HCC patients. It could assist in predicting tumor recurrence and mortality, potentially optimizing clinical decision-making for early-stage HCC patients. Further research is needed to fully assess the model’s clinical utility.
DECLARATIONS
Acknowledgments
We thank Professor Jabed Iqbal from Singapore General Hospital for his suggestions on improving the quality of the article.
Authors’ contributions
Conception and design: Liu R, Zhang X, Wei J
Administrative support: Liu R, Zhang X
Provision of study materials or patients: Zhao L, Wang M, Dang Z
Collection and assembly of data: Ding G, Chen Y, Jia W, Zhang T, Yao Q
Data analysis and interpretation: Jia W, Zhang T, Yao Q, Wei J
Manuscript writing: Jia W, Zhang T, Yao Q
All authors approved the final version of the manuscript.
Availability of data and materials
The datasets generated and/or analyzed during the current study are not publicly available due to individual agency policies but are available from the corresponding author on reasonable request.
AI and AI-assisted tools statement
During the preparation of this manuscript, the AI tool DeepL (DeepL Pro, Individual Plan) was used solely for language editing. The tool did not influence the study design, data collection, analysis, interpretation, or the scientific content of the work. All authors take full responsibility for the accuracy, integrity, and final content of the manuscript.
Financial support and sponsorship
This work was supported by the Beijing Natural Science Foundation (L242144; F252053); the Capital’s Funds for Health Improvement and Research (CFH 2024-4-5026); the Beijing Nova Program (20250484809; 20230484372); the Young Elite Scientists Sponsorship Program by BAST (No. BYESS2024001); the National Key Research and Development Program of China (2022YFC2407402); and the China Scholarship Council (202406180113).
Conflicts of interest
Zhang X is a Junior Editorial Board Member of the journal Hepatoma Research. Zhang X was not involved in any steps of editorial processing, notably including reviewers’ selection, manuscript handling, and decision-making. The other authors declare that there are no conflicts of interest.
Ethical approval and consent to participate
This study was conducted in accordance with the Declaration of Helsinki. The study protocol was approved by the Medical Ethics Committee of the First Affiliated Hospital of the Air Force Medical University (Approval No. KY20232280-X-1). The requirement for written informed consent was waived by the committee due to the retrospective nature of the study.
Consent for publication
Not applicable.
Copyright
© The Author(s) 2026.
Supplementary Materials
REFERENCES
1. Qiu S, Cai J, Yang Z, et al. Trends in hepatocellular carcinoma mortality rates in the US and projections through 2040. JAMA Netw Open. 2024;7:e2445525.
2. Koshy A. Evolving global etiology of hepatocellular carcinoma (HCC): insights and trends for 2024. J Clin Exp Hepatol. 2025;15:102406.
3. Singal AG, Kanwal F, Llovet JM. Global trends in hepatocellular carcinoma epidemiology: implications for screening, prevention and therapy. Nat Rev Clin Oncol. 2023;20:864-84.
4. Yu H, Kong D, Mo X, et al. MRI-based 2.5D deep learning and radiomics effectively predicted microvascular invasion and Ki-67 expression in hepatocellular carcinoma. PLoS One. 2025;20:e0336579.
5. Xia TY, Zhou ZH, Meng XP, et al. Predicting microvascular invasion in hepatocellular carcinoma using CT-based radiomics model. Radiology. 2023;307:e222729.
6. Barcena-Varela M, Monga SP, Lujambio A. Precision models in hepatocellular carcinoma. Nat Rev Gastroenterol Hepatol. 2025;22:191-205.
7. Wang Y, Chi S, Tian Y, et al. Construction of an artificially intelligent model for accurate detection of HCC by integrating clinical, radiological, and peripheral immunological features. Int J Surg. 2025;111:2942-52.
8. Jiang H, Yang C, Chen Y, et al. Development of a model including MRI features for predicting advanced-stage recurrence of hepatocellular carcinoma after liver resection. Radiology. 2023;309:e230527.
9. Xia T, Zhao B, Li B, et al. MRI-based radiomics and deep learning in biological characteristics and prognosis of hepatocellular carcinoma: opportunities and challenges. J Magn Reson Imaging. 2024;59:767-83.
10. Su R, Tao X, Yan L, et al. Early screening, diagnosis and recurrence monitoring of hepatocellular carcinoma in patients with chronic hepatitis B based on serum N-glycomics analysis: a cohort study. Hepatology. 2026;83:40-56.
11. Yu B, Ma W. Biomarker discovery in hepatocellular carcinoma (HCC) for personalized treatment and enhanced prognosis. Cytokine Growth Factor Rev. 2024;79:29-38.
12. An C, Zuo M, Li W, Wu P. An automated machine-learning model for prognostic risk stratification of intermediate-stage hepatocellular carcinoma after transarterial chemoembolization. Int J Surg. 2025;111:6200-10.
13. van der Velden BHM, Kuijf HJ, Gilhuijs KGA, Viergever MA. Explainable artificial intelligence (XAI) in deep learning-based medical image analysis. Med Image Anal. 2022;79:102470.
14. Chen X, Wang X, Zhang K, et al. Recent advances and clinical applications of deep learning in medical image analysis. Med Image Anal. 2022;79:102444.
15. Stahlschmidt SR, Ulfenborg B, Synnergren J. Multimodal deep learning for biomedical data fusion: a review. Brief Bioinform. 2022;23:bbab569.
16. Davri A, Birbas E, Kanavos T, et al. Deep learning for lung cancer diagnosis, prognosis and prediction using histological and cytological images: a systematic review. Cancers. 2023;15:3981.
17. Yan M, Zhang X, Zhang B, et al. Deep learning nomogram based on Gd-EOB-DTPA MRI for predicting early recurrence in hepatocellular carcinoma after hepatectomy. Eur Radiol. 2023;33:4949-61.
18. Wang F, Zhan G, Chen QQ, et al. Multitask deep learning for prediction of microvascular invasion and recurrence-free survival in hepatocellular carcinoma based on MRI images. Liver Int. 2024;44:1351-62.
19. Lu J, Yao J, Zhang J, et al. SOFT: softmax-free transformer with linear complexity. arXiv 2022;arXiv:2110.11945. Available from https://arxiv.org/abs/2110.11945. [accessed 17 April 2026].
20. Golovneva O, Wang T, Weston J, Sukhbaatar S. Contextual position encoding: learning to count what’s important. arXiv 2024;arXiv:2405.18719. Available from https://arxiv.org/abs/2405.18719. [accessed 17 April 2026].
21. Hwang YJ, Bae JS, Lee Y, Hur BY, Lee DH, Kim H. Classification of microvascular invasion of hepatocellular carcinoma: correlation with prognosis and magnetic resonance imaging. Clin Mol Hepatol. 2023;29:733-46.
22. Altaf A, Mustafa A, Dar A, et al. Artificial intelligence-based model for the recurrence of hepatocellular carcinoma after liver transplantation. Surgery. 2024;176:1500-6.
23. Song D, Wang Y, Wang W, et al. Using deep learning to predict microvascular invasion in hepatocellular carcinoma based on dynamic contrast-enhanced MRI combined with clinical parameters. J Cancer Res Clin Oncol. 2021;147:3757-67.
24. Li J, Su X, Xu X, et al. Preoperative prediction and risk assessment of microvascular invasion in hepatocellular carcinoma. Crit Rev Oncol Hematol. 2023;190:104107.
25. Liu Z, Liu Y, Zhang W, et al. Deep learning for prediction of hepatocellular carcinoma recurrence after resection or liver transplantation: a discovery and validation study. Hepatol Int. 2022;16:577-89.
Cite This Article
How to Cite
Download Citation
Export Citation File:
Type of Import
Tips on Downloading Citation
Citation Manager File Format
Type of Import
Direct Import: When the Direct Import option is selected (the default state), a dialogue box will give you the option to Save or Open the downloaded citation data. Choosing Open will either launch your citation manager or give you a choice of applications with which to use the metadata. The Save option saves the file locally for later use.
Indirect Import: When the Indirect Import option is selected, the metadata is displayed and may be copied and pasted as needed.
About This Article
Copyright

Data & Comments
Data
0


Comments
Comments must be written in English. Spam, offensive content, impersonation, and private information will not be permitted. If any comment is reported and identified as inappropriate content by OAE staff, the comment will be removed without notice. If you have any queries or need any help, please contact us at support@oaepublish.com.