

fig5
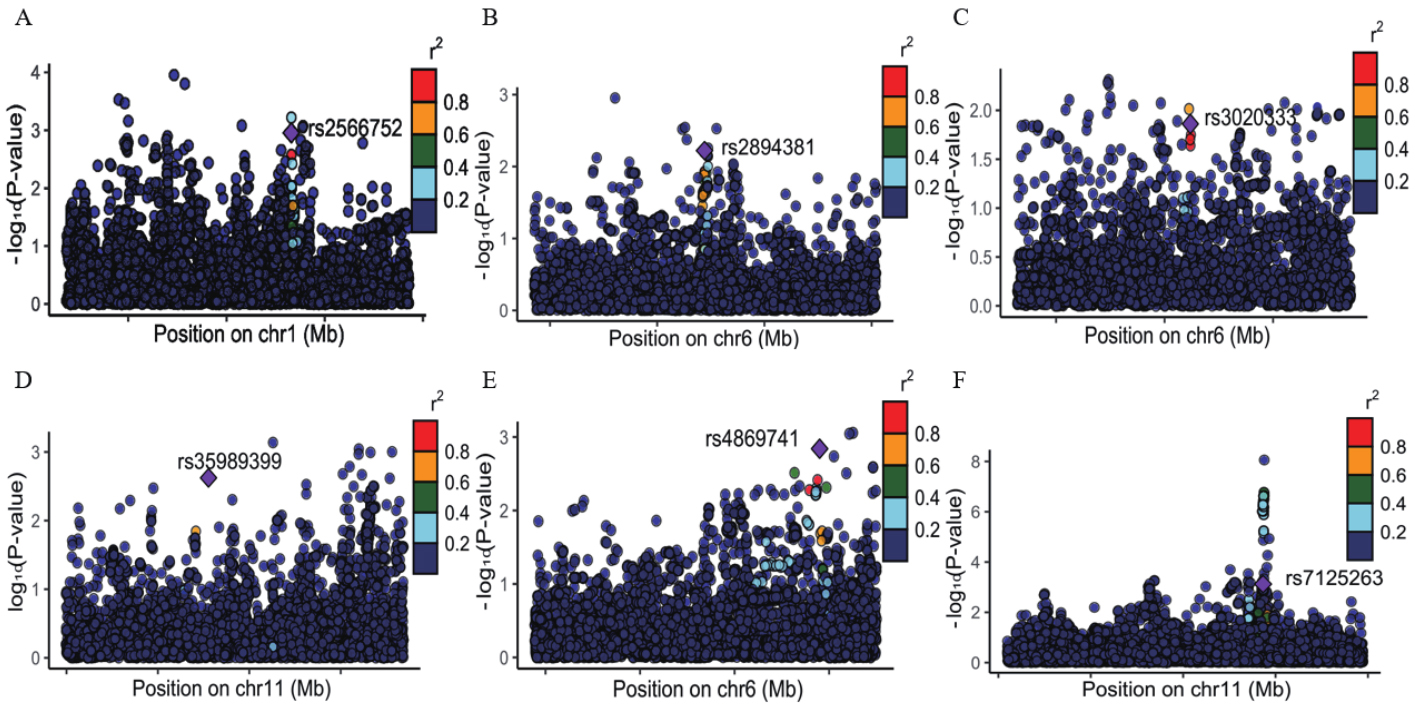
Figure 5. Regional association plots for the six loci with strong colocalization support. (A-F) correspond to rs2566752, rs2894381, rs3020333, rs35989399, rs4869741, and rs7125263, respectively.
Figure 5. Regional association plots for the six loci with strong colocalization support. (A-F) correspond to rs2566752, rs2894381, rs3020333, rs35989399, rs4869741, and rs7125263, respectively.

