

fig4
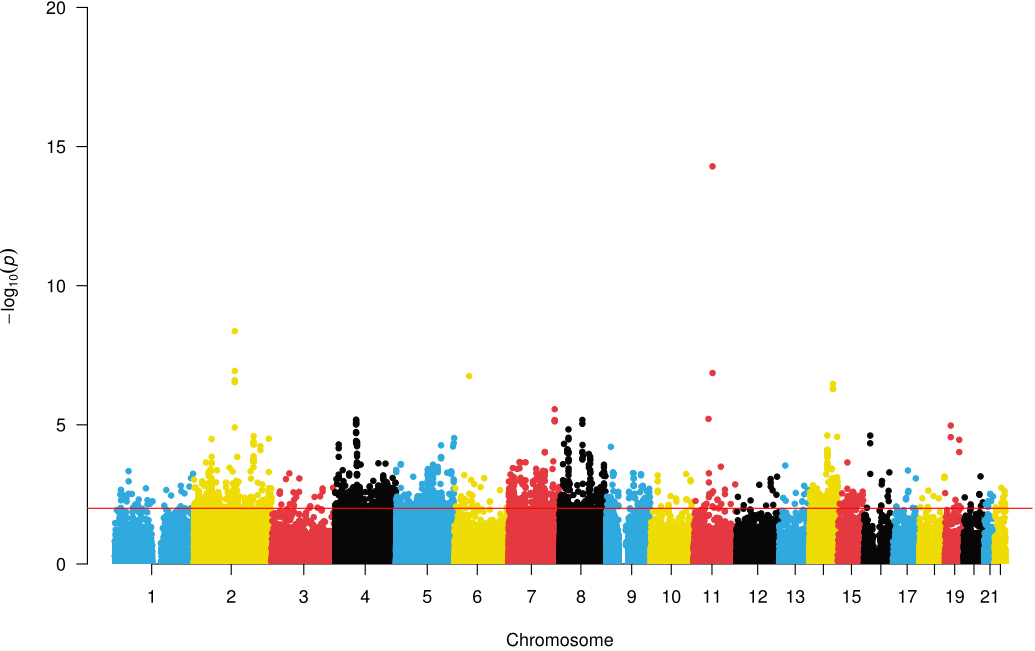
Figure 4. A Manhattan plot showed the correlation between SNPs and common genetic loci. Manhattan plots illustrating the -log10(P-value) connections for each SNP from the GWAS analysis are shown on the y-axis as a function of chromosomal position. The red dashed line represents the threshold for genome-wide significance. SNP: single-nucleotide polymorphism; GWAS: genome-wide association studies.

