

fig2
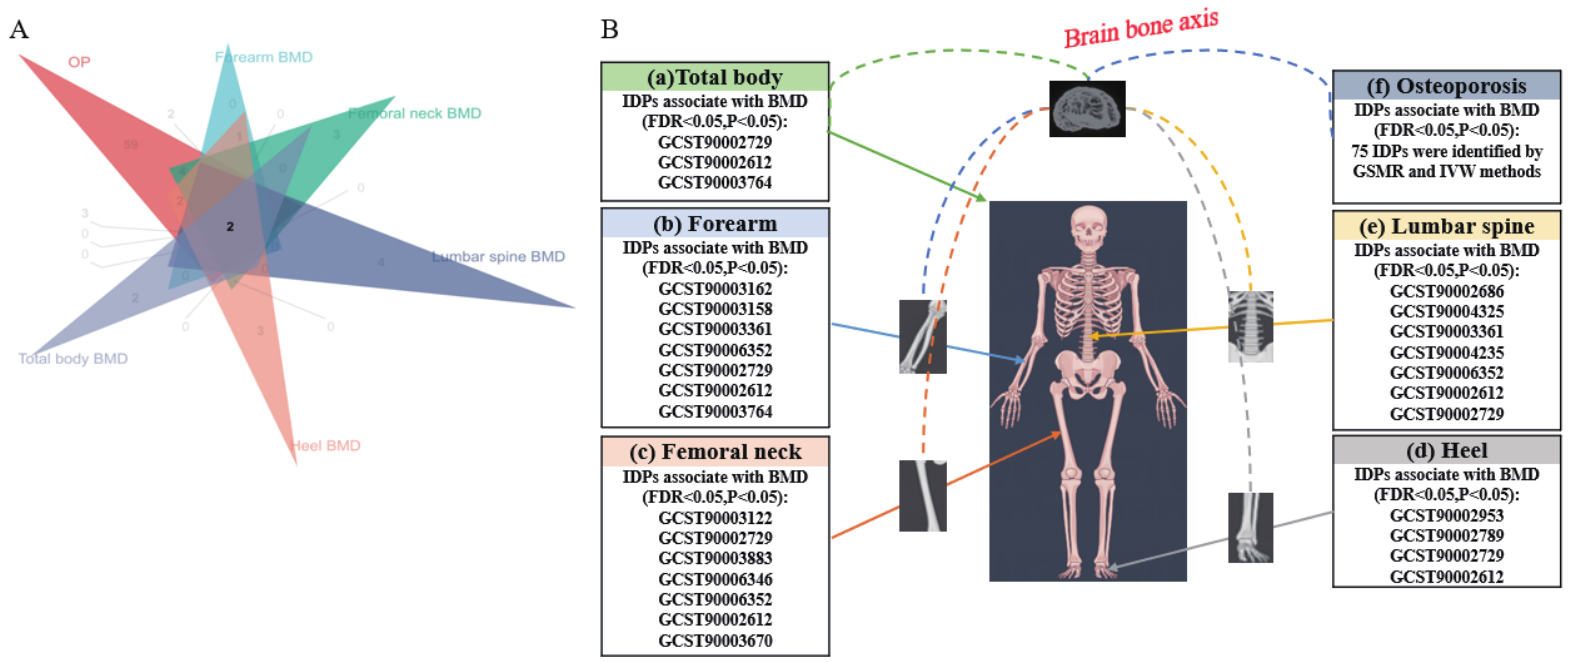
Figure 2. Mendelian randomization screening and validation of imaging-derived phenotypes associated with osteoporosis and bone mineral density. (A) Venn diagram summarizing significant findings after discovery and validation; (B) Panels a to f show effect estimates for validated imaging-derived phenotypes across total body bone mineral density, forearm bone mineral density, femoral neck bone mineral density, heel bone mineral density, lumbar spine bone mineral density, and osteoporosis. The imaging illustration was created entirely by the authors using Adobe Illustrator. IDP: Imaging-derived phenotype; FDR: false discovery rate; BMD: bone mineral density.

